Analysis Modeling
Basic aimof analysis modeling is to create the
model that represents the information,functions
and behavior of the system to be built.
Afterwards these all are translated into
architectural,interface and component level
designs in design modeling.
Analysis model acts as a bridge between
system description and design model.
3.
Objectives of analysismodeling
1.To state clearly what customer wants exactly.
2.To establish the basic of the design model.
3.To define the set of requirement
4.
Analysis modeling approaches
Analysismodeling is the first technical
representation of system
Methods for analysis modeling are:-
1.Structured analysis
2.Object oriented analysis.
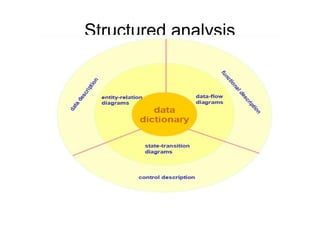
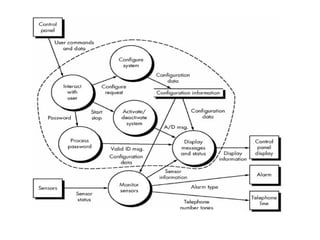
Structure of structuredanalysis model is as shown in above
fig.
At the center of model is a data dictionary.
Data dictionary is a repository that contains descriptions or
information of all data objects used or created by the software.
Surrounding area of the core is occupied by different diagrams
such as:-
1.E-R diagram
2.Data Flow Diagram
3.State transition diagram
7.
1. E-R diagram
E-Rdiagram is mainly used to represent
the relationship between two entities or
data objects.
This diagram is used to execute data
modeling activity.
The additional information about data
objects can be given with the help of data
objects description.
8.
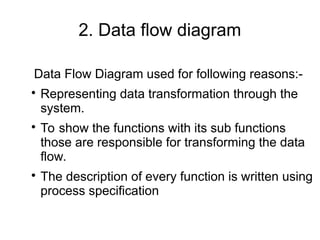
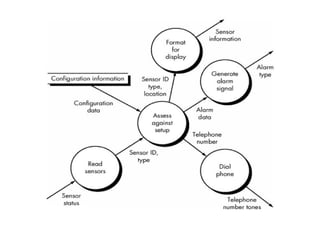
2. Data flowdiagram
Data Flow Diagram used for following reasons:-
Representing data transformation through the
system.
To show the functions with its sub functions
those are responsible for transforming the data
flow.
The description of every function is written using
process specification
9.
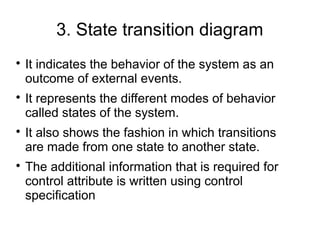
3. State transitiondiagram
It indicates the behavior of the system as an
outcome of external events.
It represents the different modes of behavior
called states of the system.
It also shows the fashion in which transitions
are made from one state to another state.
The additional information that is required for
control attribute is written using control
specification
10.
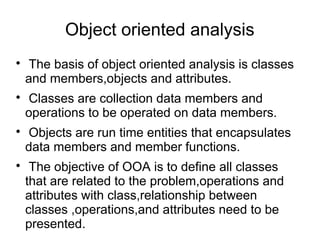
Object oriented analysis
Thebasis of object oriented analysis is classes
and members,objects and attributes.
Classes are collection data members and
operations to be operated on data members.
Objects are run time entities that encapsulates
data members and member functions.
The objective of OOA is to define all classes
that are related to the problem,operations and
attributes with class,relationship between
classes ,operations,and attributes need to be
presented.
11.
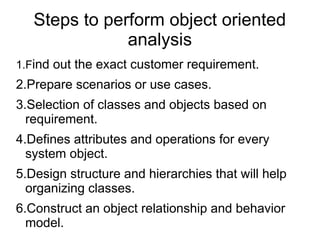
Steps to performobject oriented
analysis
1.Find out the exact customer requirement.
2.Prepare scenarios or use cases.
3.Selection of classes and objects based on
requirement.
4.Defines attributes and operations for every
system object.
5.Design structure and hierarchies that will help
organizing classes.
6.Construct an object relationship and behavior
model.
12.
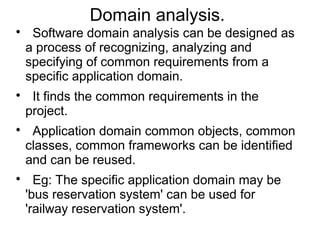
Domain analysis.
Software domainanalysis can be designed as
a process of recognizing, analyzing and
specifying of common requirements from a
specific application domain.
It finds the common requirements in the
project.
Application domain common objects, common
classes, common frameworks can be identified
and can be reused.
Eg: The specific application domain may be
'bus reservation system' can be used for
'railway reservation system'.
13.
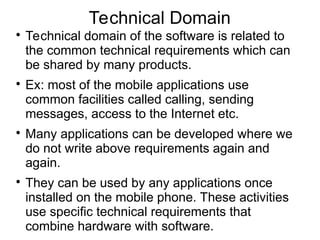
Technical Domain
Technical domainof the software is related to
the common technical requirements which can
be shared by many products.
Ex: most of the mobile applications use
common facilities called calling, sending
messages, access to the Internet etc.
Many applications can be developed where we
do not write above requirements again and
again.
They can be used by any applications once
installed on the mobile phone. These activities
use specific technical requirements that
combine hardware with software.
14.
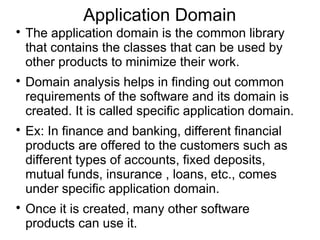
Application Domain
The applicationdomain is the common library
that contains the classes that can be used by
other products to minimize their work.
Domain analysis helps in finding out common
requirements of the software and its domain is
created. It is called specific application domain.
Ex: In finance and banking, different financial
products are offered to the customers such as
different types of accounts, fixed deposits,
mutual funds, insurance , loans, etc., comes
under specific application domain.
Once it is created, many other software
products can use it.
15.
Goals of DomainAnalysis
1.Find out common requirement specification.
2.To save the time.
3.Reduce the repeated or duplicate work.
4.Reduction in the complications of the project.
5.To make library of classes available.
6.To enhance the portability.
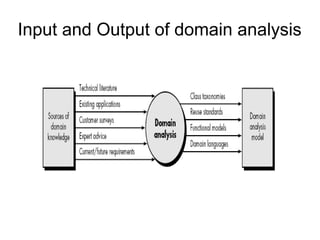
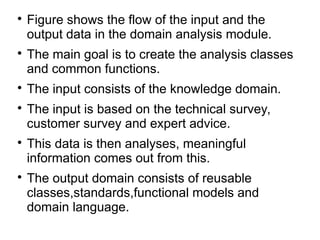
Figure shows theflow of the input and the
output data in the domain analysis module.
The main goal is to create the analysis classes
and common functions.
The input consists of the knowledge domain.
The input is based on the technical survey,
customer survey and expert advice.
This data is then analyses, meaningful
information comes out from this.
The output domain consists of reusable
classes,standards,functional models and
domain language.
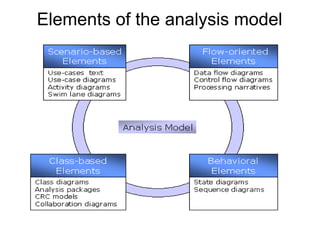
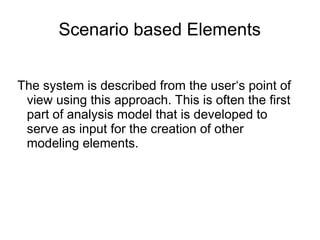
Scenario based Elements
Thesystem is described from the user‘s point of
view using this approach. This is often the first
part of analysis model that is developed to
serve as input for the creation of other
modeling elements.
20.
Class-based Elements
Each usagescenario implies a set of objects that
are manipulated as an actor interacts with the
system. These objects are categorized into
classes – a collection of things that have
similar attributes and common behaviors.
21.
Behavioral Elements
The behaviorof the system can have profound
effect on the design that is chosen. The
analysis model must provide modeling
elements that depict the behavior. The state
diagram is one of the methods for representing
behavior of a system.
22.
Flow-Oriented Elements
The informationis transformed as it flows
through the computer based system. The
system accepts inputs in a variety of forms,
applies functions to transform it; and produces
output in different forms. The transforms may
comprise a single logical comparison, a
complex numerical algorithm or an expert
system. The elements of the information flow
are included here.
23.
Data modeling concepts
Itincludes :-
1.Data objects
2.Data attributes
3.Data relationship
4.Cardinality and Modality
24.
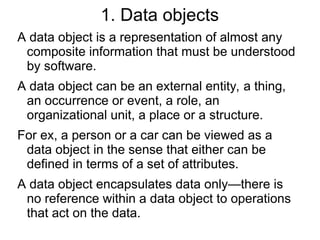
1. Data objects
Adata object is a representation of almost any
composite information that must be understood
by software.
A data object can be an external entity, a thing,
an occurrence or event, a role, an
organizational unit, a place or a structure.
For ex, a person or a car can be viewed as a
data object in the sense that either can be
defined in terms of a set of attributes.
A data object encapsulates data only—there is
no reference within a data object to operations
that act on the data.
25.
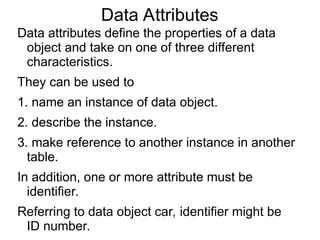
Data Attributes
Data attributesdefine the properties of a data
object and take on one of three different
characteristics.
They can be used to
1. name an instance of data object.
2. describe the instance.
3. make reference to another instance in another
table.
In addition, one or more attribute must be
identifier.
Referring to data object car, identifier might be
ID number.
26.
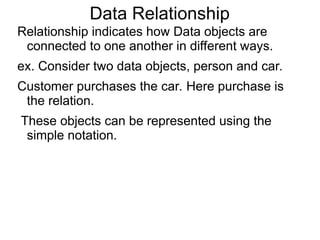
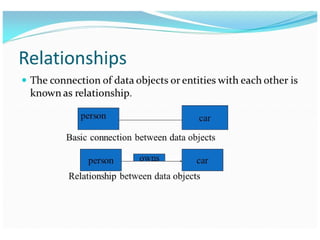
Data Relationship
Relationship indicateshow Data objects are
connected to one another in different ways.
ex. Consider two data objects, person and car.
Customer purchases the car. Here purchase is
the relation.
These objects can be represented using the
simple notation.
28.
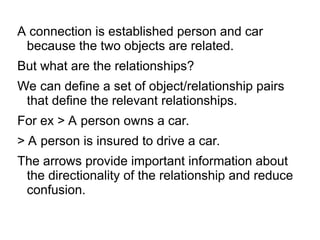
A connection isestablished person and car
because the two objects are related.
But what are the relationships?
We can define a set of object/relationship pairs
that define the relevant relationships.
For ex > A person owns a car.
> A person is insured to drive a car.
The arrows provide important information about
the directionality of the relationship and reduce
confusion.
29.
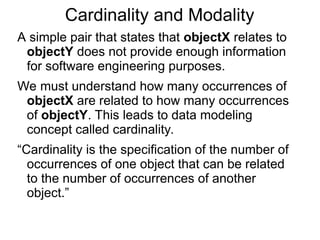
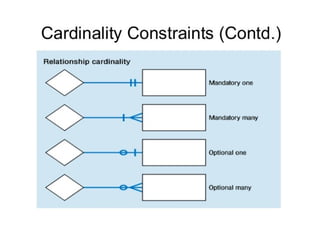
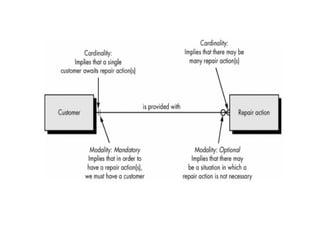
Cardinality and Modality
Asimple pair that states that objectX relates to
objectY does not provide enough information
for software engineering purposes.
We must understand how many occurrences of
objectX are related to how many occurrences
of objectY. This leads to data modeling
concept called cardinality.
“Cardinality is the specification of the number of
occurrences of one object that can be related
to the number of occurrences of another
object.”
30.
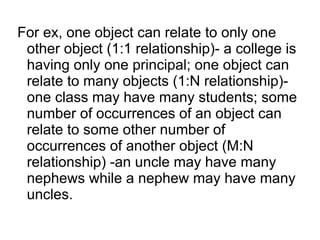
For ex, oneobject can relate to only one
other object (1:1 relationship)- a college is
having only one principal; one object can
relate to many objects (1:N relationship)-
one class may have many students; some
number of occurrences of an object can
relate to some other number of
occurrences of another object (M:N
relationship) -an uncle may have many
nephews while a nephew may have many
uncles.
31.
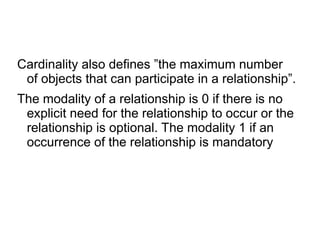
Cardinality also defines”the maximum number
of objects that can participate in a relationship”.
The modality of a relationship is 0 if there is no
explicit need for the relationship to occur or the
relationship is optional. The modality 1 if an
occurrence of the relationship is mandatory
34.
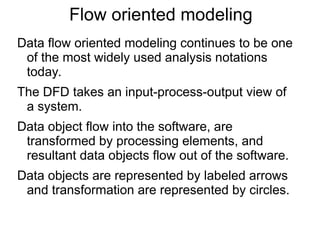
Flow oriented modeling
Dataflow oriented modeling continues to be one
of the most widely used analysis notations
today.
The DFD takes an input-process-output view of
a system.
Data object flow into the software, are
transformed by processing elements, and
resultant data objects flow out of the software.
Data objects are represented by labeled arrows
and transformation are represented by circles.
35.
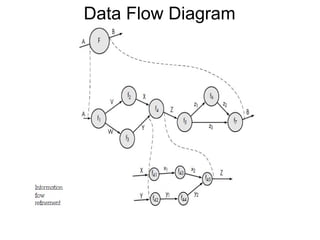
Data flow diagram
DFDenables the software engineer to develop
models of the information domain and
functional domain at the same time.
36.
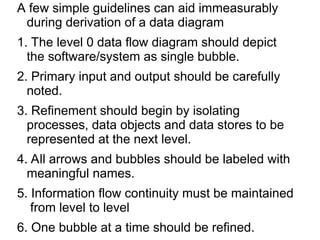
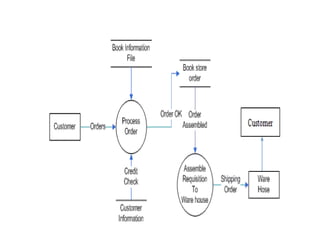
A few simpleguidelines can aid immeasurably
during derivation of a data diagram
1. The level 0 data flow diagram should depict
the software/system as single bubble.
2. Primary input and output should be carefully
noted.
3. Refinement should begin by isolating
processes, data objects and data stores to be
represented at the next level.
4. All arrows and bubbles should be labeled with
meaningful names.
5. Information flow continuity must be maintained
from level to level
6. One bubble at a time should be refined.
37.
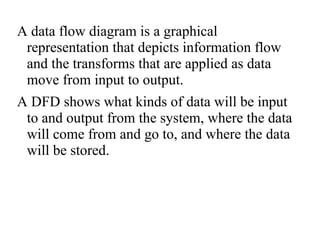
A data flowdiagram is a graphical
representation that depicts information flow
and the transforms that are applied as data
move from input to output.
A DFD shows what kinds of data will be input
to and output from the system, where the data
will come from and go to, and where the data
will be stored.
39.
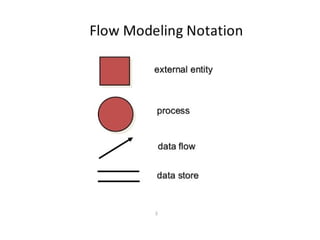
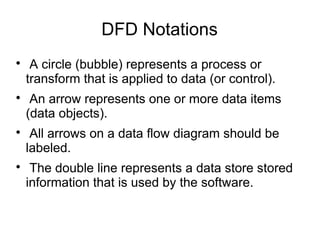
DFD Notations
A circle(bubble) represents a process or
transform that is applied to data (or control).
An arrow represents one or more data items
(data objects).
All arrows on a data flow diagram should be
labeled.
The double line represents a data store stored
information that is used by the software.
40.
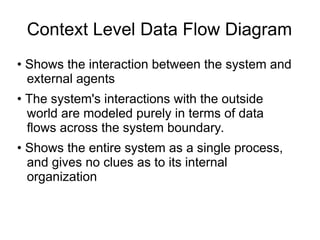
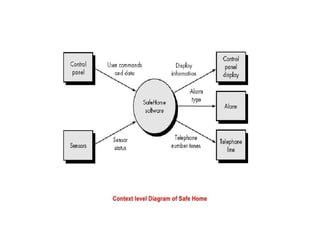
Context Level DataFlow Diagram
• Shows the interaction between the system and
external agents
• The system's interactions with the outside
world are modeled purely in terms of data
flows across the system boundary.
• Shows the entire system as a single process,
and gives no clues as to its internal
organization
41.
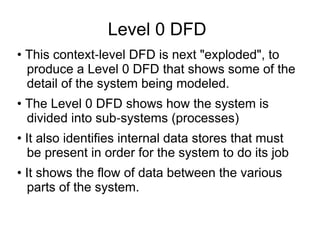
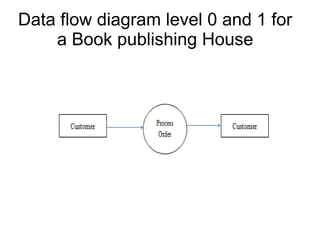
Level 0 DFD
•This context level DFD is next "exploded", to
‐
produce a Level 0 DFD that shows some of the
detail of the system being modeled.
• The Level 0 DFD shows how the system is
divided into sub systems (processes)
‐
• It also identifies internal data stores that must
be present in order for the system to do its job
• It shows the flow of data between the various
parts of the system.
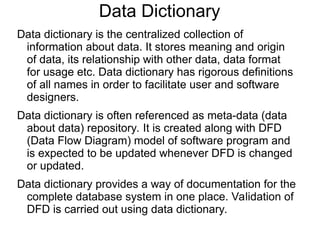
Data Dictionary
Data dictionaryis the centralized collection of
information about data. It stores meaning and origin
of data, its relationship with other data, data format
for usage etc. Data dictionary has rigorous definitions
of all names in order to facilitate user and software
designers.
Data dictionary is often referenced as meta-data (data
about data) repository. It is created along with DFD
(Data Flow Diagram) model of software program and
is expected to be updated whenever DFD is changed
or updated.
Data dictionary provides a way of documentation for the
complete database system in one place. Validation of
DFD is carried out using data dictionary.
49.
Requirement of DataDictionary
The data is referenced via data dictionary while
designing and implementing software. Data
dictionary removes any chances of ambiguity.
It helps keeping work of programmers and
designers synchronized while using same
object reference everywhere in the program.
50.
Contents
Data dictionary shouldcontain information about
the following
1. Data Flow
2. Data Structure
3. Data Elements
4. Data Stores
5. Data Processing
51.
Data Flow isdescribed by means of DFDs as
studied earlier and represented in algebraic
form as described.
= Composed of
{} Repetition
() Optional
+ And
[ / ] Or
Example: Address = House No + (Street / Area)
+ City + State
Course ID = Course Number + Course Name +
Course Level + Course Grades
52.
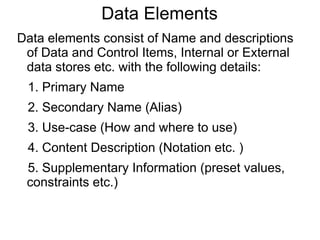
Data Elements
Data elementsconsist of Name and descriptions
of Data and Control Items, Internal or External
data stores etc. with the following details:
1. Primary Name
2. Secondary Name (Alias)
3. Use-case (How and where to use)
4. Content Description (Notation etc. )
5. Supplementary Information (preset values,
constraints etc.)
53.
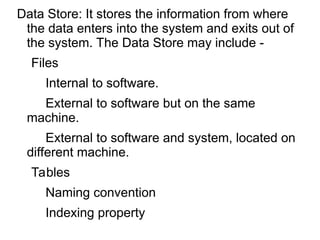
Data Store: Itstores the information from where
the data enters into the system and exits out of
the system. The Data Store may include -
Files
Internal to software.
External to software but on the same
machine.
External to software and system, located on
different machine.
Tables
Naming convention
Indexing property
54.
Data Processing
There aretwo types of Data Processing:
Logical: As user sees it
Physical: As software sees it
56.
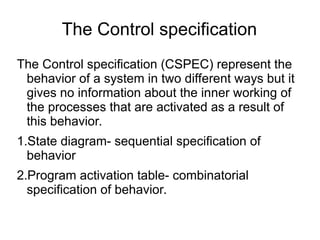
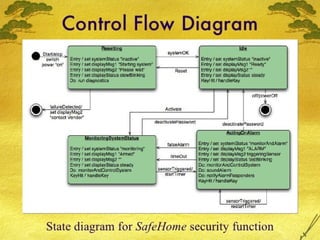
The Control specification
TheControl specification (CSPEC) represent the
behavior of a system in two different ways but it
gives no information about the inner working of
the processes that are activated as a result of
this behavior.
1.State diagram- sequential specification of
behavior
2.Program activation table- combinatorial
specification of behavior.
58.
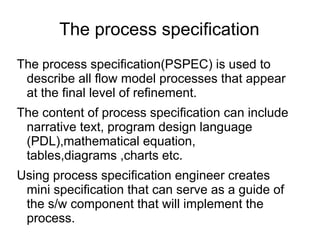
The process specification
Theprocess specification(PSPEC) is used to
describe all flow model processes that appear
at the final level of refinement.
The content of process specification can include
narrative text, program design language
(PDL),mathematical equation,
tables,diagrams ,charts etc.
Using process specification engineer creates
mini specification that can serve as a guide of
the s/w component that will implement the
process.
59.
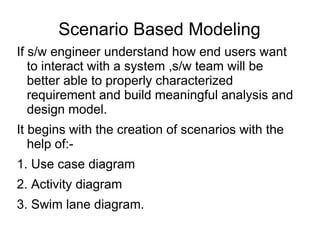
Scenario Based Modeling
Ifs/w engineer understand how end users want
to interact with a system ,s/w team will be
better able to properly characterized
requirement and build meaningful analysis and
design model.
It begins with the creation of scenarios with the
help of:-
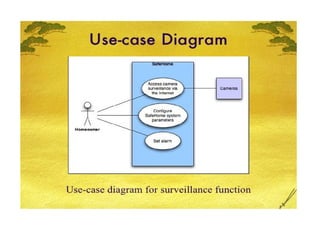
1. Use case diagram
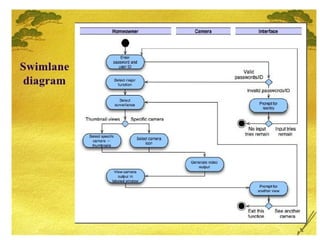
2. Activity diagram
3. Swim lane diagram.
60.
Developing/writing use cases
Theuse case captures the interaction that occur
between producers and consumers of
information and system itself.
61.
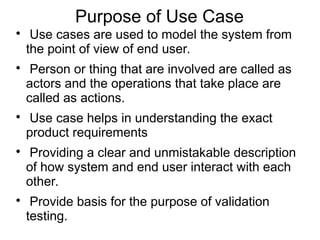
Purpose of UseCase
Use cases are used to model the system from
the point of view of end user.
Person or thing that are involved are called as
actors and the operations that take place are
called as actions.
Use case helps in understanding the exact
product requirements
Providing a clear and unmistakable description
of how system and end user interact with each
other.
Provide basis for the purpose of validation
testing.
63.
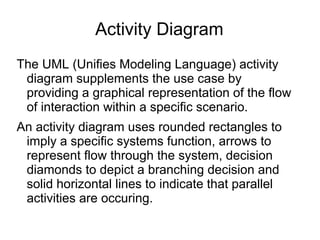
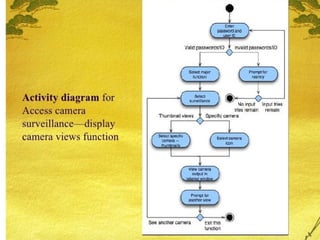
Activity Diagram
The UML(Unifies Modeling Language) activity
diagram supplements the use case by
providing a graphical representation of the flow
of interaction within a specific scenario.
An activity diagram uses rounded rectangles to
imply a specific systems function, arrows to
represent flow through the system, decision
diamonds to depict a branching decision and
solid horizontal lines to indicate that parallel
activities are occuring.
66.
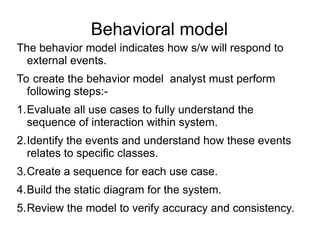
Behavioral model
The behaviormodel indicates how s/w will respond to
external events.
To create the behavior model analyst must perform
following steps:-
1.Evaluate all use cases to fully understand the
sequence of interaction within system.
2.Identify the events and understand how these events
relates to specific classes.
3.Create a sequence for each use case.
4.Build the static diagram for the system.
5.Review the model to verify accuracy and consistency.
67.
A event occurswhenever the system and an
actor exchange information.
It is important to note that an event is not the
information that has been exchanged,but
rather the fact
fact that information has been
exchanged.
68.
Example. Homeowner entersa 4-digit pwd.
here object homeowner transmits an
event to the object control panel. here
event is password entered. The
information transferred is 4-digit that
constitute the pwd,but this is not an
essential part of behavioral model.
It is imp to note that some events have an
explicit impact on the flow of control of
use case,while others have no direct
impact on the flow of control.
69.
Event pwd entereddoes not explicitly
change the flow of control but the result of
event compare password will have
explicit impact on the information and
control flow of safe home system.
70.
Event pwd entereddoes not explicitly
change the flow of control but the result of
event compare password will have
explicit impact on the information and
control flow of safe home system.
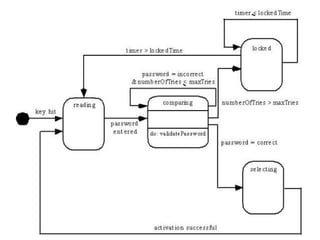
71.
State Representation
Two differentcharacterizations of states must be
considered.
I) It shows how change proceed over time, it
shows the dynamic nature of a system.
II) Clarify following things for state diagram
- identify object
- identify state
- identify event.
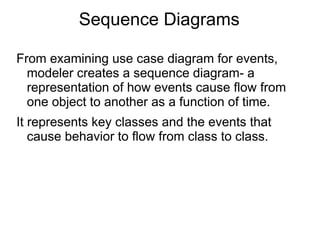
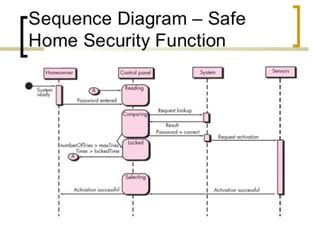
Sequence Diagrams
From examininguse case diagram for events,
modeler creates a sequence diagram- a
representation of how events cause flow from
one object to another as a function of time.
It represents key classes and the events that
cause behavior to flow from class to class.
76.
Design modeling
Software designis an iterative process that is
used to translate requirement into design
model or blueprint of the construction of the
s/w.
Throughout the design process the quality of the
evolving design is assessed with a series of
formal technical reviews and code
walkthroughs.
78.
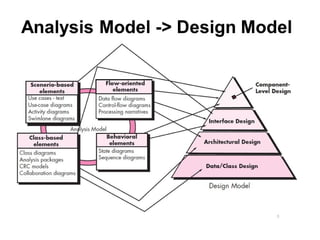
Each element ofthe analysis model provides
information that is necessary to create the four design
models
The data/class design transforms analysis classes
into design classes along with the data structures
required to implement the software
The architectural design defines the relationship
between major structural elements of the software;
architectural styles and design patterns help achieve
the requirements defined for the system
The interface design describes how the software
communicates with systems that interoperate with it
and with humans that use it
The component-level design transforms structural
elements of the software architecture into a
procedural description of software components
79.
Three characteristics forthe evaluation of good
design:-
1. The design must implement all of the explicit
requirements contained in the analysis
model,and it must include all of the implicit
requirement desired by the customer.
2. Design must be readable and understandable
to everyone.
3. The design need to give complete idea or
picture of s/w,addressing the data , functional ,
behavioral domain.
80.
Design quality guidelines.
1.Adesign should show architecture i.e.
developed with the help of understandable
patterns,styles,components that are having
characteristics of good design.
2.A design should be modular. Because of that
s/w can be partitioned logically into elements.
3.A design should contain different
representation of components ,interfaces ,
architectures and data.
4.A design should have appropriate classes and
data structures to be implemented,sourced
from recognizable data patterns.
81.
5. A designshould lead to components that
exhibits independent functional characteristics.
6. A design should lead to interfaces that reduce
the complexity of connection between
components and with the external environment.
7. A design should be derived using a repeatable
method that is driven by information obtained
during analysis.
8. Design should be presented using a notation
that effectively communicates its meaning.
Abstraction
-Procedural abstraction –a sequence of
instructions that have a specific and limited
function
-Data abstraction – a named collection of data
that describes a data object
Architecture
-The overall structure of the software and the
ways in which the structure provides conceptual
integrity for a system
-Consists of components, connectors, and the
relationship between them
84.
Patterns
-A design structurethat solves a particular
design problem within a specific context
-It provides a description that enables a
designer to determine whether the pattern is
applicable, whether the pattern can be reused,
and whether the pattern can serve as a guide
for developing similar patterns
Modularity
-Separately named and addressable
components (i.e., modules) that are integrated
to satisfy requirements (divide and conquer
principle)
85.
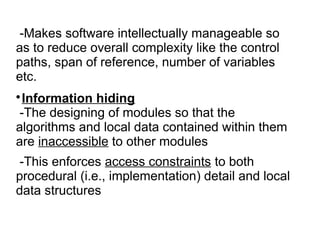
-Makes software intellectuallymanageable so
as to reduce overall complexity like the control
paths, span of reference, number of variables
etc.
Information hiding
-The designing of modules so that the
algorithms and local data contained within them
are inaccessible to other modules
-This enforces access constraints to both
procedural (i.e., implementation) detail and local
data structures
86.
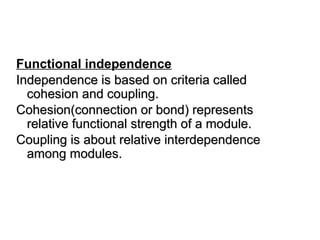
Functional independence
Independence isbased on criteria called
Independence is based on criteria called
cohesion and coupling.
cohesion and coupling.
Cohesion(connection or bond) represents
Cohesion(connection or bond) represents
relative functional strength of a module.
relative functional strength of a module.
Coupling is about relative interdependence
Coupling is about relative interdependence
among modules.
among modules.
87.
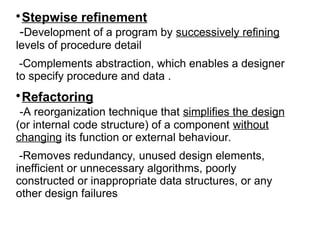
Stepwise refinement
-Development ofa program by successively refining
levels of procedure detail
-Complements abstraction, which enables a designer
to specify procedure and data .
Refactoring
-A reorganization technique that simplifies the design
(or internal code structure) of a component without
changing its function or external behaviour.
-Removes redundancy, unused design elements,
inefficient or unnecessary algorithms, poorly
constructed or inappropriate data structures, or any
other design failures
88.
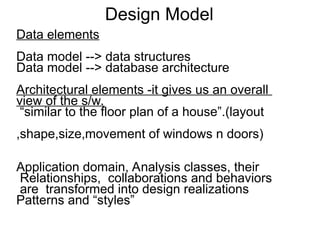
Design Model
Data elements
Datamodel --> data structures
Data model --> database architecture
Architectural elements -it gives us an overall
view of the s/w.
“similar to the floor plan of a house”.(layout
,shape,size,movement of windows n doors)
Application domain, Analysis classes, their
Relationships, collaborations and behaviors
are transformed into design realizations
Patterns and “styles”
89.
Interface elements “Theway in which utilities
connections come into the house and are
distributed among the rooms”
the user interface (UI) external interfaces to
other systems, devices, networks or other
producers or consumers of information
internal interfaces between various design
components.
90.
Component elements
It isequivalent to a set of detailed drawings
and specifications
for each room in a house.
The component-level design for software fully
describes the internal detail of each software
component.
Deployment elements
Indicates how software functionally and
subsystem terms will be allocated within the
physical computing environment that will
support the software.
For more Details contact us


![Data Flow is described by means of DFDs as
studied earlier and represented in algebraic
form as described.
= Composed of
{} Repetition
() Optional
+ And
[ / ] Or
Example: Address = House No + (Street / Area)
+ City + State
Course ID = Course Number + Course Name +
Course Level + Course Grades](https://image.slidesharecdn.com/softwareengg-chap-03-250924095748-0194b93c/85/Software_Engineering-Chapter-03-Notes-ppt-51-320.jpg)