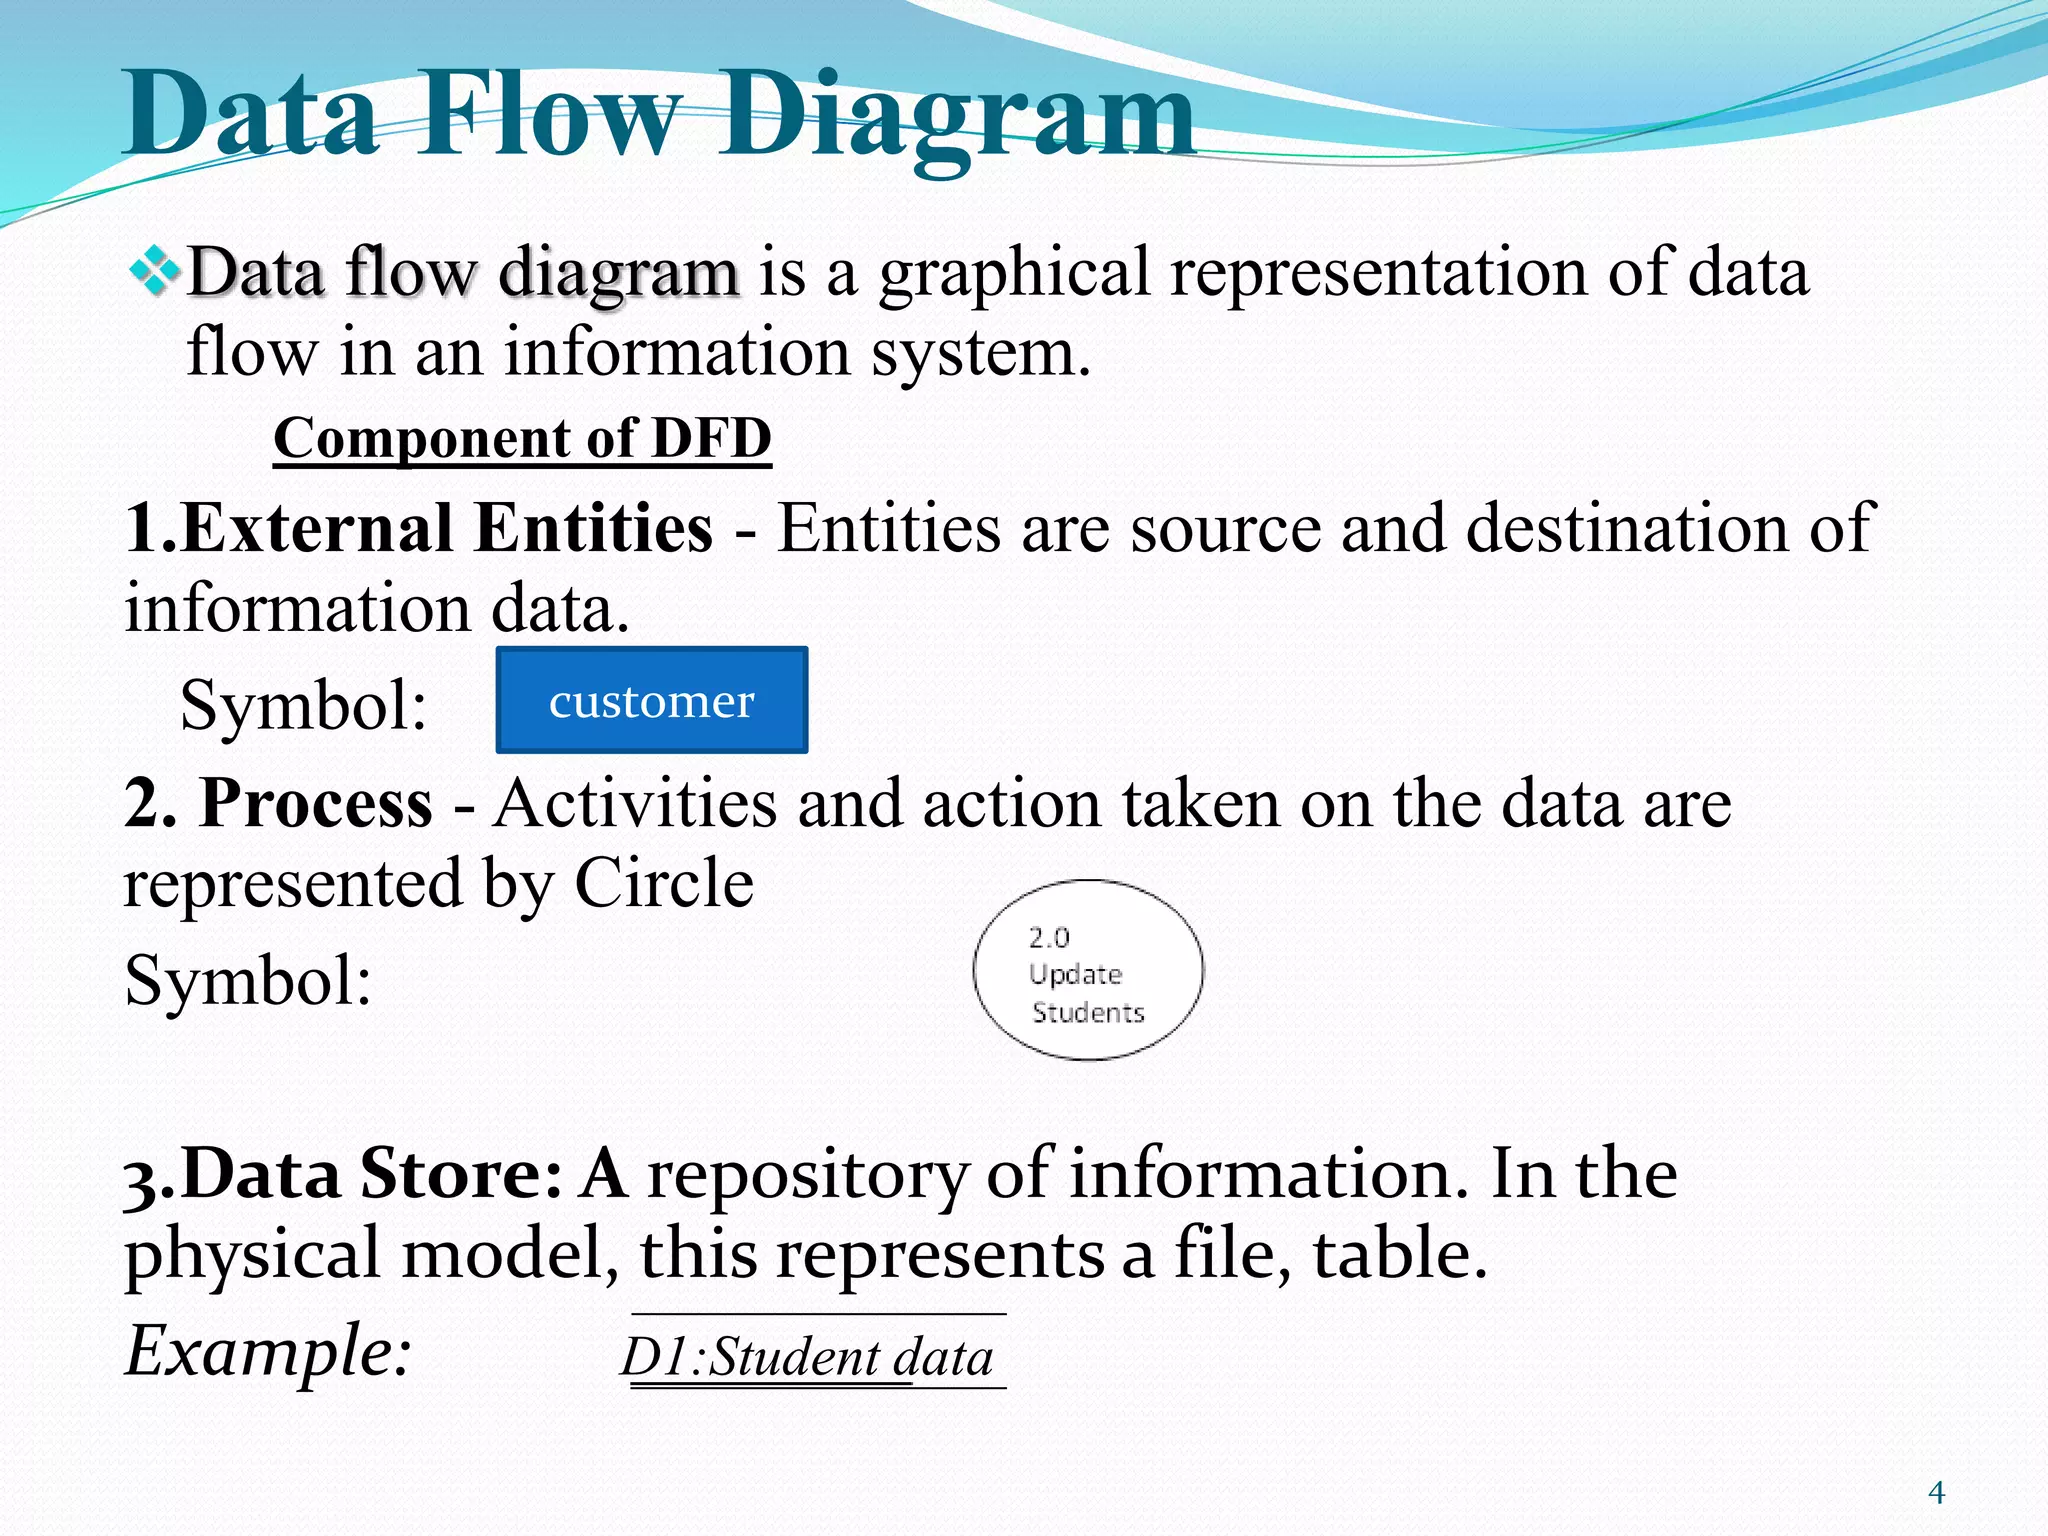
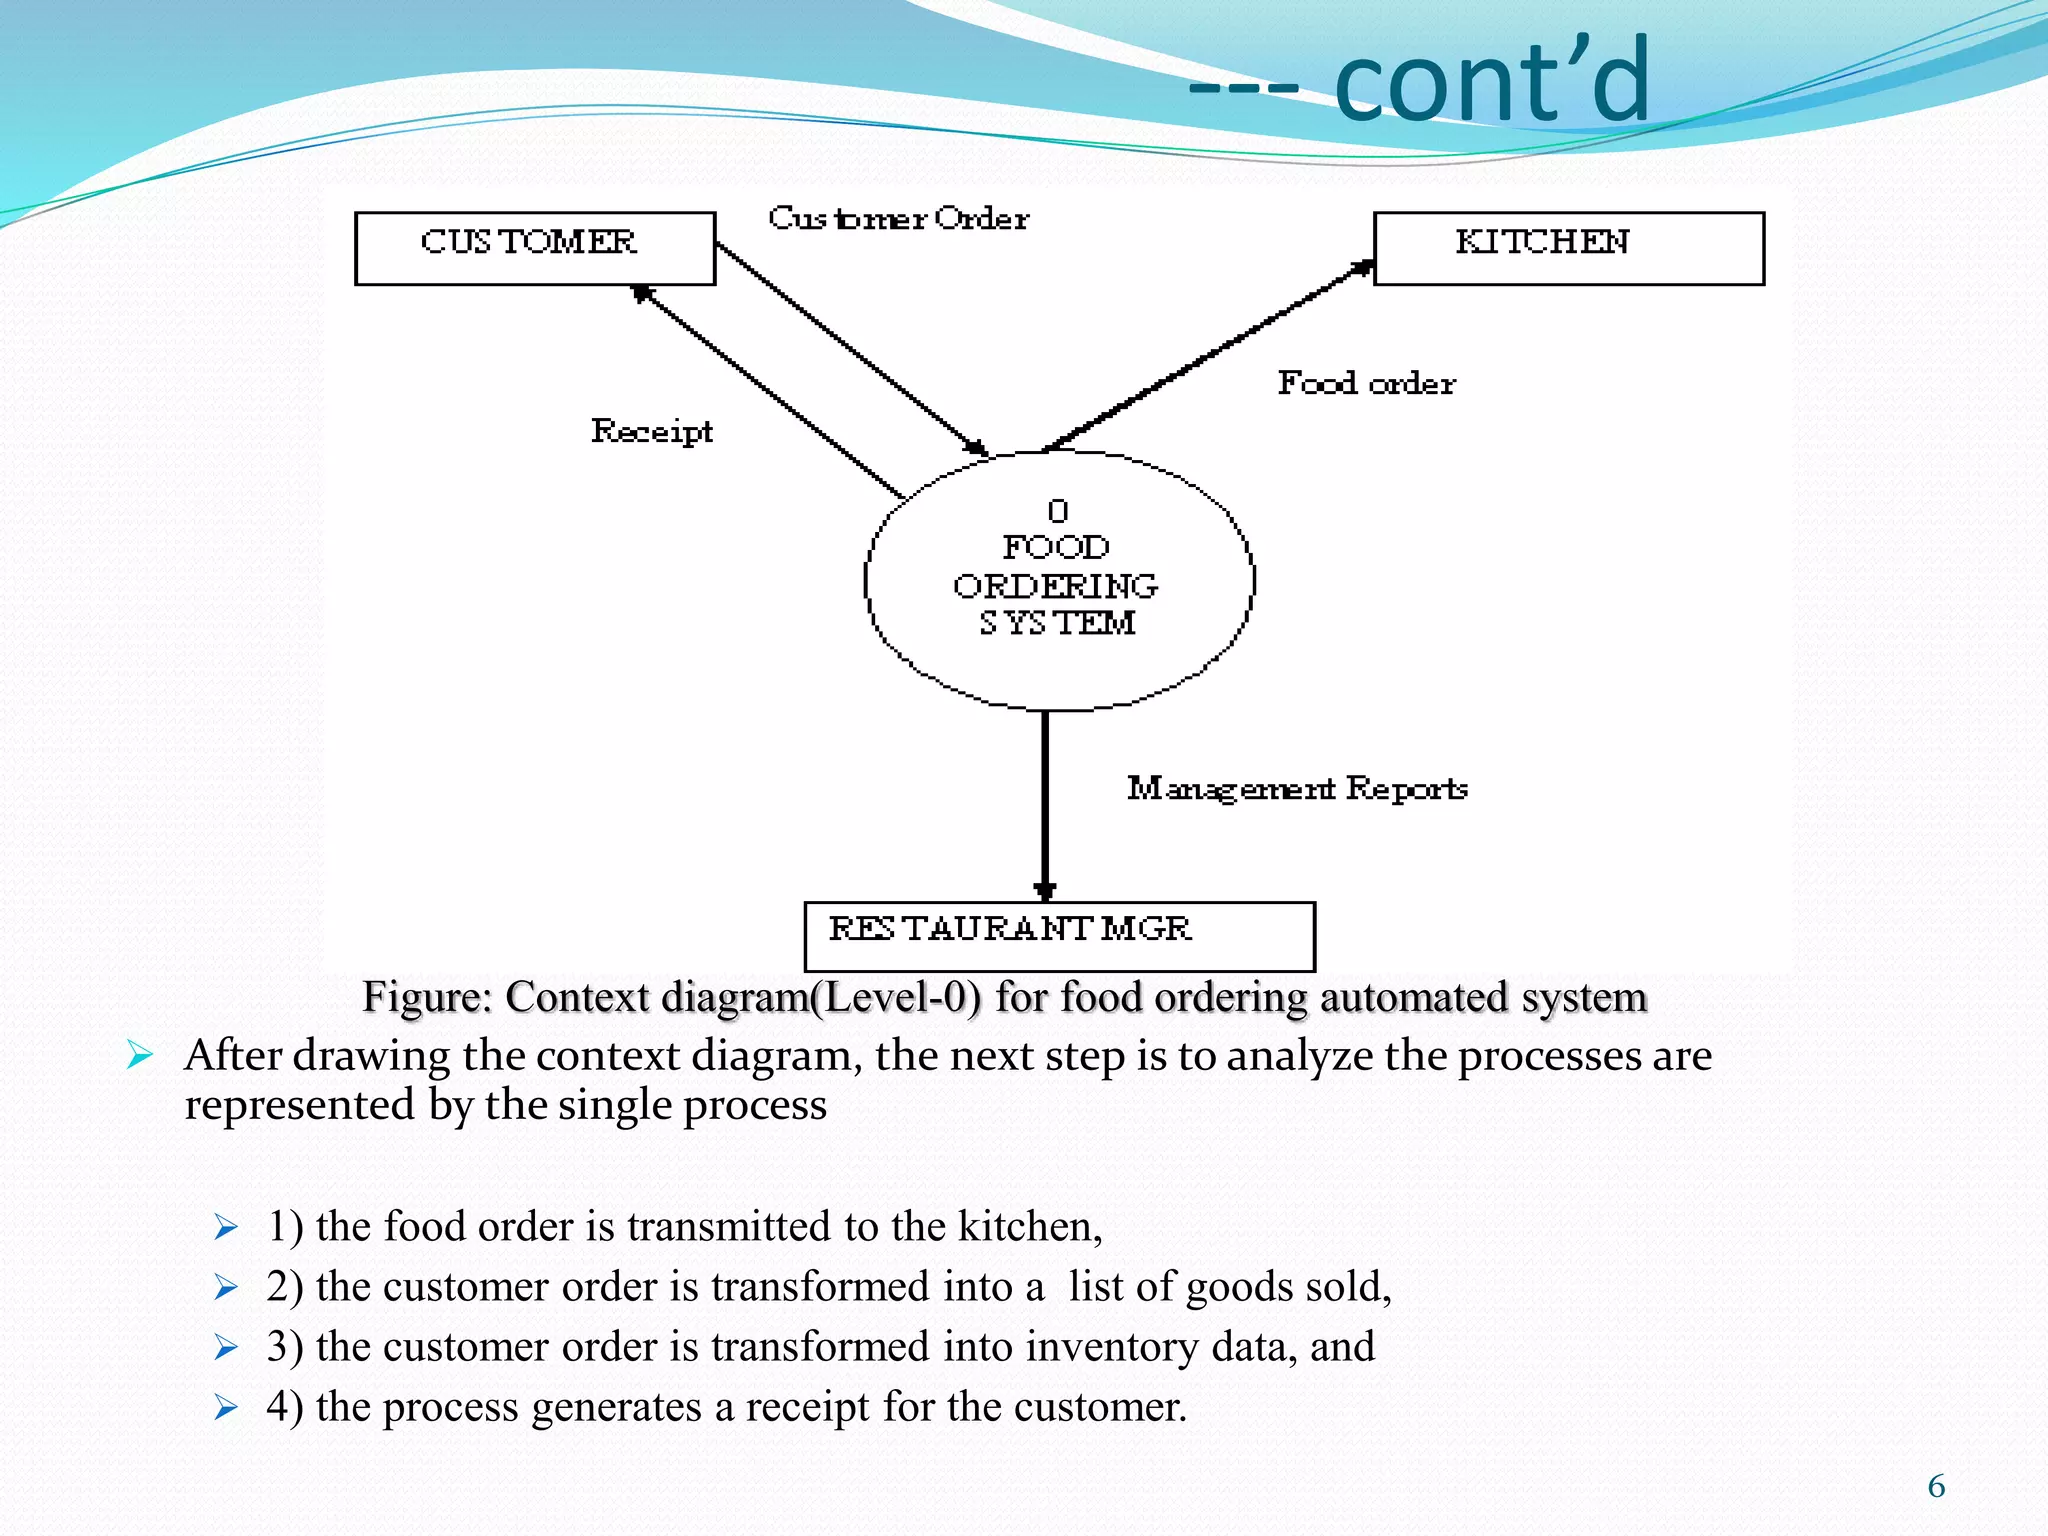
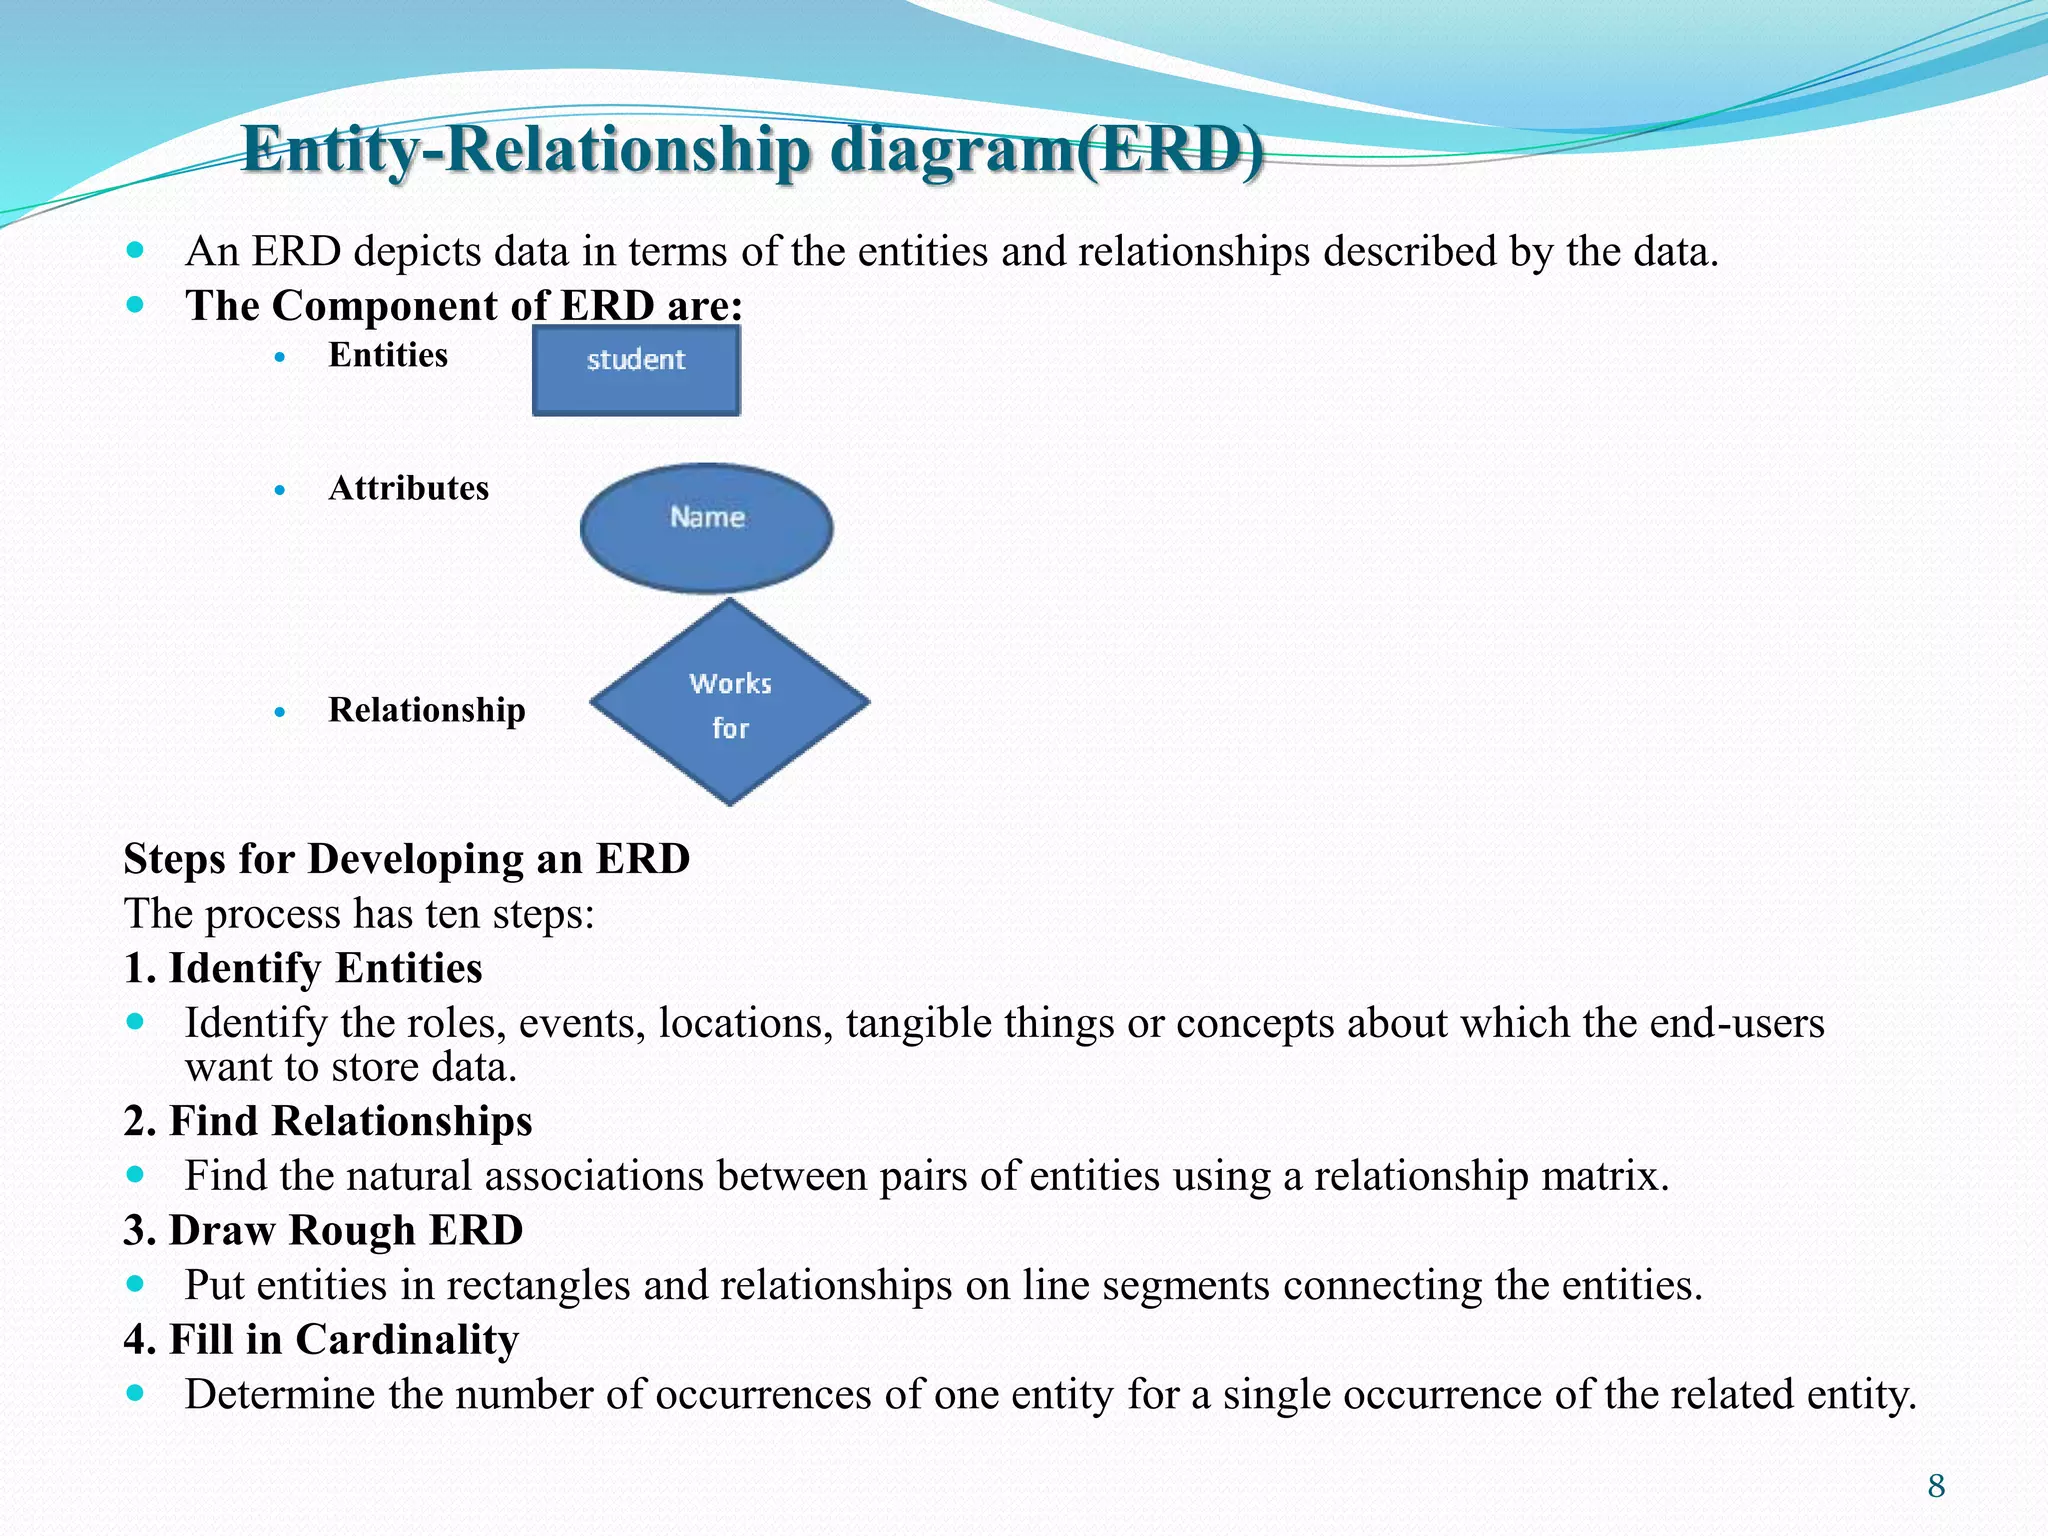
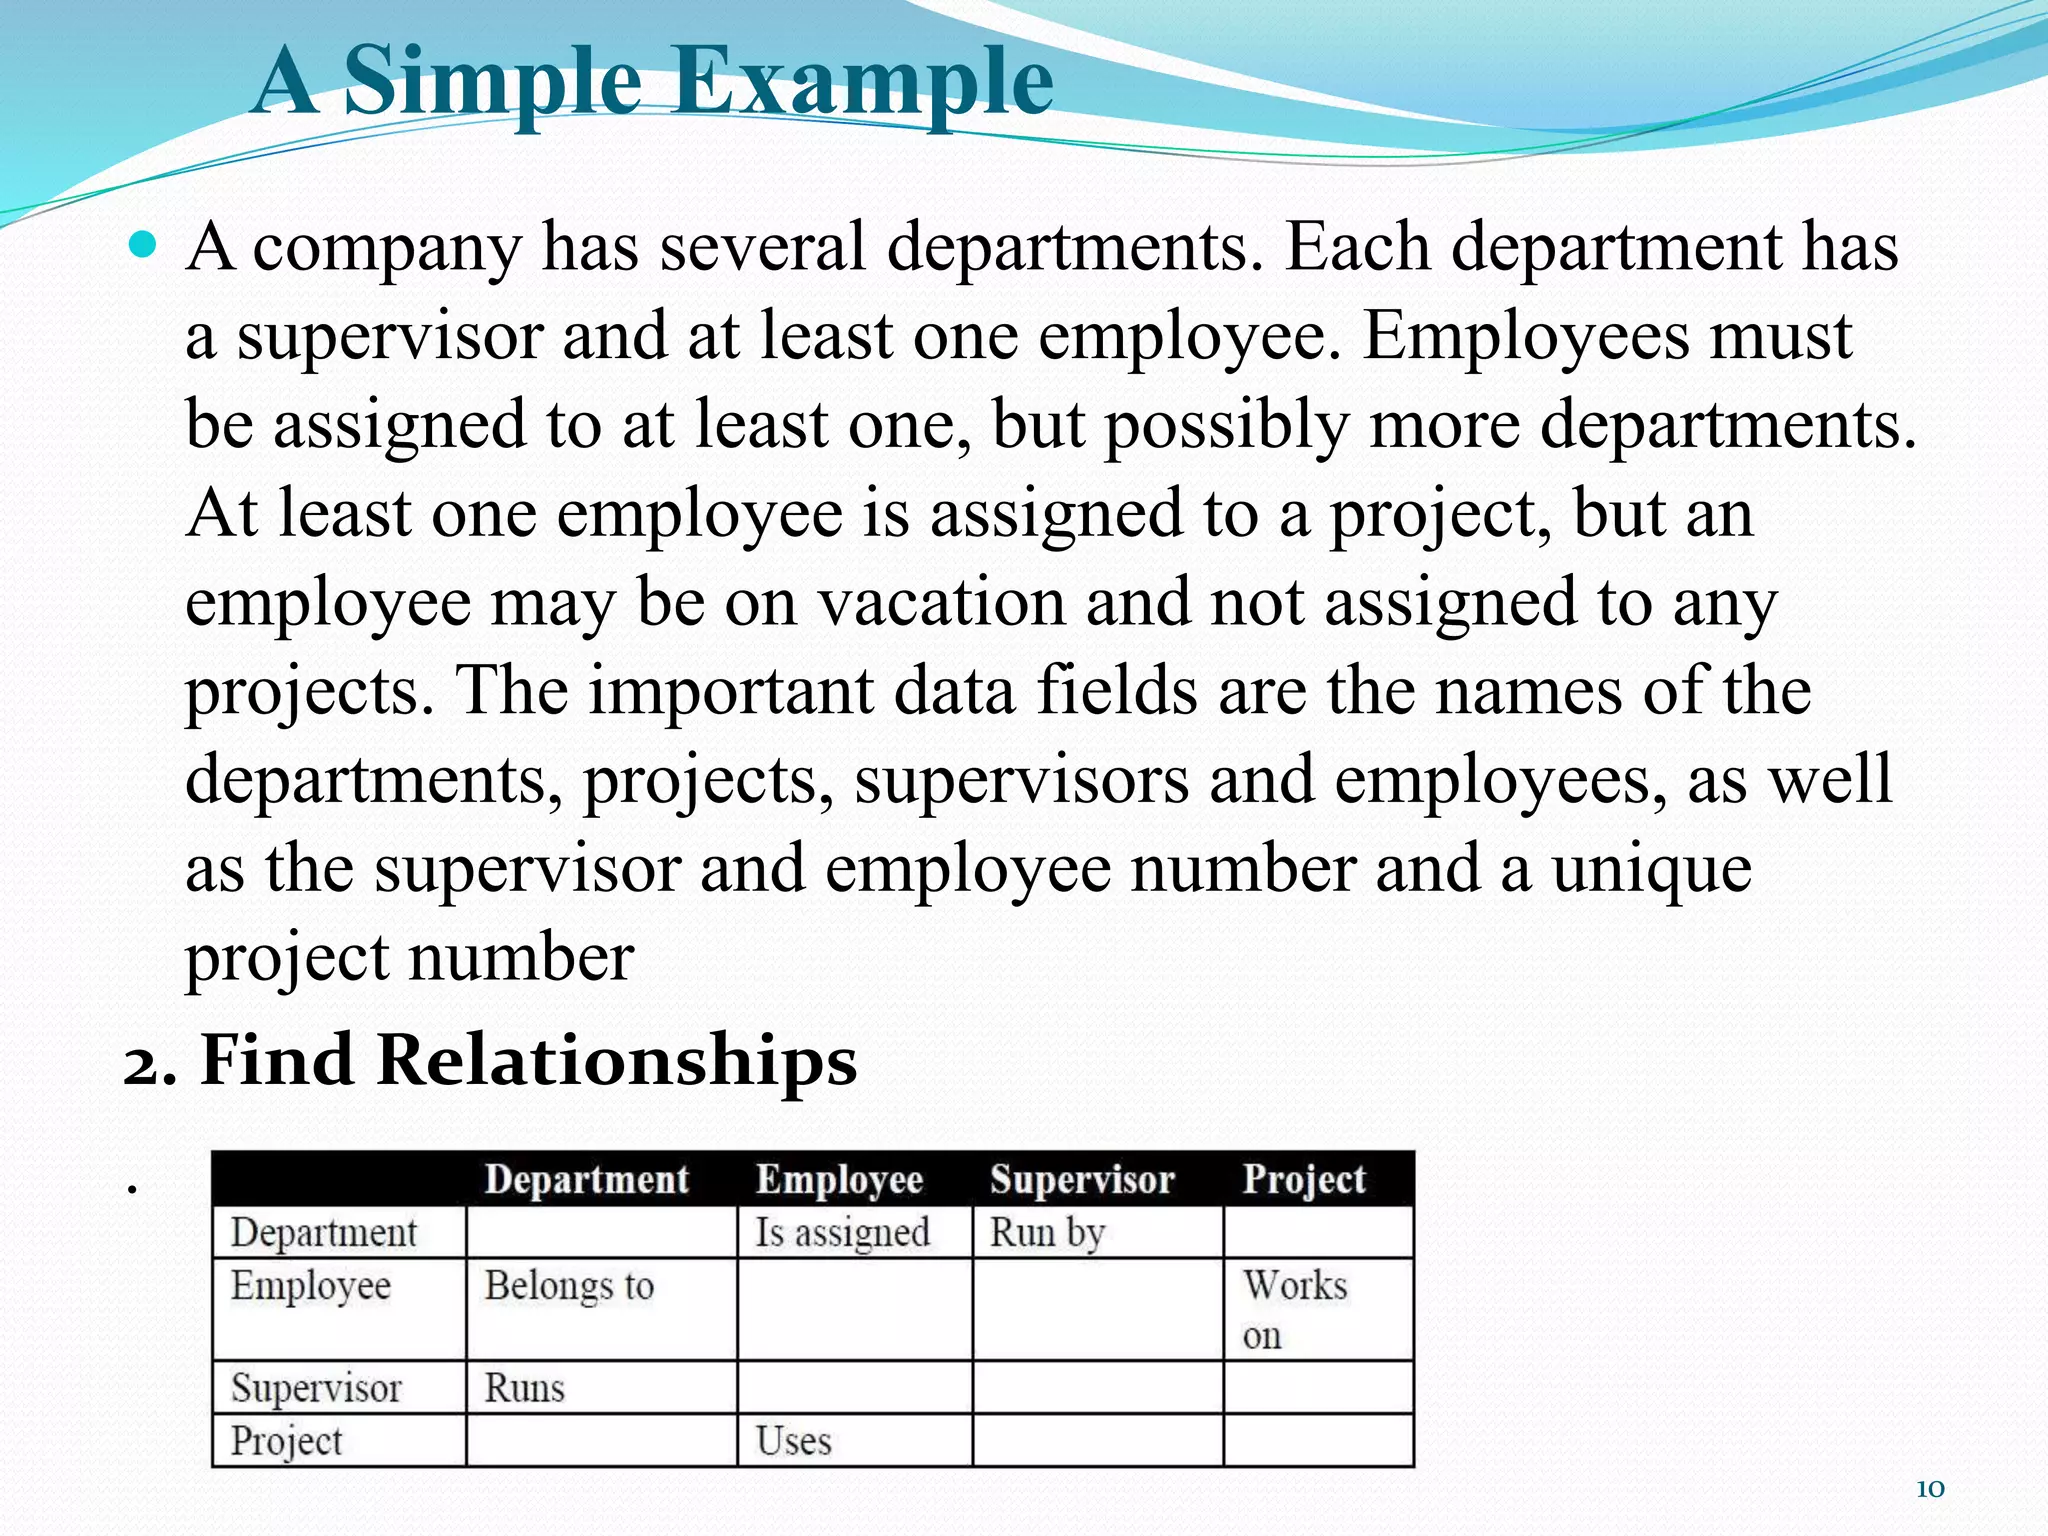
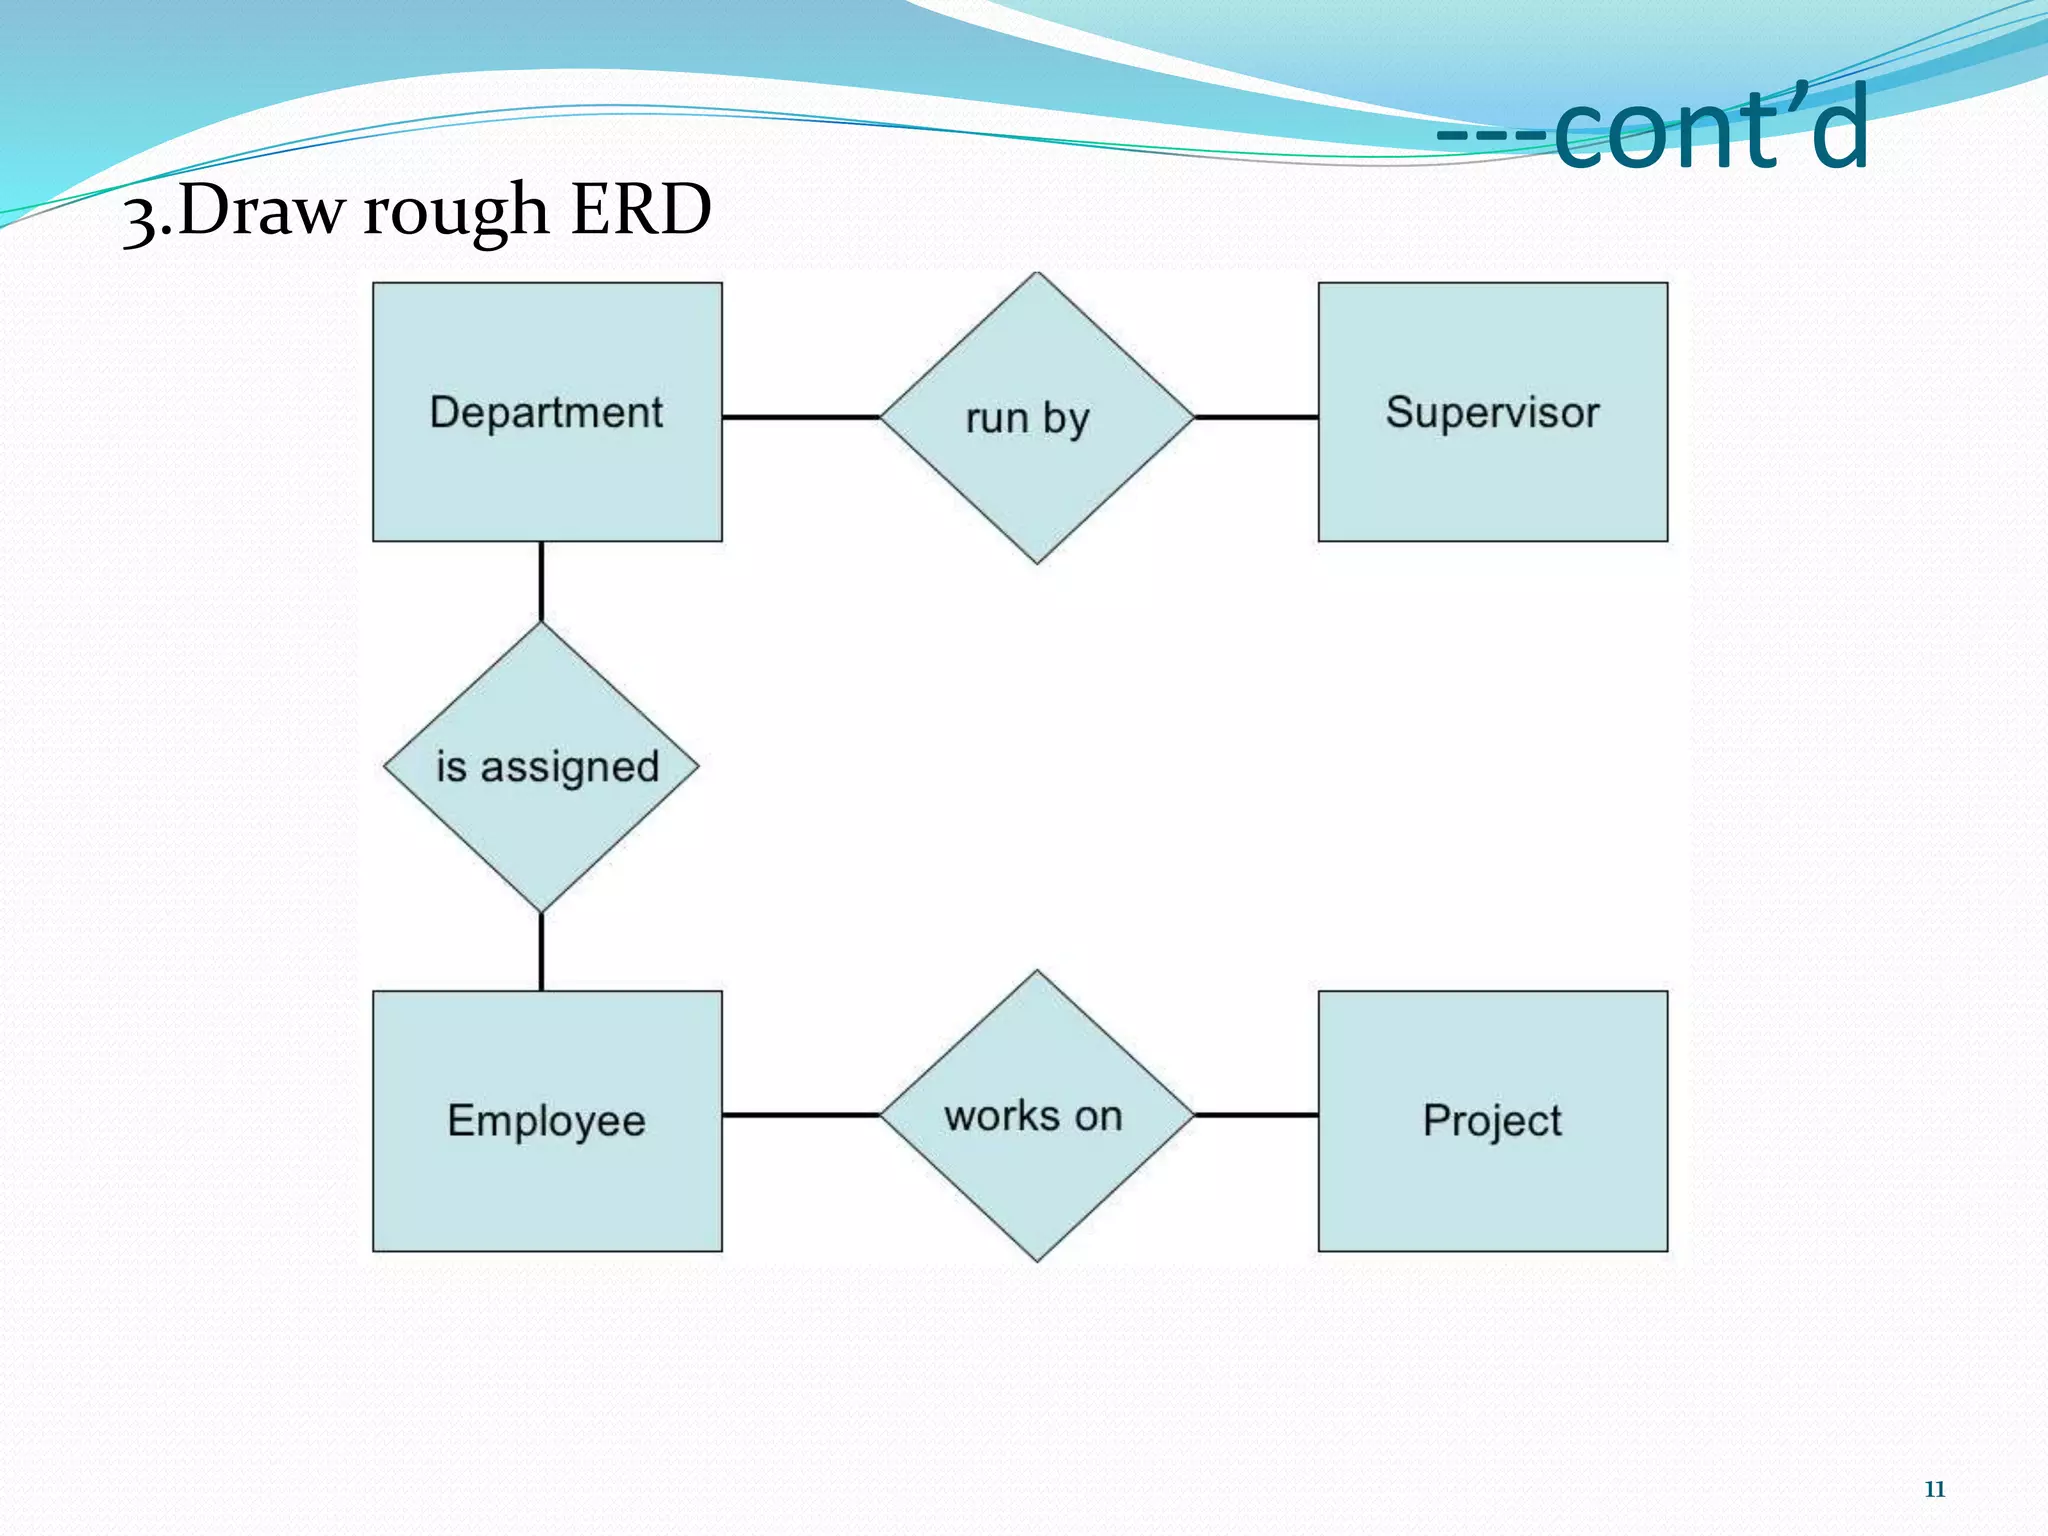
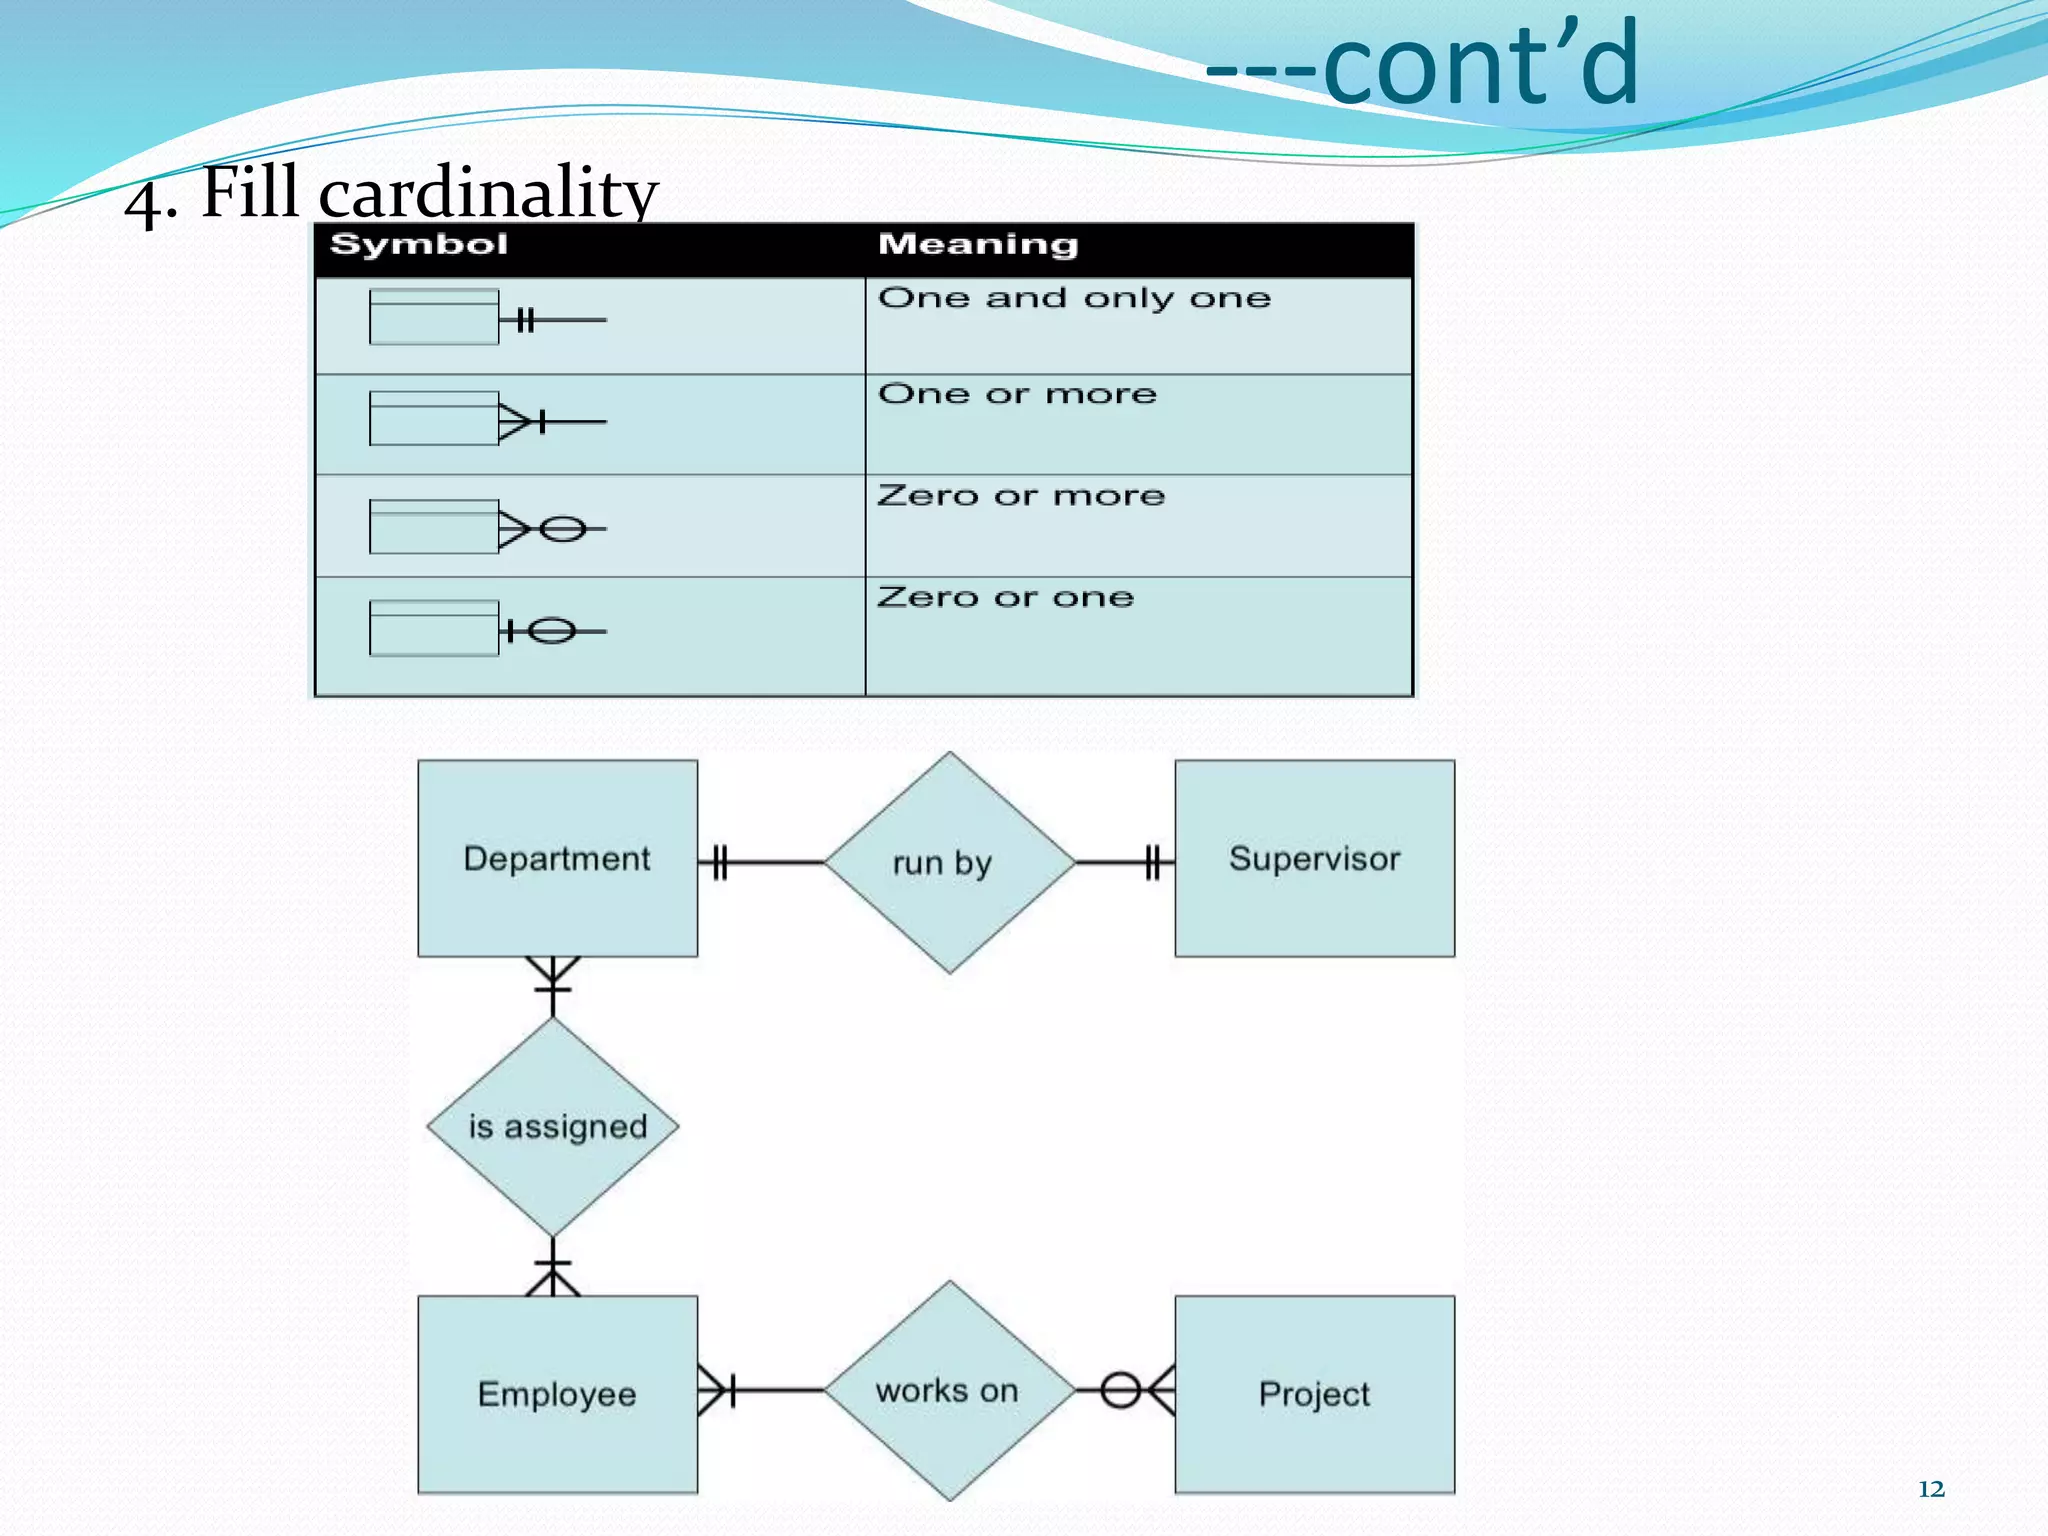
The document discusses key aspects of software requirement specification (SRS) documents and system modeling. It describes that an SRS document outlines the functional and non-functional requirements of the system as well as implementation goals. Functional requirements specify the system's functions while non-functional requirements describe characteristics like security and usability. System modeling involves process modeling using tools like data flow diagrams and conceptual data modeling using entity-relationship diagrams. The document provides examples and explanations of these modeling techniques.
This chapter will help you to demonstrate the working of the online blood bank system with the help of the diagrams, it includes DFD's ,architecture,block diagrams,ER-diagrams and state transition,table structure Etc.
Download Complete Material - https://www.instamojo.com/prashanth_ns/
This UML (Unified Markup Language) contains 6 Units and each Unit contains 35 slides in it.
Contents…
• Object-oriented modeling
• Origin and evolution of UML
• Architecture of UML
• User View
o Actor
o Use Cases
• Identify the behavior of a class
• Identify the attributes of a class
• Create a Class diagram
• Create an Object diagram
• Identify the dynamic and static aspects of a system
• Draw collaboration diagrams
• Draw sequence diagrams
• Draw statechart diagrams
• Understand activity diagrams
• Identify software components of a system
• Draw component diagrams
• Identify nodes in a system
• Draw deployment diagrams
How to Make a Field invisible in Odoo 17Celine George
It is possible to hide or invisible some fields in odoo. Commonly using “invisible” attribute in the field definition to invisible the fields. This slide will show how to make a field invisible in odoo 17.
How to Split Bills in the Odoo 17 POS ModuleCeline George
Bills have a main role in point of sale procedure. It will help to track sales, handling payments and giving receipts to customers. Bill splitting also has an important role in POS. For example, If some friends come together for dinner and if they want to divide the bill then it is possible by POS bill splitting. This slide will show how to split bills in odoo 17 POS.
Model Attribute Check Company Auto PropertyCeline George
In Odoo, the multi-company feature allows you to manage multiple companies within a single Odoo database instance. Each company can have its own configurations while still sharing common resources such as products, customers, and suppliers.
The French Revolution, which began in 1789, was a period of radical social and political upheaval in France. It marked the decline of absolute monarchies, the rise of secular and democratic republics, and the eventual rise of Napoleon Bonaparte. This revolutionary period is crucial in understanding the transition from feudalism to modernity in Europe.
For more information, visit-www.vavaclasses.com
2. Parts of a SRS document
The important parts of SRS document are:
Functional requirements of the system
Non-functional requirements of the system, and
Goals of implementation
The functional requirements part discusses the functionalities
required from the system.
The system is considered to perform a set of high-level
functions.
For documenting the functional requirements, we need to
specify the set of functionalities supported by the system.
Nonfunctional requirements deal with the characteristics of
the system which cannot be expressed as functions –
such as security, the maintainability of the system, portability
of the system, usability of the system, etc.
2
3. System modeling
A model captures aspects important for some application while
omitting (or abstracting) the rest.
A model in the context of software development can be graphical,
textual, mathematical, or program code-based.
Models are very useful in documenting the design and analysis
results.
There are two stages in the system modeling
1. Process modeling
2. Conceptual data modeling
Process modeling involves graphically representing the processes,
or actions that capture, manipulate, store and distribute data between
a system and its environment and among the components within a
system.
A common form of a process model is a data flow diagram (DFD).
Conceptual Data Modeling involves representing the data in a
system or organization, to show the overall structure of the data
Entity-Relationship diagram(ERD) data models are commonly
used diagrams that show how data is organized in a system.
3
4. Data Flow Diagram
Data flow diagram is a graphical representation of data
flow in an information system.
Component of DFD
1.External Entities - Entities are source and destination of
information data.
Symbol:
2. Process - Activities and action taken on the data are
represented by Circle
Symbol:
3.Data Store: A repository of information. In the
physical model, this represents a file, table.
Example: D1:Student data
4
customer
5. ---cont’d
4. Data flow: The directional movement of data to and from
external entities, the process and data stores.
Symbol: Registration data
The DFD for food ordering system - An example
A context diagram is a DFD that provides a general overview of a
system, other dfd’s can be used to focus the details of a context
diagram.
This context diagram contains only
one process,
no data stores,
four data flows, and three external entities.
The single process labeled “0”, represents the entire system.
N.B: All context diagrams have only one process labeled “0”.
No data stores appear on a context diagram, since the data stores
of the system are conceptually inside the one
5
6. --- cont’d
Figure: Context diagram(Level-0) for food ordering automated system
After drawing the context diagram, the next step is to analyze the processes are
represented by the single process
1) the food order is transmitted to the kitchen,
2) the customer order is transformed into a list of goods sold,
3) the customer order is transformed into inventory data, and
4) the process generates a receipt for the customer.
6
8. Entity-Relationship diagram(ERD)
An ERD depicts data in terms of the entities and relationships described by the data.
The Component of ERD are:
Entities
Attributes
Relationship
Steps for Developing an ERD
The process has ten steps:
1. Identify Entities
Identify the roles, events, locations, tangible things or concepts about which the end-users
want to store data.
2. Find Relationships
Find the natural associations between pairs of entities using a relationship matrix.
3. Draw Rough ERD
Put entities in rectangles and relationships on line segments connecting the entities.
4. Fill in Cardinality
Determine the number of occurrences of one entity for a single occurrence of the related entity.
8
9. ---cont’d
5. Define Primary Keys
Identify the data attribute(s) that uniquely identify one and only one
occurrence of each entity.
6. Draw Key-Based ERD
Eliminate Many-to-Many relationships and include primary and
foreign keys in each entity.
7. Identify Attributes
Name the information details (fields) which are essential to the
system under development.
8. Map Attributes
For each attribute, match it with exactly one entity that it describes.
9. Draw fully attributed ERD
Adjust the ERD from step 6 to account for entities or relationships
discovered in step 8.
10. Check Results
Does the final Entity Relationship Diagram accurately depict the
system data?
9
10. A Simple Example
A company has several departments. Each department has
a supervisor and at least one employee. Employees must
be assigned to at least one, but possibly more departments.
At least one employee is assigned to a project, but an
employee may be on vacation and not assigned to any
projects. The important data fields are the names of the
departments, projects, supervisors and employees, as well
as the supervisor and employee number and a unique
project number
2. Find Relationships
.
10
13. SOFTWARE DESIGN
Software design is a process to transform user requirements
into some suitable form, which helps the programmer in
software coding and implementation.
Software design is the first step in SDLC which moves the
concentration from problem domain to solution domain.
There are multiple variants of software design. Let us see the
two common types
1. Structured Design
Structured design is a conceptualization of problem into several
well-organized elements of solution.
Benefit of structured design is, it gives better understanding of
how the problem is being solved.
2.Object Oriented Design
Object oriented design works around the entities and their
characteristics instead of functions involved in the software
system.
This design strategy focuses on entities and its characteristics..
13
14. Concepts of Object Oriented Design
1. Object: a representation of a specific entity in the real world, it may
be tangible (physical entity) or intangible
Two aspects:
Information:
1) has a unique identity
2) has a description of its structure
Behaviour:
1) what can an object do?
2) what can be done to it?
2. Class: a definition or template that describes how to build an
accurate representation of a specific type of objects
Examples: agency, citizen, car, etc.
Objects are created using class definitions as templates.
3. Attribute: Attribute is a named property of a class describing a range of
values that instances of the class may hold for that property.
14
16. ---cont’d
4. Operation: Operation is the implementation of a service
that can be requested from any object of a given class.
5.Relations and Links:
Relationships:
between classes (relations)
between objects (links)
Three kinds of relations between classes:
1) association
2) aggregation
3) composition
18. Cont’d
Composition: stricter form of aggregation
lifespan of individual objects depend on the on lifespan of the
aggregate object
6. Generalization: is a process of organizing the features of different
kinds of objects that share the same purpose
equivalent to “kind-of” or “type-of” relationship
generalization enables inheritance
specialization is the opposite of generalization
19. ---cont’d
7.Super-Class :is a class that contains the features common to two
or more classes.
8. Sub-Class is a class that contains at least the features of its
super-class
20. What is UML?
UML stands for Unified Modeling Language.
This object-oriented system of notation has evolved from the
work of Grady Booch, James Rumbaugh, Ivar Jacobson, and
the Rational Software Corporation.
These renowned computer scientists fused their respective
technologies into a single, standardized model.
Today, UML is accepted by the Object Management Group
(OMG) as the standard for modeling object oriented programs.
Types of UML Diagrams
UML defines nine types of diagrams: class (package),
object, use case, sequence, collaboration, state-chart,
activity, component, and deployment diagrams.
20
21. 1.Use case diagram
use case diagrams, describes the functionality of the system from the user’s point of
view.
Use case diagrams components:
Use cases. A use case describes a sequence of actions that provide something of
measurable value to an actor and is drawn as a horizontal ellipse.
Actors. An actor is a person, organization, or external system that plays a role in one or
more interactions with your system. Actors are drawn as stick figures.
Relationships
Association:
Generalization: The child use case exhibits a more specific variation in behavior
than as specified for its parent
Include: Common behavior of more than one use case is referenced as a separate
instance to avoid repetition
Extend: Implicit integration of the behavior of another use case by declaring the
extension points / events in the base
System boundary boxes (optional). You can draw a rectangle around the use cases,
called the system boundary box, to indicate the scope of your system
22. ---cont’d
Steps to draw use case diagram
Identifying Actors
Identifying Use Cases
Writing use case scenarios(description)
To help find actors in your system, you should ask yourself
the following questions .
Identifying Actors: To help find actors in your system, you should ask
yourself the following questions
Who is the main customer of your system?
Who obtains information from this system?
Who provides information to the system?
Who installs the system?
Who operates the system?
Who shuts down the system?
23. Use case diagram example
Courseware System Descriptions
For this case study, the task is of constructing the design elements for a system
that can be used to manage courses and classes for an organization that
specializes in providing raining. The name of the system is Courseware System.
The organization offers courses in a variety of areas such as learning
management techniques and understanding different software languages and
technologies. Each course is made up of a set of topics. Tutors in the
organization are assigned courses to teach according to the area that they
specialize in and their availability. The organization publishes and maintains a
calendar of the different courses and the assigns tutors every year. There is a
group of course administrators in the organization who manage the courses
including course content, assigning courses to tutors, and defining the course
schedule. The training organization aims to use the Courseware System to get a
better control and visibility to the course management and to also streamline the
process of generating and managing schedules for different courses
24. ---cont’d
Actors: Tutor, Student, Course Administrator
(main actor)
Use Cases (primary business: secondary user)
Manage courses: View courses, Manage
topics for a course, and Manage course
information
Manage tutors: View course calendar, View
tutors, Manage tutor information, and
Assign courses to tutors
29. Use case description for register use case
Name: Register
Actor/s: CUSTOMER
Pre-condition: An unregistered CUSTOMER.
Main flow of events:
1. The CUSTOMER clicks the REGISTER button on the
Home Page.
2. The system displays the Register Page.
3. The CUSTOMER enters all of the required information.
4. The CUSTOMER clicks the SEND button.
5. The system checks that all of the required information was
entered. If Yes, the system updates the CUSTOMER’s record in
the CUSTOMER and ACCOUNT tables in the database.
System displays OK message.
ALT course of action:
30. 3.Sequence Diagram
UML sequence diagrams are typically used to: Validate and
flesh out the logic of a usage scenario.
A message is a communication between two objects, or within
an object, that is designed to result in some activity.
There are 5 kinds of actions that the UML explicitly supports: -
Call and Return
Create and Destroy
Send
34. 3.Class Diagram
Class diagrams are the backbone of almost every object-oriented method
including UML.
Class diagrams describe classes and their relationships
Basic Class Diagram Symbols and Notations
Classes: represent the types of data themselves
Associations: represent linkages between instances of classes
Attributes: are simple data found in classes and their instances
Operations: represent the functions performed by the classes and
their instances .
Visibility (+ (public), - (private), #(protected)
Multiplicity (Cardinality)
Composition and Aggregation
Composition is a special type of aggregation that denotes a strong
ownership between Class A, the whole, and Class B, its part
Generalization
is another name for inheritance or an "is a" relationship
35. -------
A simple technique for discovering domain classes
Look at a source material such as a description of requirements
Extract the nouns and noun phrases
Eliminate nouns that:
are redundant
represent instances
An association should exist if a class
possesses
controls
is connected to
is related to
is a part of
has as parts
is a member of, or
has as members
37. 4.State chart diagram
A state chart diagram shows the behavior of classes in response to external
stimuli.
This diagram models the dynamic flow of control from state to state within
a system.
States
States represent situations during the life of an object.
Transition
A solid arrow represents the path between different states of an
object.
Label the transition with the event that triggered it and the action that
results from it.
Initial State
A filled circle followed by an arrow represents the object's initial
state.
Final State
An arrow pointing to a filled circle nested inside another circle
represents the object's final state.
Synchronization and Splitting of Control
A short heavy bar with two transitions entering it represents a
synchronization of control.
A short heavy bar with two transitions leaving it represents a splitting
of control that creates multiple states.
39. 5.Activity Diagram
An activity diagram illustrates the dynamic
nature of a system by modeling the flow of
control from activity to activity.
An activity represents an operation on some class
in the system that results in a change in the state
of the system.
Typically, activity diagrams are used to model
workflow or business processes and internal
operation.
Because an activity diagram is a special kind of
state chart diagram, it uses some of the same
modeling conventions.
Action states
Action states represent the non-interruptible actions of
objects.
Action Flow
Action flow arrows illustrate the relationships among
action states.
40. -----
Initial State
A filled circle followed by an arrow represents
the initial action state.
Final State
An arrow pointing to a filled circle nested inside
another circle represents the final action state.
Branching
A diamond represents a decision with alternate
paths.
The outgoing alternates should be labeled with
a condition or guard expression. You can also
label one of the paths "else."
Synchronization
A synchronization bar helps illustrate parallel
transitions.
Synchronization is also called forking and
joining.
42. 6.Componet Diagram
A component diagram describes the organization of
the physical components in a system.
Component
A component is a physical building block of the system. It is
represented as a rectangle with tabs.
Interface
An interface describes a group of operations used or created
by components.
Dependencies
Draw dependencies among components using dashed
arrows.
44. 7.Deployment Diagram
Deployment diagrams depict the physical
resources in a system including nodes,
components, and connections.
Component
A node is a physical resource that executes code
components.
Association
Association refers to a physical connection between
nodes, such as Ethernet.
Components and Nodes
Place components inside the node that deploys them.