This document summarizes the history and status of software metrics in both academia and industry. It discusses that while academic research on software metrics has grown exponentially, industrial use of metrics has remained focused on simple counts like lines of code and defects. The document argues that traditional regression models used to relate metrics to quality are inadequate, and that capturing uncertainty and combining evidence is needed. It introduces Bayesian belief networks as an approach to building management tools using simple metrics while handling these issues.
Software Metrics for Identifying Software Size in Software Development ProjectsVishvi Vidanapathirana
This paper defines the best software metrics that can be used to define the size of the software in the current industry of information technology (IT)
FACTORS ON SOFTWARE EFFORT ESTIMATION ijseajournal
Software effort estimation is an important process of system development life cycle, as it may affect the
success of software projects if project designers estimate the projects inaccurately. In the past of few
decades, various effort prediction models have been proposed by academicians and practitioners.
Traditional estimation techniques include Lines of Codes (LOC), Function Point Analysis (FPA) method
and Mark II Function Points (Mark II FP) which have proven unsatisfactory for predicting effort of all
types of software. In this study, the author proposed a regression model to predict the effort required to
design small and medium scale application software. To develop such a model, the author used 60
completed software projects developed by a software company in Macau. From the projects, the author
extracted factors and applied them to a regression model. A prediction of software effort with accuracy of
MMRE = 8% was constructed.
International Journal of Engineering and Science Invention (IJESI) is an international journal intended for professionals and researchers in all fields of computer science and electronics. IJESI publishes research articles and reviews within the whole field Engineering Science and Technology, new teaching methods, assessment, validation and the impact of new technologies and it will continue to provide information on the latest trends and developments in this ever-expanding subject. The publications of papers are selected through double peer reviewed to ensure originality, relevance, and readability. The articles published in our journal can be accessed online.
A TAXONOMY FOR TOOLS, PROCESSES AND LANGUAGES IN AUTOMOTIVE SOFTWARE ENGINEERINGcsandit
Within the growing domain of software engineering in the automotive sector, the number of used tools, processes, methods and languages has increased distinctly in the past years. To be able to choose proper methods for particular development use cases, factors like the intended
use, key-features and possible limitations have to be evaluated. This requires a taxonomy that
aids the decision making. An analysis of the main existing taxonomies revealed two major deficiencies: the lack of the automotive focus and the limitation to particular engineering
method types. To face this, a graphical taxonomy is proposed based on two well-established engineering approaches and enriched with additional classification information. It provides a
self-evident and -explanatory overview and comparison technique for engineering methods in the automotive domain. The taxonomy is applied to common automotive engineering methods.The resulting diagram classifies each method and enables the reader to select appropriate solutions for given project requirements
Using DEMATEL Method to Analyze the Causal Relations on Technological Innovat...drboon
This study analyzes the technology innovation capabilities (TICs) evaluation factors of enterprises by applying the Decision Making Trial and Evaluation Laboratory (DEMATEL) method. Based on the literature reviews, six main perspectives and sixteen criteria were extracted and then validated by six experts. A questionnaire was constructed and answered by eleven experts. Then the DEMATEL method was applied to analyze the importance of criteria and the casual relations among the criteria were constructed. The result showed that the innovation management capability perspective was the most important perspective and influenced the remaining perspectives. This work also presents the significant criteria for each perspective.
The Impact of Software Complexity on Cost and Quality - A Comparative Analysi...ijseajournal
Early prediction of software quality is important for better software planning and controlling. In early
development phases, design complexity metrics are considered as useful indicators of software testing
effort and some quality attributes. Although many studies investigate the relationship between design
complexity and cost and quality, it is unclear what we have learned beyond the scope of individual studies.
This paper presented a systematic review on the influence of software complexity metrics on quality
attributes. We aggregated Spearman correlation coefficients from 59 different data sets from 57 primary
studies by a tailored meta-analysis approach. We found that fault proneness and maintainability are most
frequently investigated attributes. Chidamber & Kemerer metric suite is most frequently used but not all of
them are good quality attribute indicators. Moreover, the impact of these metrics is not different in
proprietary and open source projects. The result provides some implications for building quality model
across project type.
Software quality assurance (sqa) Parte II- Métricas del Software y Modelos d...Renato Gonzalez
• Complejidad del software y sus métricas
• Métricas cognitivas
• Métricas Funcionales
• Métricas de Proceso del Software
• Métricas de Complejidad Técnica del Producto
• Métricas de Calidad del software
• Atributos y Modelos de Calidad del Software
This is one of the estimation methodologies called 'MVC points' that was created to estimate J2EE and .Net applications. I have uploaded a .ppt file for the same also and this is a full paper.
MAKE THE QUALITY OF SOFTWARE PRODUCT IN THE VIEW OF POOR PRACTICES BY USING S...Journal For Research
In the Software Engineering, One of the most important factors to impact national and international business is quality of software and its assurance. Integral part of software development cycle is SQA, evaluation of software Quality product when compared to other industrial projects and it is very highly difficult. For developing, performance, speed, maintaining the quality, cost and efficiency of the software, SQA activities, principles and its methods are implemented in the early stages of the software engineering development phases. Where in this paper there is little visibility of lack of software Quality product in the view of poor practices. Hence we proposed a new system with best practices in software quality management to make the best quality product. This System works on Gain Better Visibility into Supplier Quality with Technology.
Abstract: In current scenario the automation plays important role in any type of industries for the purpose of quick production. For changing over form manual mode to auto mode there are many problems which affect the project of automation. There are two types of problems one is from technical side i.e. testing of software and another is from management side i.e. managing the manpower, material management, communication management within the organization and out of the organization which affects the progress of the project. To the authors knowledge this is the first time to observe the factors which are affecting the progress of the project and to perform the study on them. Result of this study support that which are the factors that affect the progress of the project and how to tackle them in a better way so that they will not affect the project.
APPLYING REQUIREMENT BASED COMPLEXITY FOR THE ESTIMATION OF SOFTWARE DEVELOPM...cscpconf
The need of computing the software complexity in requirement analysis phase of software
development life cycle (SDLC) would be an enormous benefit for estimating the required
development and testing effort for yet to be developed software. Also, a relationship between
source code and difficulty in developing a source code are also attempted in order to estimate the
complexity of the proposed software for cost estimation, man power build up, code and
developer’s evaluation. Therefore, this paper presents a systematic and an integrated approach
for the estimation of software development and testing effort on the basis of improved
requirement based complexity (IRBC) of the proposed software. The IRBC measure serves as the
basis for estimation of these software development activities to enable the developers and
practitioners to predict the critical information about the software development intricacies and
obtained from software requirement specification (SRS) of proposed software. Hence, this paper
presents an integrated approach, for the prediction of software development and testing effort
using IRBC. For validation purpose, the proposed measures are categorically compared with
various established and prevalent practices proposed in the past. Finally, the results obtained, validates the claim, for the approaches discussed in this paper, for estimation of software development and testing effort, in the early phases of SDLC appears to be robust, comprehensive, early alarming and compares well with other measures proposed in the past.
Software Defect Trend Forecasting In Open Source Projects using A Univariate ...CSCJournals
Our objective in this research is to provide a framework that will allow project managers, business owners, and developers an effective way to forecast the trend in software defects within a software project in real-time. By providing these stakeholders with a mechanism for forecasting defects, they can then provide the necessary resources at the right time in order to remove these defects before they become too much ultimately leading to software failure. In our research, we will not only show general trends in several open-source projects but also show trends in daily, monthly, and yearly activity. Our research shows that we can use this forecasting method up to 6 months out with only an MSE of 0.019. In this paper, we present our technique and methodologies for developing the inputs for the proposed model and the results of testing on seven open source projects. Further, we discuss the prediction models, the performance, and the implementation using the FBProphet framework and the ARIMA model.
Modern Software Productivity Measurement: The Pragmatic GuideCAST
The guide explains why software productivity measurement is crucial for productivity and quality improvement programs, as well as presents best practices for collecting, analyzing, and using productivity data. Recommendations are also included to implement an effective productivity improvement program.
SCHEDULING AND INSPECTION PLANNING IN SOFTWARE DEVELOPMENT PROJECTS USING MUL...ijseajournal
This paper presents a Multi-objective Hyper-heuristic Evolutionary Algorithm (MHypEA) for the solution
of Scheduling and Inspection Planning in Software Development Projects. Scheduling and Inspection
planning is a vital problem in software engineering whose main objective is to schedule the persons to
various activities in the software development process such as coding, inspection, testing and rework in
such a way that the quality of the software product is maximum and at the same time the project make span
and cost of the project are minimum. The problem becomes challenging when the size of the project is
huge. The MHypEA is an effective metaheuristic search technique for suggesting scheduling and inspection
planning. It incorporates twelve low-level heuristics which are based on different methods of selection,
crossover and mutation operations of Evolutionary Algorithms. The selection mechanism to select a lowlevel
heuristic is based on reinforcement learning with adaptive weights. The efficacy of the algorithm has
been studied on randomly generated test problem.
Measure, Metrics, Indicators, Metrics of Process Improvement, Statistical Software Process Improvement, Metrics of Project Management, Metrics of the Software Product, 12 Steps to Useful Software Metrics
Review on cost estimation technque for web application [part 1]Sayed Mohsin Reza
Prepared by Sayed Mohsin Reza
Part 1
Source Book: Cost Estimation Techniques for Web Projects
BOOK AUTHOR: EMILIA MENDES UNIVERSITY OF AUCKLAND, NEW ZEALAND
Difference about Web and Software Projects
Introduction to Web Cost Estimation
Accuracy of an Effort Model?
Sizing Web Applications
Presentation describes about process planning procedures & software project management methods employed in Infosys with reference from Textbook "Software Project management in practice by Pankaj Jalote"
Efficient Indicators to Evaluate the Status of Software Development Effort Es...IJMIT JOURNAL
Development effort is an undeniable part of the project management which considerably influences the
success of project. Inaccurate and unreliable estimation of effort can easily lead to the failure of project.
Due to the special specifications, accurate estimation of effort in the software projects is a vital
management activity that must be carefully done to avoid from the unforeseen results. However numerous
effort estimation methods have been proposed in this field, the accuracy of estimates is not satisfying and
the attempts continue to improve the performance of estimation methods. Prior researches conducted in
this area have focused on numerical and quantitative approaches and there are a few research works that
investigate the root problems and issues behind the inaccurate effort estimation of software development
effort. In this paper, a framework is proposed to evaluate and investigate the situation of an organization in
terms of effort estimation. The proposed framework includes various indicators which cover the critical
issues in field of software development effort estimation. Since the capabilities and shortages of
organizations for effort estimation are not the same, the proposed indicators can lead to have a systematic
approach in which the strengths and weaknesses of organizations in field of effort estimation are
discovered
THE UNIFIED APPROACH FOR ORGANIZATIONAL NETWORK VULNERABILITY ASSESSMENTijseajournal
The present business network infrastructure is quickly varying with latest servers, services, connections,
and ports added often, at times day by day, and with a uncontrollably inflow of laptops, storage media and
wireless networks. With the increasing amount of vulnerabilities and exploits coupled with the recurrent
evolution of IT infrastructure, organizations at present require more numerous vulnerability assessments.
In this paper new approach the Unified process for Network vulnerability Assessments hereafter called as
a unified NVA is proposed for network vulnerability assessment derived from Unified Software
Development Process or Unified Process, it is a popular iterative and incremental software development
process framework.
The peer-reviewed International Journal of Engineering Inventions (IJEI) is started with a mission to encourage contribution to research in Science and Technology. Encourage and motivate researchers in challenging areas of Sciences and Technology.
One of the core quality assurance feature which combines fault prevention and fault detection, is often known as testability approach also. There are many assessment techniques and quantification method evolved for software testability prediction which actually identifies testability weakness or factors to further help reduce test effort. This paper examines all those measurement techniques that are being proposed for software testability assessment at various phases of object oriented software development life cycle. The aim is to find the best metrics suit for software quality improvisation through software testability support. The ultimate objective is to establish the ground work for finding ways reduce the testing effort by improvising software testability and its assessment using well planned guidelines for object-oriented software development with the help of suitable metrics.
ITERATIVE AND INCREMENTAL DEVELOPMENT ANALYSIS STUDY OF VOCATIONAL CAREER INF...ijseajournal
Software development process presents various types of models with their corresponding phases required to be accordingly followed in delivery of quality products and projects. Despite the various expertise and skills of systems analysts, designers, and programmers, systems failure is inevitable when a suitable development process model is not followed. This paper focuses on the Iterative and Incremental Development (IID)model and justified its role in the analysis and design software systems. The paper adopted the qualitative research approach that justified and harnessed the relevance of IID in the context of systems analysis and design using the Vocational
Career Information System (VCIS) as a case study. The paper viewed the IID as a change-driven software development process model. The results showed some system specification, functional specification of system and design specifications that can be used in implementing the VCIS using the IID model. Thus, the paper concluded that in systems analysis and design, it is imperative to consider a suitable development process that reflects the engineering mind-set, with heavy emphasis on good analysis and design for quality assurance.
Running head M7A1 - PROJECT MANAGEMENT PLAN1M7A1 - PROJECT.docxjoellemurphey
Running head: M7A1 - PROJECT MANAGEMENT PLAN
1
M7A1 - PROJECT MANAGEMENT PLAN
2
M7A1 - Project Management Plan
[Student Name]
IT 390
Professor Charles Snead
[Current Date]
Project Management Plan
Project Name: [name of project]
Project Description: [one paragraph description of the project]
Business Justification: [one paragraph describing the business need for the project]
Project Manager and Key Stakeholders
Name
Role
Position
Contact Information
Required Deliverables:
· [the deliverables, in bullet form]
Key Definitions and Acronyms
· [project-specific definitions of terms and acronyms, in bullet form]
Project Staffing:
· [staffing requirements for the team]
Organizational Charts
· [org chart of stakeholders and team members]
Project Responsibilities:
· [responsibilities of key stakeholders, in bullet form]
Management Objectives:
· [management objectives, in bullet form]
Project Controls:
· [controls used to manage scope and change, in bullet form]
Top 3 Risk Assessment:
· [See page 459 of the textbook] Scope Management Section
Key Deliverables:
· [deliverables and expected dates, in bullet form]
Work Packages:
· [work packages from WBS needed to produce the deliverables, in bullet form]
Quality Baseline
· [you will need metrics that are measurable. For example, stating that something must be faster is not measurable; stating that something must be 10% faster than the current process is.]Project Schedule Section
Summary schedule:
· [high level schedule of milestones and key deliverables, in bullet form]
Budget
Summary Budget:
Cost Estimate for Dave's Bar & Grill POS System
# Units/Hrs.
Cost/Unit/Hr
Subtotals
WBS Level 2 Totals
% of Total
1. Project Management Costs
[project manager]
[development team]
[other stakeholders]
2. Hardware
3. Software
4. Testing (10% of total hardware and software costs)
5. Training and Support
6. Reserves (20% of total estimate)
Total project cost estimate
Choose a topic from ‘http://behaviouralfinance.net/’.
A. Write a 6 to 8 page paper on the subject.
B. Construct a 10-minute presentation and present your topic to the class.
C. All assignments are due on the last day of the course.
Outline of a ‘research project’:
Section 1: Theory
In section 1 of your document, you should examine where, when, and by who your particular research topic was conceived and what it ‘looked’ like at that time. Your research should include the seminal work that laid the foundation for your topic.
Section 2: Present
In section 2 of your document, you should examine how the theoretical base of your topic has evolved over time. The objective here is to bring your topic to the present and engage in research related to recent articles published on this topic.
Section 3: Application
In section 3 of your document, you should find some way to ...
A TAXONOMY FOR TOOLS, PROCESSES AND LANGUAGES IN AUTOMOTIVE SOFTWARE ENGINEERINGcscpconf
Within the growing domain of software engineering in the automotive sector, the number of used tools, processes, methods and languages has increased distinctly in the past years. To be able to choose proper methods for particular development use cases, factors like the intended use, key-features and possible limitations have to be evaluated. This requires a taxonomy that aids the decision making. An analysis of the main existing taxonomies revealed two major deficiencies: the lack of the automotive focus and the limitation to particular engineering method types. To face this, a graphical taxonomy is proposed based on two well-established engineering approaches and enriched with additional classification information. It provides a self-evident and -explanatory overview and comparison technique for engineering methods in the automotive domain. The taxonomy is applied to common automotive engineering methods. The resulting diagram classifies each method and enables the reader to select appropriate solutions for given project requirements.
Ludmila Orlova HOW USE OF AGILE METHODOLOGY IN SOFTWARE DEVELO.docxsmile790243
Ludmila Orlova
HOW USE OF AGILE METHODOLOGY IN SOFTWARE DEVELOPMENT INFLUENCE AGILITY OF THE BUSINESS
Agile methodology is widely distributed tool for software development. Presented article explore research data about use of these tools, its influence to quality of the end product and performance of development and overall agility of business and companies.
KEYWORDS:
Agile, software development, agile business
CONTENT
1 INTRODUCTION
2 AGILE SOFTWARE DEVELOPMENT
3 SCALING AGILE
4 AGILE BUSINESS
5 CONCLUSION
REFERENCES
1 INTRODUCTION
Fast pace of science progress in solid state electronics led to incredible progress of computer devices that on its turn demanded software to control and manage the power of computer calculations and usage.
Software engineering emerged in the beginning of 20th century and by the end of it became separate state of art science, activity and the profession for millions. There are about 18.2 million software developers worldwide, a number that is due to rise to 26.4 million by 2019, a 45% increase, says Evans Data Corp. in its latest Global Developer Population and Demographic Study (P. Thibodeau, 2013). Along with growing number of software developers (software development firms, projects and people involved), increased the need for effective management of software development process. This demanded new approach and methodology from business researchers and managers. In the last several decades there was huge number of research, both in IT field and business management dedicated to this area.
Popularity of agile software development methods started about decade ago and at present these methods are employed by many big, medium size and small companies. Still growing attention to agile methods from software development specialists confirm these methods filled the lack of management techniques for software development that emerged and developed extremely fast along with speedy advancement of hardware in IT area. Great number of research done in areas such as changes in performance of software development using agile methods or scaling agile for large companies and teams. Also one of modern trends is an attempt to apply agile methodology for project management, marketing, sales and other activities. Goal of this article is to explore influence of application agile methods in software development to agility of whole company and business. Presented work based on secondary data taken from a multiple sources, the work performed as an exploratory study and a review of existing research in the area.
2 AGILE SOFTWARE DEVELOPMENT
Definition of an adjective agile in English is: able to move quickly and easily or able to think and understand quickly (Oxford Dictionary, 2015). The most often contemporary use presented by the following sentence: Relating to or denoting a method of project management, used especially for software development, that is characterized by the division of tasks into ...
Recent DEA Applications to Industry: A Literature Review From 2010 To 2014inventionjournals
International Journal of Engineering and Science Invention (IJESI) is an international journal intended for professionals and researchers in all fields of computer science and electronics. IJESI publishes research articles and reviews within the whole field Engineering Science and Technology, new teaching methods, assessment, validation and the impact of new technologies and it will continue to provide information on the latest trends and developments in this ever-expanding subject. The publications of papers are selected through double peer reviewed to ensure originality, relevance, and readability. The articles published in our journal can be accessed online.
A software system continues to grow in size and complexity, it becomes increasing difficult to
understand and manage. Software metrics are units of software measurement. As improvement in coding tools
allow software developer to produce larger amount of software to meet ever expanding requirements. A method
to measure software product, process and project must be used. In this article, we first introduce the software
metrics including the definition of metrics and the history of this field. We aim at a comprehensive survey of the
metrics available for measuring attributes related to software entities. Some classical metrics such as Lines of
codes LOC, Halstead complexity metric (HCM), Function Point analysis and others are discussed and
analyzed. Then we bring up the complexity metrics methods, such as McCabe complexity metrics and object
oriented metrics(C&K method), with real world examples. The comparison and relationship of these metrics are
also presented.
Contributors to Reduce Maintainability Cost at the Software Implementation PhaseWaqas Tariq
Software maintenance is important and difficult to measure. The cost of maintenance is the most ever during the phases of software development. One of the most critical processes in software development is the reduction of software maintainability cost based on the quality of source code during design step, however, a lack of quality models and measures can help asses the quality attributes of software maintainability process. Software maintainability suffers from a number of challenges such as lack source code understanding, quality of software code, and adherence to programming standards in maintenance. This work describes model based-factors to assess the software maintenance, explains the steps followed to obtain and validate them. Such a method can be used to eliminate the software maintenance cost. The research results will enhance the quality of the source code. It will increase software understandability, eliminate maintenance time, cost, and give confidence for software reusability.
STRATEGIES TO REDUCE REWORK IN SOFTWARE DEVELOPMENT ON AN ORGANISATION IN MAU...ijseajournal
Rework is a known vicious circle in software development since it plays a central role in the generation of
delays, extra costs and diverse risks introduced after software delivery. It eventually triggers a negative
impact on the quality of the software developed. In order to cater the rework issue, this paper goes in depth
with the notion of rework in software development as it occurs in practice by analysing a development
process on an organisation in Mauritius where rework is a major issue. Meticulous strategies to reduce
rework are then analysed and discussed. The paper ultimately leads to the recommendation of the best
strategy that is software configuration management to reduce the rework problem in software development
Integrated Analysis of Traditional Requirements Engineering Process with Agil...zillesubhan
In the past few years, agile software development approach has emerged as a most attractive software development approach. A typical CASE environment consists of a number of CASE tools operating on a common hardware and software platform and note that there are a number of different classes of users of a CASE environment. In fact, some users such as software developers and managers wish to make use of CASE tools to support them in developing application systems and monitoring the progress of a project. This development approach has quickly caught the attention of a large number of software development firms. However, this approach particularly pays attention to development side of software development project while neglects critical aspects of requirements engineering process. In fact, there is no standard requirement engineering process in this approach and requirements engineering activities vary from situation to situation. As a result, there emerge a large number of problems which can lead the software development projects to failure. One of major drawbacks of agile approach is that it is suitable for small size projects with limited team size. Hence, it cannot be adopted for large size projects. We claim that this approach can be used for large size projects if traditional requirements engineering approach is combined with agile manifesto. In fact, the combination of traditional requirements engineering process and agile manifesto can also help resolve a large number of problems exist in agile development methodologies. As in software development the most important thing is to know the clear customer’s requirements and also through modeling (data modeling, functional modeling, behavior modeling). Using UML we are able to build efficient system starting from scratch towards the desired goal. Through UML we start from abstract model and develop the required system through going in details with different UML diagrams. Each UML diagram serves different goal towards implementing a whole project.
Similar to Software metrics sucess, failures and new directions (20)
Essentials of Automations: The Art of Triggers and Actions in FMESafe Software
In this second installment of our Essentials of Automations webinar series, we’ll explore the landscape of triggers and actions, guiding you through the nuances of authoring and adapting workspaces for seamless automations. Gain an understanding of the full spectrum of triggers and actions available in FME, empowering you to enhance your workspaces for efficient automation.
We’ll kick things off by showcasing the most commonly used event-based triggers, introducing you to various automation workflows like manual triggers, schedules, directory watchers, and more. Plus, see how these elements play out in real scenarios.
Whether you’re tweaking your current setup or building from the ground up, this session will arm you with the tools and insights needed to transform your FME usage into a powerhouse of productivity. Join us to discover effective strategies that simplify complex processes, enhancing your productivity and transforming your data management practices with FME. Let’s turn complexity into clarity and make your workspaces work wonders!
SAP Sapphire 2024 - ASUG301 building better apps with SAP Fiori.pdfPeter Spielvogel
Building better applications for business users with SAP Fiori.
• What is SAP Fiori and why it matters to you
• How a better user experience drives measurable business benefits
• How to get started with SAP Fiori today
• How SAP Fiori elements accelerates application development
• How SAP Build Code includes SAP Fiori tools and other generative artificial intelligence capabilities
• How SAP Fiori paves the way for using AI in SAP apps
GraphRAG is All You need? LLM & Knowledge GraphGuy Korland
Guy Korland, CEO and Co-founder of FalkorDB, will review two articles on the integration of language models with knowledge graphs.
1. Unifying Large Language Models and Knowledge Graphs: A Roadmap.
https://arxiv.org/abs/2306.08302
2. Microsoft Research's GraphRAG paper and a review paper on various uses of knowledge graphs:
https://www.microsoft.com/en-us/research/blog/graphrag-unlocking-llm-discovery-on-narrative-private-data/
The Metaverse and AI: how can decision-makers harness the Metaverse for their...Jen Stirrup
The Metaverse is popularized in science fiction, and now it is becoming closer to being a part of our daily lives through the use of social media and shopping companies. How can businesses survive in a world where Artificial Intelligence is becoming the present as well as the future of technology, and how does the Metaverse fit into business strategy when futurist ideas are developing into reality at accelerated rates? How do we do this when our data isn't up to scratch? How can we move towards success with our data so we are set up for the Metaverse when it arrives?
How can you help your company evolve, adapt, and succeed using Artificial Intelligence and the Metaverse to stay ahead of the competition? What are the potential issues, complications, and benefits that these technologies could bring to us and our organizations? In this session, Jen Stirrup will explain how to start thinking about these technologies as an organisation.
Enhancing Performance with Globus and the Science DMZGlobus
ESnet has led the way in helping national facilities—and many other institutions in the research community—configure Science DMZs and troubleshoot network issues to maximize data transfer performance. In this talk we will present a summary of approaches and tips for getting the most out of your network infrastructure using Globus Connect Server.
GDG Cloud Southlake #33: Boule & Rebala: Effective AppSec in SDLC using Deplo...James Anderson
Effective Application Security in Software Delivery lifecycle using Deployment Firewall and DBOM
The modern software delivery process (or the CI/CD process) includes many tools, distributed teams, open-source code, and cloud platforms. Constant focus on speed to release software to market, along with the traditional slow and manual security checks has caused gaps in continuous security as an important piece in the software supply chain. Today organizations feel more susceptible to external and internal cyber threats due to the vast attack surface in their applications supply chain and the lack of end-to-end governance and risk management.
The software team must secure its software delivery process to avoid vulnerability and security breaches. This needs to be achieved with existing tool chains and without extensive rework of the delivery processes. This talk will present strategies and techniques for providing visibility into the true risk of the existing vulnerabilities, preventing the introduction of security issues in the software, resolving vulnerabilities in production environments quickly, and capturing the deployment bill of materials (DBOM).
Speakers:
Bob Boule
Robert Boule is a technology enthusiast with PASSION for technology and making things work along with a knack for helping others understand how things work. He comes with around 20 years of solution engineering experience in application security, software continuous delivery, and SaaS platforms. He is known for his dynamic presentations in CI/CD and application security integrated in software delivery lifecycle.
Gopinath Rebala
Gopinath Rebala is the CTO of OpsMx, where he has overall responsibility for the machine learning and data processing architectures for Secure Software Delivery. Gopi also has a strong connection with our customers, leading design and architecture for strategic implementations. Gopi is a frequent speaker and well-known leader in continuous delivery and integrating security into software delivery.
Encryption in Microsoft 365 - ExpertsLive Netherlands 2024Albert Hoitingh
In this session I delve into the encryption technology used in Microsoft 365 and Microsoft Purview. Including the concepts of Customer Key and Double Key Encryption.
Securing your Kubernetes cluster_ a step-by-step guide to success !KatiaHIMEUR1
Today, after several years of existence, an extremely active community and an ultra-dynamic ecosystem, Kubernetes has established itself as the de facto standard in container orchestration. Thanks to a wide range of managed services, it has never been so easy to set up a ready-to-use Kubernetes cluster.
However, this ease of use means that the subject of security in Kubernetes is often left for later, or even neglected. This exposes companies to significant risks.
In this talk, I'll show you step-by-step how to secure your Kubernetes cluster for greater peace of mind and reliability.
Pushing the limits of ePRTC: 100ns holdover for 100 daysAdtran
At WSTS 2024, Alon Stern explored the topic of parametric holdover and explained how recent research findings can be implemented in real-world PNT networks to achieve 100 nanoseconds of accuracy for up to 100 days.
Transcript: Selling digital books in 2024: Insights from industry leaders - T...BookNet Canada
The publishing industry has been selling digital audiobooks and ebooks for over a decade and has found its groove. What’s changed? What has stayed the same? Where do we go from here? Join a group of leading sales peers from across the industry for a conversation about the lessons learned since the popularization of digital books, best practices, digital book supply chain management, and more.
Link to video recording: https://bnctechforum.ca/sessions/selling-digital-books-in-2024-insights-from-industry-leaders/
Presented by BookNet Canada on May 28, 2024, with support from the Department of Canadian Heritage.
PHP Frameworks: I want to break free (IPC Berlin 2024)Ralf Eggert
In this presentation, we examine the challenges and limitations of relying too heavily on PHP frameworks in web development. We discuss the history of PHP and its frameworks to understand how this dependence has evolved. The focus will be on providing concrete tips and strategies to reduce reliance on these frameworks, based on real-world examples and practical considerations. The goal is to equip developers with the skills and knowledge to create more flexible and future-proof web applications. We'll explore the importance of maintaining autonomy in a rapidly changing tech landscape and how to make informed decisions in PHP development.
This talk is aimed at encouraging a more independent approach to using PHP frameworks, moving towards a more flexible and future-proof approach to PHP development.
Smart TV Buyer Insights Survey 2024 by 91mobiles.pdf91mobiles
91mobiles recently conducted a Smart TV Buyer Insights Survey in which we asked over 3,000 respondents about the TV they own, aspects they look at on a new TV, and their TV buying preferences.
Software metrics sucess, failures and new directions
1. 1
Software Metrics:
Successes, Failures and New Directions
Norman E Fenton
Centre for Software Reliability Agena Ltd
City University 11 Main Street
Northampton Square Caldecote
London EC1V OHB Cambridge CB3 7NU
United Kingdom United Kingdom
Tel: 44 171 477 8425 Tel 44 1223 263753 / 44 181 530 5981
Fax: 44 171 477 8585 Fax: 01223 263899
n.fenton@csr.city.ac.uk norman@agena.co.uk
www.csr.city.ac.uk/people/norman.fenton/ www.agena.co.uk
Abstract
The history of software metrics is almost as old as the history of software engineering. Yet, the extensive
research and literature on the subject has had little impact on industrial practice. This is worrying given that
the major rationale for using metrics is to improve the software engineering decision making process from a
managerial and technical perspective. Industrial metrics activity is invariably based around metrics that have
been around for nearly 30 years (notably Lines of Code or similar size counts, and defects counts). While such
metrics can be considered as massively successful given their popularity, their limitations are well known, and
mis-applications are still common. The major problem is in using such metrics in isolation. We argue that it is
possible to provide genuinely improved management decision support systems based on such simplistic
metrics, but only by adopting a less isolationist approach. Specifically, we feel it is important to explicitly
model: a) cause and effect relationships and b) uncertainty and combination of evidence. Our approach uses
Bayesian Belief nets which are increasingly seen as the best means of handling decision-making under
uncertainty. The approach is already having an impact in Europe.
1. Introduction
‘Software metrics’ is the rather misleading collective term used to describe the wide range of activities
concerned with measurement in software engineering. These activities range from producing numbers that
characterise properties of software code (these are the classic software ‘metrics’) through to models that help
predict software resource requirements and software quality. The subject also includes the quantitative aspects
of quality control and assurance - and this covers activities like recording and monitoring defects during
development and testing. Although there are assumed to be many generic benefits of software metrics (see for
example the books [DeMarco 1982, Gilb 1987, Fenton and Pfleeger 1996, Jones 1991]), it is fair to say that
the most significant is to provide information to support managerial decision making during software
development and testing. With this focus we provide here a dispassionate assessment of the impact of
software metrics (both industrially and academically) and the direction we feel the subject might now usefully
take.
We begin our assessment of the status of software metrics with a necessary look at its history in Section 2. It
is only in this context that we can really judge its successes and failures. These are described in Section 3. If
we judge the entire software metrics subject area by the extent to which the level of metrics activity has
increased in industry then it has been a great success. However, the increased industrial activity is not related
to the increased academic and research activity. The ‘metrics’ being practised are essentially the same basic
metrics that were around in the late 1960’s. In other words these are metrics based around LOC (or very
similar) size counts, defect counts, and crude effort figures (in person months). Industrialists have accepted
the simple metrics and rejected the esoteric because they are easy to understand and relatively simple to
collect. Our objective is to use primarily these simple metrics to build management decision support tools that
combine different aspects of software development and testing and enable managers to make many kinds of
predictions, assessments and trade-offs during the software life-cycle. Most of all our objective is to handle
2. 2
the key factors largely missing from the usual metrics models: uncertainty and combining different (often
subjective) evidence. In Section 4 we explain why traditional (largely regression-based) models are
inadequate for this purpose. In Section 5 we explain how the exciting technology of Bayesian nets (which is
hidden to users) helps us meet our objective.
2. History of software metrics as a subject area
To assess the current status of software metrics, and its successes and failures, we need to consider first its
history. Although the first dedicated book on software metrics was not published until 1976 [Gilb 1976], the
history of active software metrics dates back to the late-1960’s. Then the Lines of Code measure (LOC or
KLOC for thousands of lines of code) was used routinely as the basis for measuring both programmer
productivity (LOC per programmer month) and program quality (defects per KLOC). In other words LOC
was being used as a surrogate measure of different notions of program size. The early resource prediction
models (such as those of [Putnam 1978] and [Boehm 1981]) also used LOC or related metrics like delivered
source instructions as the key size variable. In 1971 Akiyama [Akiyama 1971] published what we believe was
the first attempt to use metrics for software quality prediction when he proposed a crude regression-based
model for module defect density (number of defects per KLOC) in terms of the module size measured in
KLOC. In other words he was using KLOC as a surrogate measure for program complexity.
The obvious drawbacks of using such a crude measure as LOC as a surrogate measure for such different
notions of program size such as effort, functionality, and complexity, were recognised in the mid-1970’s. The
need for more discriminating measures became especially urgent with the increasing diversity of
programming languages. After all, a LOC in an assembly language is not comparable in effort, functionality,
or complexity to a LOC in a high-level language. Thus, the decade starting from the mid-1970’s saw an
explosion of interest in measures of software complexity (pioneered by the likes of [Halstead 1977] and
[McCabe 1976]) and measures of size (such as function points pioneered by [Albrecht 1979] and later by
[Symons 1991]) which were intended to be independent of programming language.
Work on extending, validating and refining complexity metrics (including applying them to new paradigms
such as object oriented languages [Chidamber and Kemerer 1994]) has been a dominant feature of academic
metrics research up to the present day [Fenton 1991, Zuse 1991].
In addition to work on specific metrics and models, much recent work has focused on meta-level activities,
the most notable of which are:
• Work on the mechanics of implementing metrics programs. Two pieces of work stand out in this respect:
1. The work of [Grady and Caswell 1987] ( later extended in [Grady 1992]) which was the first and
most extensive experience report of a company-wide software metrics program. This work contains key
guidelines (and lessons learned) which influenced (and inspired) many subsequent metrics programs.
2. The work of Basili, Rombach and colleagues on GQM(Goal-Question Metric) [Basili and Rmbach
1988]. By borrowing some simple ideas from the Total Quality Management field, Basili and his
colleagues proposed a simple scheme for ensuring that metrics activities were always goal-driven. A
metrics program established without clear and specific goals and objectives is almost certainly doomed
to fail [Hall and Fenton 1997]). Basili’s high profile in the community and outstanding
communications and technology transfer skills ensured that this important message was subsequently
widely accepted and applied. That does not mean it is without its criticisms ([Bache and Neil 1995]
and [Hetzel 1993] argue that the inherent top-down approach ignores what is feasible to measure at the
bottom). However, most metrics programs at least pay lip service to GQM with the result that such
programs should in principle be collecting only those metrics which are relevant to the specific goals.
• the use of metrics in empirical software engineering: specifically we refer to empirical work concerned
with evaluating the effectiveness of specific software engineering methods, tools and technologies. This is
a great challenge for the academic/research software metrics community. There is now widespread
awareness that we can no longer rely purely on the anecdotal claims of self-appointed experts about which
new methods really work and how. Increasingly we are seeing measurement studies that quantify the
effectiveness of methods and tools. Basili and his colleagues have again pioneered this work (see, for
3. 3
example [Basili and Reiter 1981, Basili et al 1986]. Success here is judged by acceptance of empirical
results, and the ability to repeat experiments to independently validate results.
• work on theoretical underpinnings of software metrics This work (exemplified by [Briand et al 1996,
Fenton 1991, Zuse 1991] is concerned with improving the level of rigour in the discipline as a whole. For
example, there has been considerable work in establishing a measurement theory basis for software
metrics activities. The most important success from this work has been the acceptance of the need to
consider scale types when defining measures with restrictions on the metrics analyses techniques that are
relevant for the given scale type.
3. Successes and failures
First the good news about software metrics and its related activities:
• It has been a phenomenal success if we judge it by the number of books, journal articles, academic
research projects, and dedicated conferences. The number of published metrics papers grows at an
exponential rate (CSR maintains a database of such papers which currently numbers over 1600). There are
now at least 40 books on software metrics, which is as many as there on the general topic of software
engineering. Most computing/software engineering courses world-wide now include some compulsory
material on software metrics. In other words the subject area has now been accepted as part of the
mainstream of software engineering.
• There has been a significant increase in the level of software metrics activity actually taking place in
industry. Most major IT companies, and even many minor ones, have in place software metrics
‘programs’, even if they are not widely recognised as such. This was not happening 10 years ago.
Now for the bad news:
• There is no match in content between the increased level of metrics activity in academia and industry.
Like many other core subjects within the software engineering mainstream (such as formal development
methods, object-oriented design, and even structured analysis), the industrial take-up of most academic
software metrics work has been woeful. Much of the increased metrics activity in industry is based almost
entirely on metrics that were around in the early 1970s.
• Much academic metrics research is inherently irrelevant to industrial needs. Irrelevance here is at two
levels.
1. irrelevance in scope: much academic work has focused on metrics which can only ever be
applied/computed for small programs, whereas all the reasonable objectives for applying metrics are
relevant primarily for large systems. Irrelevance in scope also applies to the many academic models
which rely on parameters which could never be measured in practice.
2. irrelevance in content: whereas the pressing industrial need is for metrics that are relevant for
process improvement, much academic work has concentrated on detailed code metrics. In many
cases these aim to measure properties that are of little practical interest. This kind of irrelevance
prompted Glass to comment:
“What theory is doing with respect to measurement of software work and what practice is doing are on
two different planes, planes that are shifting in different directions” [Glass 1994]
• Much industrial metrics activity is poorly motivated. For all the warm feelings associated with the
objectives for software metrics (improved assessment and prediction, quality control and assurance etc.) it
is not at all obvious that metrics are inevitably a ‘good thing’. The decision by a company to put in place
some kind of a metrics program is inevitably a ‘grudge purchase’; it is something done when things are
bad or to satisfy some external assessment body. For example, in the US the single biggest trigger for
industrial metrics activity has been the CMM [Humphreys 1989]; evidence of use of metrics is intrinsic
for achieving higher levels of CMM. Just as there is little empirical evidence about the effectiveness of
specific software development methods [Fenton et al 1994] so there is equally little known about the
effectiveness of software metrics. Convincing success stories describing the long-term payback of metrics
are almost non-existent. What we do know is that metrics will always be an overhead on your current
software projects (we found typically it would be 4-8% [Hall and Fenton 1997]) . When deadlines are tight
4. 4
and slipping it is inevitable that the metrics activity will be one of the first things to suffer (or be stopped
completely). Metrics are, above all, effective primarily as a management tool. Yet good metrics data is
possible only with the commitment of technical staff involved in development and testing. There are no
easy ways to motivate such staff in this respect.
• Much industrial metrics activity is poorly executed: We have come across numerous examples of
industrial practice which ignores well known guidelines of best practice data-collection and analysis and
applies metrics in ways that were known to be invalid twenty years ago. For example, it is still common
for companies to collect defect data which does not distinguish between defects discovered in operation
and defects discovered during development [Fenton and Neil 1998].
The raison d’être of software metrics is to improve the way we monitor, control or predict various attributes of
software and the commercial software production process. Therefore, a necessary criterion to judge the
success of software metrics is the extent to which they are being routinely used across a wide cross section of
the software production industry. Using this criterion, and based solely on our own consulting experience and
the published literature, the only metrics to qualify as candidates for successes are:
• The enduring LOC metric: despite the many convincing arguments about why this metric is a very poor
‘size’ measure [Fenton and Pfleeger 1996] it is still routinely used in its original applications: as a
normalising measure for software quality (defects per KLOC); as a means of assessing productivity (LOC
per programmer month) and as a means of providing crude cost/effort estimates. Like it or not LOC has
been a ‘success’ because it is easy to compute and can be ‘visualised’ in the sense that we understand what
a 100 LOC program looks like.
• Metrics relating to defect counts: (see [Gilb and Graham 1994] and [Fenton and Pfleeger 1996] for
extensive examples). Almost all industrial metrics programs incorporate some attempt to collect data on
software defects discovered during development and testing. In many cases, such programs are not
recognised explicitly as ‘metrics programs’ since they may be regarded simply as applying good
engineering practice and configuration management.
• McCabe’s cyclomatic number [McCabe 1976]. For all the many criticisms that it has attracted this
remains exceptionally popular. It is easily computed by static analysis (unlike most of the more
discriminating complexity metrics) and it is widely used for quality control purposes. For example, [Grady
1992] reports that, at Hewlett Packard, any modules with a cyclomatic complexity higher than 16 must be
re-designed.
To a less extent we should also include:
• Function Points [Albrecht 1979, Symons 1991]: Function point analysis is very hard to do properly
[Jeffery and Stathis 1996] and is unnecessarily complex if used for resource estimation [Kitchenham
1995]. Yet, despite these drawbacks function points appear to have been widely accepted as a standard
sizing measure, especially within the financial IT sector [Onvlee 1995].
This is not an impressive list, and in Section 4 we will explain why the credibility of metrics as a whole has
been lowered because of the crude way in which these kinds of metrics have been used. However, as we will
show in Section 5, it is the models and applications which have been fundamentally flawed rather than the
metrics.
4. What you can and cannot do with the basic metrics
In this section we will look at recent empirical work which explains the limitations of the basic measures and
explains in particular problems with the so-called complexity metrics. We restrict our attention to the use of
metrics for quality control, assessment and prediction. Specifically, in what follows we will examine what you
can and cannot do with defect metrics and size and complexity metrics. We assume that readers already
acknowledge the need to distinguish between:
• defects which are discovered at different life-cycle phases. Most notably defects discovered in operation
(we call these failures) must always be distinguished from defects discovered during development (which
we refer to as faults since they may lead to failures in operation).
• different categories of defects (including defects with different levels of criticality)
5. 5
Ultimately one of the major objectives of software metrics research has been to produce metrics which are
good ‘early’ predictors of reliability (the frequency of operational defects). It is known that stochastic
reliability growth models can produce accurate predictions of the reliability of a software system providing
that a reasonable amount of failure data can be collected for that system in representative operational use
[Brocklehurst and Littlewood 1992]. Unfortunately, this is of little help in those many circumstances when we
need to make predictions before the software is operational. In [Fenton and Neil 1998] we reviewed the many
studies advocating statistical models and metrics to address this problem. Our opinion of this work is not high
- we found that many methodological and theoretical mistakes have been made. Studies suffered from a
variety of flaws ranging from model mis-specification to use of inappropriate data. We concluded that the
existing models are incapable of predicting defects accurately using size and complexity metrics alone.
Furthermore, these models offer no coherent explanation of how defect introduction and detection variables
affect defect counts.
In [Fenton and Ohlsson 1998] we used case study data from two releases of a major commercial system to test
a number of popular hypotheses about the basic metrics. The system was divided into many hundreds of
modules. The basic metrics data were collected at the module level (the metrics were: defects found at four
different testing phases, including in operation, LOC, and a number of complexity metrics including
cyclomatic complexity). We were especially interested in hypotheses which lie at the root of the popularity for
the basic metrics. Many of these are based around the idea that a small number of the modules inevitably have
a disproportionate number of the defects; the assumption is then that metrics can help us to identify early in
the development cycle such fault and failure prone modules.
Number Hypothesis Case study evidence?
1a a small number of modules contain most of the faults discovered
during pre-release testing
Yes - evidence of 20-60
rule
1b if a small number of modules contain most of the faults discovered
during pre-release testing then this is simply because those
modules constitute most of the code size
No
2a a small number of modules contain most of the operational faults Yes - evidence of 20-80
rule
2b if a small number of modules contain most of the operational
faults then this is simply because those modules constitute most of
the code size
No - strong evidence of a
converse hypothesis
3 Modules with higher incidence of faults in early pre-release likely
to have higher incidence of faults in system testing
Weak support
4 Modules with higher incidence of faults in all pre-release testing
likely to have higher incidence of faults in post-release operation
No - strongly rejected
5a Smaller modules are less likely to be failure prone than larger
ones
No
5b Size metrics (such as LOC) are good predictors of number of pre-
release faults in a module
Weak support
5c Size metrics (such as LOC) are good predictors of number of post-
release faults in a module
No
5d Size metrics (such as LOC) are good predictors of a module’s
(pre-release) fault-density
No
5e Size metrics (such as LOC) are good predictors of a module’s
(post-release) fault-density
No
6 Complexity metrics are better predictors than simple size metrics
of fault and failure-prone modules
Very weak support
7 Fault densities at corresponding phases of testing and operation
remain roughly constant between subsequent major releases of a
software system
Yes
8 Software systems produced in similar environments have broadly
similar fault densities at similar testing and operational phases
Yes
Table 1: Support for the hypotheses provided in this case study
The hypotheses and results are summarised in Table 1. We make no claims about the generalisation of these
results. However, given the rigour and extensiveness of the data-collection and also the strength of some of
the observations, we feel that there are lessons to be learned by the wider community.
6. 6
The evidence we found in support of the two Pareto principles 1a) and 2a) is the least surprising, but there
was previously little published empirical data to support it. However, the popularly believed explanations for
these two phenomena were not supported in this case:
• It is not the case that size explains in any significant way the number of faults. Many people seem to
believe (hypotheses 1b and 2b) that the reason why a small proportion of modules account for most faults
is simply because those fault-prone modules are disproportionately large and therefore account for most of
the system size. We have shown this assumption to be false for this system.
• Nor is it the case that ‘complexity’ (or at least complexity as measured by ‘complexity metrics’) explains
the fault-prone behaviour (hypothesis 6). In fact complexity is not significantly better at predicting fault
and failure prone modules than simple size measures.
• It is also not the case that the set of modules which are especially fault-prone pre-release are going to be
roughly the same set of modules that are especially fault-prone post-release (hypothesis 4).
The result for hypothesis 4 is especially devastating for much software metrics work. The rationale behind
hypothesis 4 is the belief in the inevitability of ‘rogue modules’ - a relatively small proportion of modules in
a system that account for most of the faults and which are likely to be fault-prone both pre- and post release. It
is often assumed that such modules are somehow intrinsically complex, or generally poorly built. This also
provides the rationale for complexity metrics. For example, Munson and Khosghoftaar asserted:
‘There is a clear intuitive basis for believing that complex programs have more faults in them than simple
programs’, [Munson and Khosghoftaar, 1992]
Not only was there no evidence to support hypothesis 4, but there was evidence to support a converse
hypothesis. In both releases almost all of the faults discovered in pre-release testing appear in modules which
subsequently revealed almost no operation faults (see Figure 1)
0
2
4
6
8
10
12
14
0 20 40 60 80 100
Pre-release faults
Post-
release
faults
0
5
10
15
20
25
30
35
0 20 40 60 80 100 120 140
Pre-release faults
Post-
release
faults
Release n Release n+1
Figure 1: Scatter plot of pre-release faults against post-release faults for successive versions of a major system
(each dot represents a module selected randomly)
These remarkable results are also closely related to the empirical phenomenon observed by Adams [Adams
1984]—that most operational system failures are caused by a small proportion of the latent faults. The results
have major ramifications for the commonly used fault density metric as a de-facto measure of user perceived
software quality. If fault density is measured in terms of pre-release faults (as is common), then at the module
level this measure tells us worse than nothing about the quality of the module; a high value is more likely to
be an indicator of extensive testing than of poor quality. Modules with high fault density pre-release are likely
to have low fault-density post-release, and vice versa. The results of hypothesis 4 also bring into question the
entire rationale for the way software complexity metrics are used and validated. The ultimate aim of
complexity metrics is to predict modules which are fault-prone post-release. Yet, most previous ‘validation’
studies of complexity metrics have deemed a metric ‘valid’ if it correlates with the (pre-release) fault density.
7. 7
Our results suggest that ‘valid’ metrics may therefore be inherently poor at predicting what they are supposed
to predict.
What we did confirm was that complexity metrics are closely correlated to size metrics like LOC. While LOC
(and hence also the complexity metrics) are reasonable predictors of absolute number of faults, they are very
poor predictors of fault density.
5. New Directions
The results in Section 4 provide mixed evidence about the usefulness of the commonly used metrics. Results
for hypotheses 1, 2,3, 7 and 8 explain why there is still so much interest in the potential of defects data to help
quality prediction. But the other results confirm that the simplistic approaches are inevitably inadequate. It is
fair to conclude that
• complexity and/or size measures alone cannot provide accurate predictions of software defects
• on its own, information about software defects (discovered pre-release) provides no information about
likely defects post-release.
• traditional statistical (regression-based) methods are inappropriate for defects prediction
In addition to the problem of using metrics data in isolation, the major weakness of the simplistic approaches
to defect prediction has been a misunderstanding of the notion of cause and effect. A correlation between two
metric values (such as a module’s size and the number of defects found in it) does not provide evidence of a
causal relationship. Consider, for example, our own result for hypothesis 4. The data we observed can be
explained by the fact that the modules in which few faults are discovered during testing may simply not have
been tested properly. Those modules which reveal large numbers of faults during testing may genuinely be
very well tested in the sense that all the faults really are 'tested out of them'. The key missing explanatory data
in this case is, of course, testing effort, which was unfortunately not available to us in this case study. As
another example, hypothesis 5 is the popular software engineering assumption that small modules are likely
to be (proportionally) less failure prone. In other words small modules have a lower defect density. In fact,
empirical studies summarised in [Hatton 1997] suggest the opposite effect: that large modules have a lower
fault density than small ones. We found no evidence to support either hypothesis. Again this is because the
association between size and fault density is not a causal one. It is for this kind of reason that we recommend
more complete models that enable us to augment the empirical observations with other explanatory factors,
most notably, testing effort and operational usage . If you do not test or use a module you will not observe
faults or failures associated with it.
Thus, the challenge for us is to produce models of the software development and testing process which take
account of the crucial concepts missing from traditional statistical approaches. Specifically we need models
that can handle:
• diverse process and product evidence
• genuine cause and effect relationships
• uncertainty
• incomplete information
At the same time the models must not introduce any additional metrics overheads, either in terms of the
amount of data-collection or the sophistication of the metrics.
After extensive investigations during the DATUM project 1993-1996 into the range of suitable formalisms
[Fenton et al 1998] we concluded that Bayesian belief nets (BBNs) were by far the best solution for our
problem. The only remotely relevant approach we found in the software engineering literature was the process
simulation method of [Abdel-Hamid 1991], but this did not attempt to model the crucial notion of
uncertainty.
BBNs have attracted much recent attention as a solution for problems of decision support under uncertainty.
Although the underlying theory (Bayesian probability) has been around for a long time, building and
executing realistic models has only been made possible because of recent algorithms (see [Jensen 1996]) and
8. 8
software tools that implement them [Hugin A/S]. To date BBNs have proven useful in practical applications
such as medical diagnosis and diagnosis of mechanical failures. Their most celebrated recent use has been by
Microsoft where BBNs underlie the help wizards in Microsoft Office. A number of recent projects in Europe,
most of which we have been involved in, have pioneered the use of BBNs in the area of software assessment
(especially for critical systems) [Fenton et al 1998], but other related applications include their use in time-
critical decision making for the propulsion systems on the Space Shuttle [Horvitz and Barry 1995].
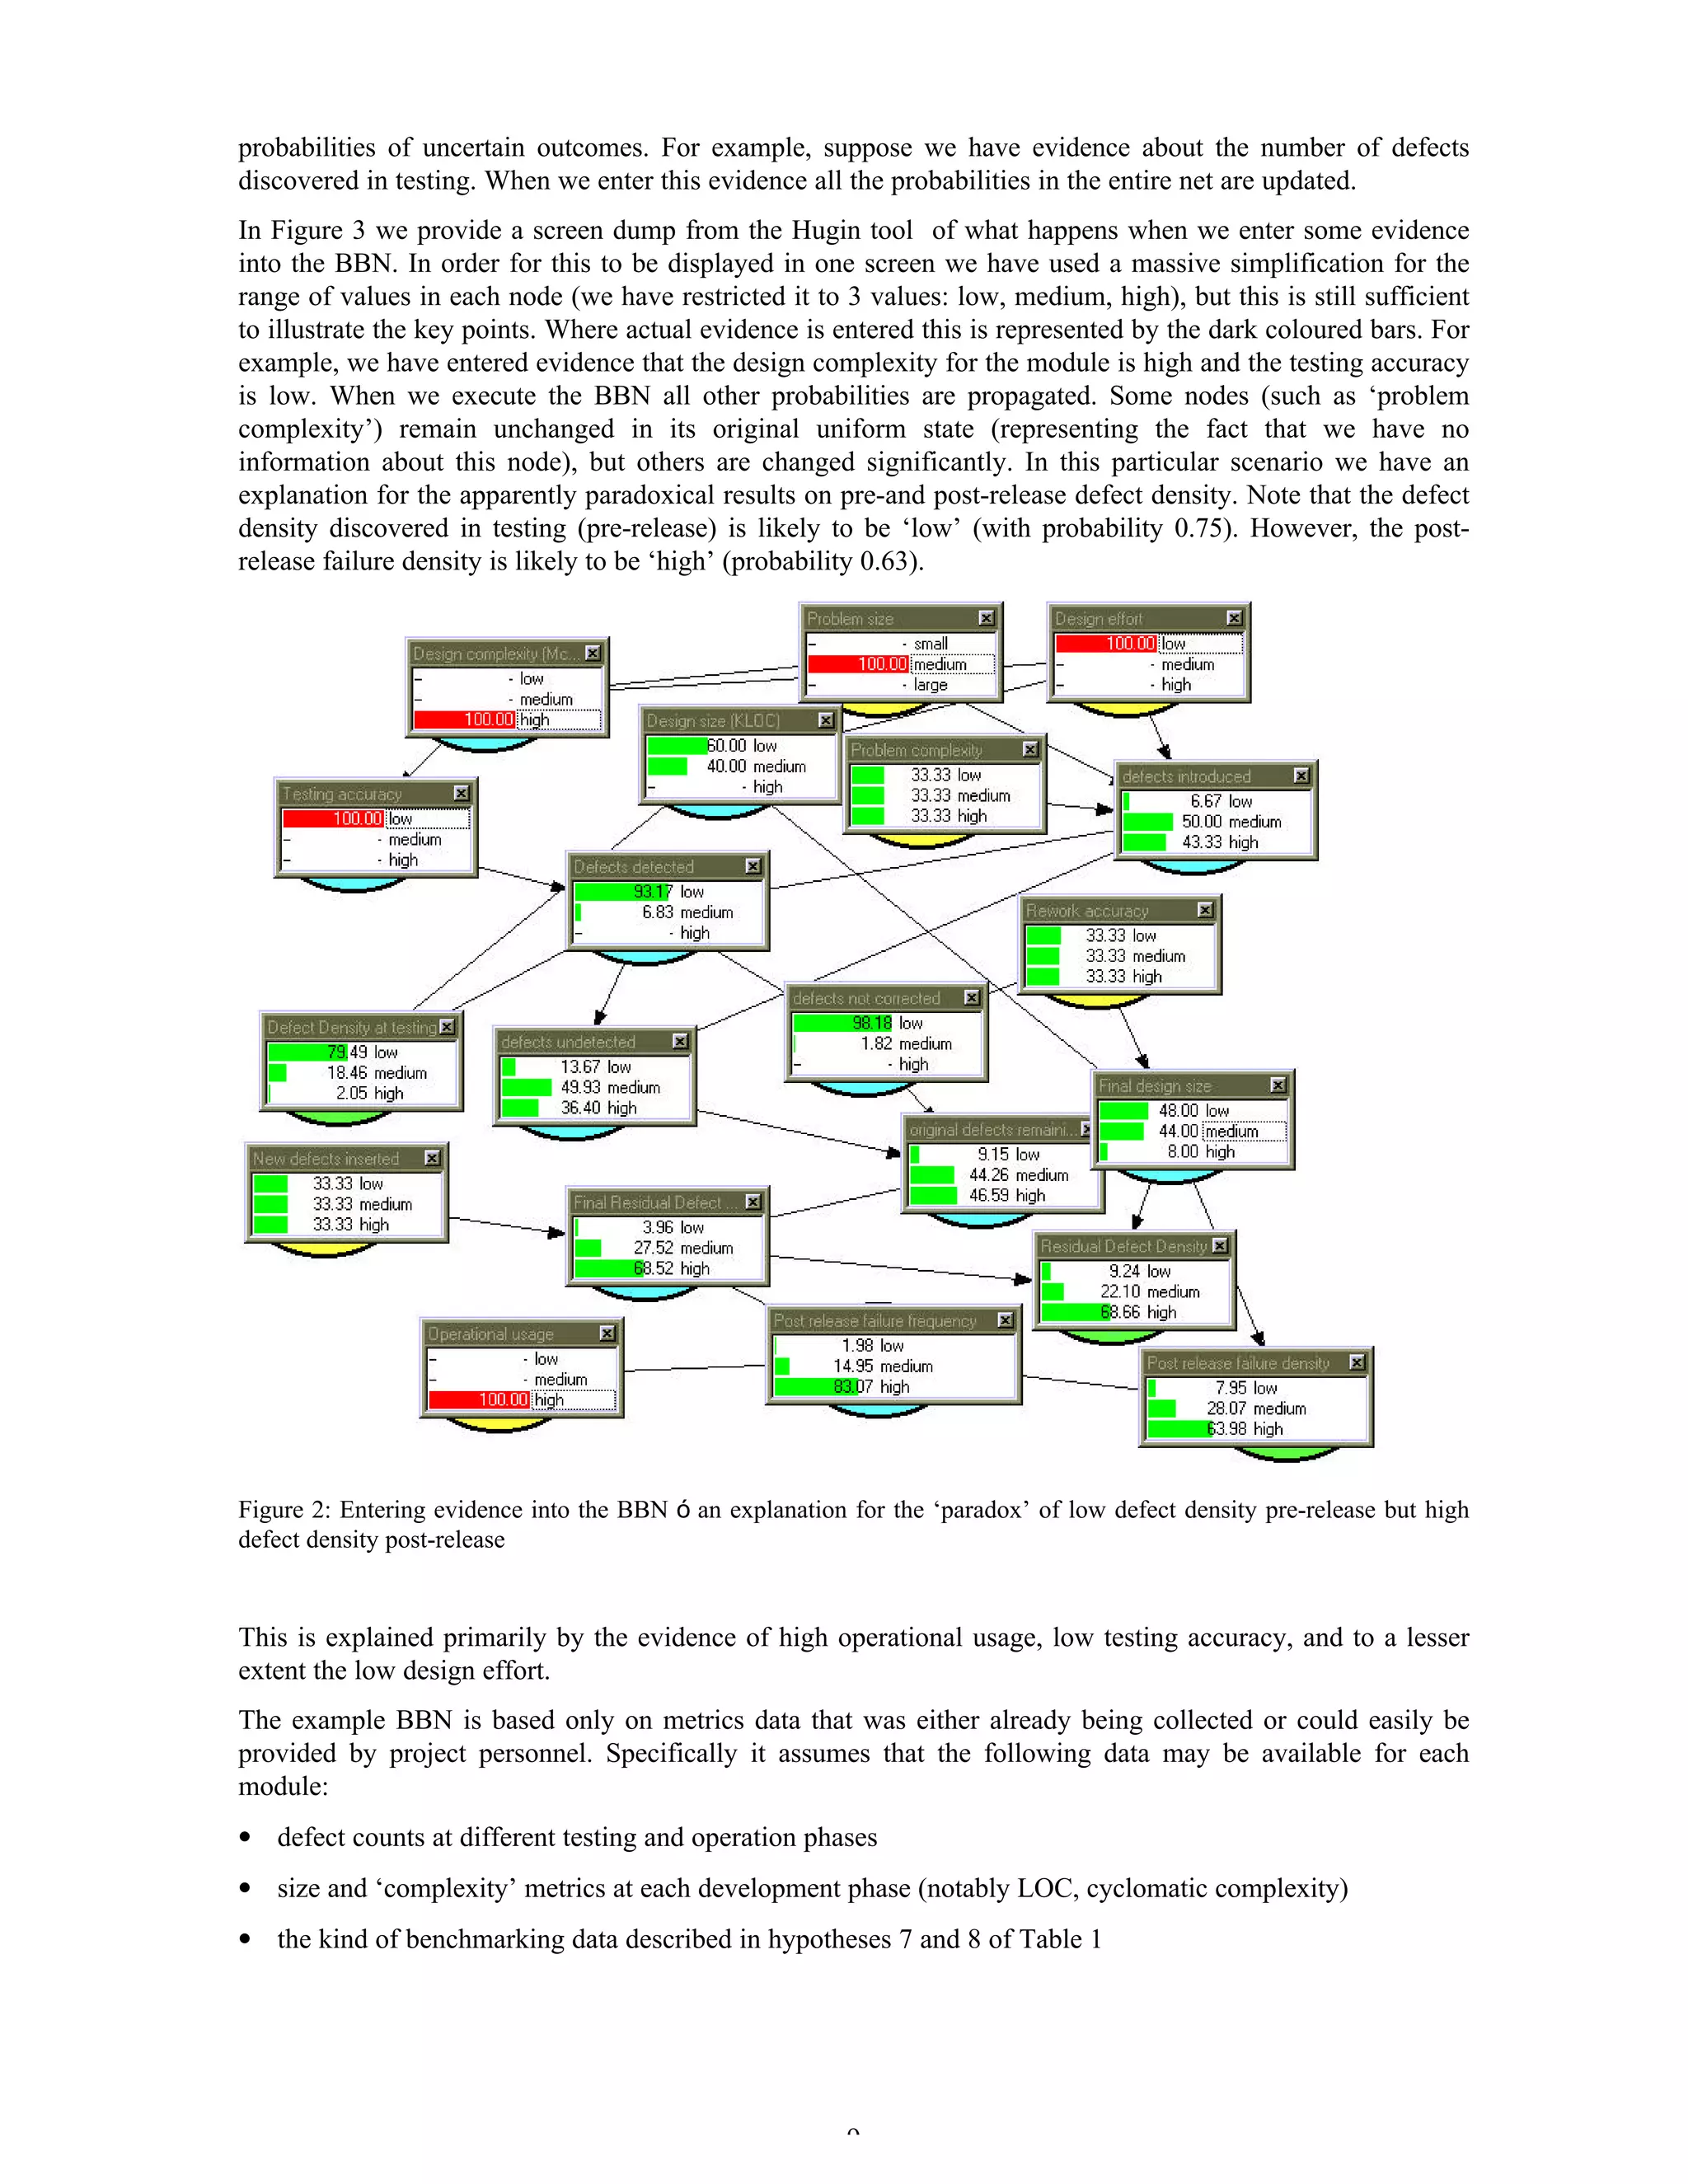
A BBN is a graphical network (such as that shown in Figure 2) together with an associated set of probability
tables. The nodes represent uncertain variables and the arcs represent the causal/relevance relationships
between the variables. The probability tables for each node provide the probabilities of each state of the
variable for that node. For nodes without parents these are just the marginal probabilities while for nodes
with parents these are conditional probabilities for each combination of parent state values. The BBN in
Figure 2 is a simplified version of the one that was built in collaboration with the partner in the case study
described in Section 4.
Defect Density at testing
Residual Defect Count
New defects inserted
defects not corrected
defects undetected
Testing quality
Defects detected
defects introduced
Problem complexity
Design effort
Problem size
Design size (KLOC)
Operational usage
Post release failure density
Final design size
Rework accuracy
Residual Defect Density
Figure 2: A BBN that models the software defects insertion and detection process
It is simplified in the sense that it only models one pre-release testing/rework phase whereas in the full
version there are three. Like all BBNs the probability tables were provided by a mixture of:
empirical/benchmarking data and subjective judgements. We have also developed (in collaboration with
Hugin A/S) tools for generating quickly very large probability tables. It is beyond the scope of this paper to
describe either BBNs or the particular example in detail (see [Fenton and Neil 1998] for a fuller account).
However, we can give a feel for its power and relevance.
First note that the model in Figure 2 contains a mixture of variables we might have evidence about and
variables we are interested in predicting. At different times during development and testing different
information will be available, although some variables such as ‘number of defects inserted’ will never be
known with certainty. With BBNs, it is possible to propagate consistently the impact of evidence on the
9. 9
probabilities of uncertain outcomes. For example, suppose we have evidence about the number of defects
discovered in testing. When we enter this evidence all the probabilities in the entire net are updated.
In Figure 3 we provide a screen dump from the Hugin tool of what happens when we enter some evidence
into the BBN. In order for this to be displayed in one screen we have used a massive simplification for the
range of values in each node (we have restricted it to 3 values: low, medium, high), but this is still sufficient
to illustrate the key points. Where actual evidence is entered this is represented by the dark coloured bars. For
example, we have entered evidence that the design complexity for the module is high and the testing accuracy
is low. When we execute the BBN all other probabilities are propagated. Some nodes (such as ‘problem
complexity’) remain unchanged in its original uniform state (representing the fact that we have no
information about this node), but others are changed significantly. In this particular scenario we have an
explanation for the apparently paradoxical results on pre-and post-release defect density. Note that the defect
density discovered in testing (pre-release) is likely to be ‘low’ (with probability 0.75). However, the post-
release failure density is likely to be ‘high’ (probability 0.63).
Figure 2: Entering evidence into the BBN — an explanation for the ‘paradox’ of low defect density pre-release but high
defect density post-release
This is explained primarily by the evidence of high operational usage, low testing accuracy, and to a lesser
extent the low design effort.
The example BBN is based only on metrics data that was either already being collected or could easily be
provided by project personnel. Specifically it assumes that the following data may be available for each
module:
• defect counts at different testing and operation phases
• size and ‘complexity’ metrics at each development phase (notably LOC, cyclomatic complexity)
• the kind of benchmarking data described in hypotheses 7 and 8 of Table 1
10. 10
• approximate development and testing effort
At any point in time there will always be some missing data. The beauty of a BBN is that it will compute the
probability of every state of every variable irrespective of the amount of evidence. Lack of substantial hard
evidence will be reflected in greater uncertainty in the values.
In addition to the result that high defect density pre-release may imply low defect density post-release, we
have used this BBN to explain other empirical results that were discussed in Section 4, such as the scenario
whereby larger modules have lower defect densities .
The benefits of using BBNs include:
• explicit modelling of ‘ignorance’ and uncertainty in estimates, as well as cause-effect relationships
• makes explicit those assumptions that were previously hidden - hence adds visibility and auditability to
the decision making process
• intuitive graphical format makes it easier to understand chains of complex and seemingly contradictory
reasoning
• ability to forecast with missing data.
• use of ‘what-if?’ analysis and forecasting of effects of process changes;
• use of subjectively or objectively derived probability distributions;
• rigorous, mathematical semantics for the model
• no need to do any of the complex Bayesian calculations, since tools like Hugin do this
Clearly the ability to use BBNs to predict defects will depend largely on the stability and maturity of the
development processes. Organisations that do not collect the basic metrics data, do not follow defined life-
cycles or do not perform any forms of systematic testing will not be able to apply such models effectively. This
does not mean to say that less mature organisations cannot build reliable software, rather it implies that they
cannot do so predictably and controllably.
6. Conclusions
The increased industrial software metrics activity seen in the last 10 years may be regarded as a successful
symptom of an expanding subject area. Yet, this industrial practice is not related in content to the increased
academic and research activity. The ‘metrics’ being practised are essentially the same basic metrics that were
around in the late 1960’s. In other words these are metrics based around LOC (or very similar) size counts,
defect counts, and crude effort figures (in person months). The mass of academic metrics research has failed
almost totally in terms of industrial penetration. This is a particularly devastating indictment given the
inherently ‘applied’ nature of the subject. Having been heavily involved ourselves in academic software
metrics research the obvious temptation would be to criticise the short-sightedness of industrial software
developers. Instead, we recognise that industrialists have accepted the simple metrics and rejected the
esoteric for good reasons. They are easy to understand and relatively simple to collect. Since the esoteric
alternatives are not obviously more ‘valid’ there is little motivation to use them. We are therefore using
industrial reality to fashion our research. One of our objectives is to develop metrics-based management
decision support tools that build on the relatively simple metrics that we know are already being collected.
These tools combine different aspects of software development and testing and enable managers to make
many kinds of predictions, assessments and trade-offs during the software life-cycle, without any major new
metrics overheads. Most of all our objective is to handle the key factors largely missing from the usual metrics
models: uncertainty and combining different (often subjective) evidence. Traditional (largely regression-
based) models are inadequate for this purpose. We have shown how the exciting technology of Bayesian nets
(whose complexities are hidden to users) helps us meet our objective. The approach does, however, force
managers to make explicit those assumptions which were previously hidden in their decision-making process.
We regard this as a benefit rather than a drawback. The BBN approach is actually being used on real projects
and is receiving highly favourable reviews. We believe it is an important way forward for metrics research.
11. 11
7. Acknowledgements
The work was supported, in part, by the EPSRC-funded project IMPRESS, and the ESPRIT-funded projects
DEVA and SERENE. We are also indebted to Niclas Ohlsson for his work on the case study described in this
paper.
8. References
Abdel-Hamid TK, ''The slippery path to productivity improvement'', IEEE Software, 13(4), 43-52, 1996.
Adams E , ''Optimizing preventive service of software products'', IBM Research Journal, 28(1), 2-14, 1984.
Akiyama F, ''An example of software system debugging'', Inf Processing 71, 353-379, 1971.
Albrecht A.J, Measuring Application Development, Proceedings of IBM Applications Development joint
SHARE/GUIDE symposium. Monterey CA, pp 83-92, 1979.
Bache R and Neil M, ''Introducing metrics into industry: a perspective on GQM'', in 'Software Quality Assurance and
metrics: A Worldwide prespective' (Eds: Fenton NE, Whitty RW, Iizuka Y, International Thomson Press, 59-68, 1995.
Basili VR and Rombach HD, The TAME project: Towards improvement-oriented software environments, IEEE
Transactions on Software Engineering 14(6), pp 758-773, 1988.
Basili VR and Reiter RW, A controlled experiment quantitatively comparing software development approaches, IEEE
Trans Soft Eng SE-7(3), 1981.
Basili VR, Selby RW and Hutchens DH, Experimentation in software engineering, IEEE Trans Soft Eng SE-12(7), 733-
743, 1986.
Boehm BW, Software Engineering Economics, Prentice-Hall, New York, 1981.
Briand LC, Morasca S, Basili VR, Property-based software engineering measurement, IEEE Transactions on Software
Engineering, 22(1), 68-85, 1996.
Brocklehurst, S and Littlewood B, New ways to get accurate software reliability modelling, IEEE Software, 34-42, July,
1992.
Chidamber SR and Kemerer CF, A metrics suite for object oriented design, IEEE Trans Software Eng, 20 (6), 476-498,
1994.
DeMarco T, 'Controlling Software Projects’, Yourden Press, New York, 1982
Fenton NE, Software Metrics: A Rigorous Approach, Chapman and Hall, 1991.
Fenton NE, Littlewood B, Neil M, Strigini L, Sutcliffe A, Wright D, Assessing Dependability of Safety Critical Systems
using Diverse Evidence, IEE Proceedings Software Engineering, 145(1), 35-39, 1998.
Fenton NE and Neil M, A Critique of Software Defect Prediction Models, IEEE Transactions on Software Engineering, to
appear, 1998.
Fenton NE and Ohlsson N, Quantitative Analysis of Faults and Failures in a Complex Software System, IEEE
Transactions on Software Engineering, to appear, 1998.
Fenton NE and Pfleeger SL, Software Metrics: A Rigorous and Practical Approach (2nd Edition), International Thomson
Computer Press, 1996.
Fenton NE, Pfleeger SL, Glass R, ''Science and Substance: A Challenge to Software Engineers'', IEEE Software, 11(4),
86-95, July, 1994.
Gilb T and Graham D, Software Inspections, Addison Wesley, 1994.
Gilb T, Principles of Software Engineering Management, Addison Wesley, 1988.
Gilb T, Software Metrics, Chartwell-Bratt, 1976.
Glass RL, ''A tabulation of topics where software practice leads software theory'', J Systems Software, 25, 219-222, 1994.
Grady R and Caswell D, Software Metrics: Establishing a Company-wide Program, Prentice Hall, Englewood Cliffs,
New Jersey, 1987.
Grady, R.B, Practical Software Metrics for Project Management and Process Improvement, Prentice-Hall, 1992.
Hall T and Fenton NE, ''Implementing effective software metrics programmes'', IEEE Software, 14(2), 55-66, 1997.
Halstead M, Elements of Software Science, North Holland, , 1977.
Hatton L, Reexamining the fault density - component size connection, IEEE Software, 14(2), 89-97, 1997.
Hetzel, William C, Making Software Measurement Work: Building an Effective Software Measurement Program, QED
Publishing Group, Wellesley MA, 1993.
Horvitz E and Barry M, ''Display of information for time-critical decision making'', Proc of 11th Conf in AI, Montreal,
August, 1995.
Hugin A/S: www.hugin.dk
Humphrey WS, Managing the Software Process, Addison-Wesley, Reading, Massachusetts, 1989.
12. 12
Jeffery R and Stathis J, Function point sizing: structure, validity and applicability, Empirical Software Engineering, 1(1),
11-30, 1996.
Jensen FV, An Introduction to Bayesian Networks, UCL Press, 1996.
Jones C, ''Applied Software Measurement'', McGraw Hill, 1991.
Kitchenham BA, Using function points for software cost estimation, in 'Software Quality Assurance and Measurement'
(Eds Fenton NE, Whitty RW, Iizuka Y), International Thomson Computer Press, 266-280, 1995.
McCabe T, A Software Complexity Measure, IEEE Trans. Software Engineering SE-2(4), 308-320, 1976.
Munson JC, and Khoshgoftaar TM, The detection of fault-prone programs, IEEE Transactions on Software
Engineering,18(5), 423-433, 1992.
Onvlee J, ''Use of function points for estimation and contracts'', in 'Software Quality Assurance and Metrics' (Fenton N,
Whitty RW, Iizuka Y eds), 88-93, 1995.
Putnam LH, A general empirical solution to the macro software sizing and estimating problem, IEEE Trans Soft Eng SE-
4(4), 1978, 345-361, 1978.
Symons, CR, Software Sizing & Estimating: Mark II Function point Analysis, John Wiley, 1991.
Zuse H, Software Complexity: Measures and Methods, De Gruyter. Berlin, 1991
13. Norman Fenton
Norman Fenton is Professor of Computing Science at the Centre for Software Reliability,
City University, London and also Managing Director of Agena Ltd, a company specializing
in risk management for critical computer systems. He is a Chartered Engineer who
previously held academic posts at University College Dublin, Oxford University and South
Bank University where he was Director of the Centre for Systems and Software
Engineering. He has been project manager and principal researcher in many major
collaborative projects. His recent and current projects cover the areas of: software metrics;
safety critical systems assessment; Bayesian nets for systems' assessment; software
reliability tools. Professor Fenton has written several books on software metrics and related
subjects.