Downloaded 50 times
![Comparison Ofavailable Methods To Estimate Effort, Performance And Cost With The Proposed
www.ijeijournal.com Page | 56
project.Software size estimates are converted to software effort estimations to arrive at effort, and then the total
cost of the whole software project is calculated. Estimating size and effort are the most important topics in the
area of software project management. Next while discussing a proposed model for effort estimation, a number
of enhancements to adjustment factors is introduced. One of the enhancements proposed in this model is
grouping the available 14 GSCs into three groups. They are “System complexity”, “I/O complexity” and
“Application complexity”. Another important enhancement in this proposed Effort Estimation model is the
consideration of the quality of requirements as an adjustment factor and this “Quality complexity” is added as
the fourth group to the adjustment factor. There are several approaches for estimating such efforts, this work
proposes a fuzzy logic based approach using Mat lab for quality selection.The obtained function point is given
as input to the top layer, the top layer consist of Intermediate COCOMO and COCOMO II model, former
computes effort as a function of program size and analysis has been done to define rating for the cost drivers and
by adding the new rating the developmental effort is obtained while for the latter, it gets function point as input
and computes effort as a function of program size, set of cost drivers, scale factors, Baseline Effort Constants
and Baseline Schedule Constants. Cost estimation must be done more diligently throughout the project life cycle
so that there are fewer surprises and delays in the release of a product.Performance of the software projects are
also measured. By adding the new rating the developmental effort obtained is very much nearer to the planned
effort and also a comparative study is done between the existing and our proposed method [41]
II. Related work
Estimation by expert [1][2], analogy based estimation schemes [3], algorithmic methods including
empirical methods [4], rule induction methods [5], artificial neural network based approaches [6] [7] [8],
Bayesian network approaches [9], decision tree based methods [10] and fuzzy logic based estimation schemes
[11][12]. Among these diversified models, empirical estimation models are found to be possibly accurate
compared to other estimation schemes and COCOMO, SLIM, SEER-SEM and FP analysis schemes are popular
in practice in the empirical category [13] [14]. In case of empirical estimation models, the estimation parameters
are commonly derived from empirical data that are usually collected from various sources of historical or passed
projects. Accurate effort and cost estimation of software applications continues to be a critical issue for software
project managers [15].Although expert judgment remains widely used, there is also increasing interest in
applying statistics and machine learning techniques to predict software project effort [16][17]. Although, neural
networks have shown their strengths in solving complex problems, their limitation of being „black boxes‟ has
forbidden them to be accepted as a common practice for cost estimation [18]. Hardware costs, travel and
training costs and effort costs are the three principal components of cost of which the effort cost is dominant
[19][20]. Although many research papers appear since 1960 providing numerous models to help in computing
the effort/cost for software projects, being able to provide accurate effort/cost estimation is still a challenge for
many reasons. They include: (i) the uncertainty in collected measurement, (ii) the estimation methods used
which might have many drawbacks and (iii) the cost drivers to be considered along with the development
environment which might not be clearly specified [21]. The most popular algorithmic estimation models include
Boehm‟s constructive cost model (COCOMO) [22]. Thus, accurate estimation methods, for example, the FP
method, have gained increasing importance [23]. . The size is determined by identifying the components of the
system as seen [23] by the end-user: the inputs, outputs, inquiries, interfaces [24] to other systems and logical
internal files [25]. The components are classified as simple, average or complex. All these values are then
scored and the total is expressed in unadjusted FPs (UFPs). Complexity factors described by 14 general systems
characteristics, such as reusability [26, 27], performance and complexity of processing can be used to weigh the
UFP. Factors are also weighed on a scale of 0 – not present 1 – minor influence, to 5 – strong influence [28][29].
The result of these computations is a number that correlates to system size. Although the FP metric does not
correspond to any actual physical attribute of a software system [30, 31] (such as lines of code or the number of
subroutines) it is useful as a relative measure for comparing projects, measuring productivity, and estimating the
amount a development effort and time needed for a project [32, 33]. The total number of FPs depends on the
counts of distinct (in terms of format or processing logic) types in the following five classes [34]. It is well
documented that the software industry suffers from frequent cost overruns [35]. A contributing factor is, we
believe, the imprecise estimation terminology in use. A lack of clarity and precision [36] in the use of estimation
terms reduces the interpretability of estimation [37] accuracy results, makes the communication of estimates
difficult and lowers the learning possibilities [38]. Number of enhancements to adjustment factors is introduced.
One of the enhancements proposed in this model is grouping the available 14 GSCs into three groups. They are
“System complexity”, “I/O complexity” and “Application complexity”. Another important enhancement in this
proposed Effort Estimation model is the consideration of the quality of requirements as an adjustment factor and
this “Quality complexity” is added as the fourth group to the adjustment factor. There are several approaches for
estimating such efforts, this work proposes a fuzzy logic based approach using Mat lab for quality selection. The
obtained function point is given as input to the top layer, the top layer consist of Intermediate COCOMO and](https://image.slidesharecdn.com/i02095568-130910044137-phpapp01/85/Comparison-of-available-Methods-to-Estimate-Effort-Performance-and-Cost-with-the-Proposed-Method-2-320.jpg)
![Comparison Ofavailable Methods To Estimate Effort, Performance And Cost With The Proposed
www.ijeijournal.com Page | 57
COCOMO II model.Performance of the software projects are also measured in the top layer. By adding the new
rating the developmental effort obtained is very much nearer to the planned effort and also a comparative study
is done between the existing and our proposed method.[39][40][41][42]. The inputs are the Size ofsoftware
development, a constant, A, and a scale factor, B. The size is in units of thousands of source lines of code
(KSLOC) [43].
III. System Overview
To investigate how the cost and effort estimation task is concentrated on the development of software
systems and not much on the quality coverage, our paper focus on the Quality assurance for effort estimation
work. The questions we raise are as follows:
1. Why grouping of General System characteristic for software estimation as a collaborative activity is
needed?
2. What types of Quality assurance are needed to accomplish the estimation task?
3. What type of techniques can be considered for building our quality models?
4. Which type will overcome all the potential problems?
5. Does trimming of scale factors and cost drivers improve the estimation and how our model benefits by
trimming?
6. What are the problems that the traditional size metric face, and how it is overcome with Function point.
7. Drawbackof Existing Function point models and how it is overcome with the enhanced Function point and
the author‟s inclusion of quality models.
8. What does Performance measurement focuses on, andwhat does success really mean?
The grouping of the 14 GSC into groups is needed to simplify the counting process and reduces the
probability of errors while counting; this enhanced system focuses on minimizing the effort by enhancing the
adjustments made to the functional sizing techniques.
In the existing systems, the effort and cost estimation are more concentrated on the development of
software systems and not much on the quality coverage. Hence, the proposed model ensures the quality
assurance for the effort estimation.
This paper presents fuzzy classification techniques as a basis for constructing quality models that can
identify outlying software components that might cause potential quality problems and this “Quality
complexity” is added as the fourth group in the enhancement process. From the four groups, proposed value
adjustment factor is calculated. The total adjustment function point is the product of unadjusted function point
and the proposed value adjustment factor.
COCOMO II model computes effort as a function of program size (function point got from our model
is converted to Lines of code), set of trimmed cost drivers, trimmed scale factors, Baseline Effort Constants and
Baseline Schedule Constants. Empirical validation for software development effort multipliers of COCOMO II
model is analyzed and the ratings for the cost drivers are defined. By adding new ratings to the cost drivers and
scale factors and seeing that the characteristic behaviour is not altered, the developmental person month of our
proposed model is obtained, and Intermediate COCOMO model computes effort as a function of program size
(got from author‟s proposed model)and a set of trimmed cost drivers, also the effort multipliers of Intermediate
COCOMO model is analyzed and the ratings for the cost drivers are defined. By adding new ratings to the cost
drivers and seeing that the characteristic behaviour is not altered, the developmental person month of our
proposed model is obtained. It is observed that the effort estimated with COCOMO II and Intermediate
COCOMO are very much nearer to their respective planned efforts; with our proposed cost model minimal
effort variance can be achieved by predicting the cost drivers for computing the EAF. Thus our proposed model
computes Effort, Cost and measures the performance of the software projects, also a comparative study is done
between the existing model and our model taking samples data‟s of HR application and Hospital application.
The software size is the most important factor that affects the software cost. There are mainly two types
of software size metrics: source lines of code (SLOC) and FPs. SLOC is a natural artefact that measures
software physical size but it is usually not available until the coding phase and difficult to have the same
definition across different programming languages. FPs is an ideal software size metric to estimate cost since it
can be obtained in the early development phase. function points are independent of the language, tools, or
methodologies used for implementation; i.e., they do not take into consideration programming languages, data
base management systems, processing hardware, or any other data processing technology. Second, function
points can be estimated from requirements specifications or design specifications, thus making it possible to
estimate development effort in the early phases of development.
The grouping of the 14 GSC into groups simplifies the counting process and reduces the probability of
errors while counting; this enhanced system focuses on minimizing the effort by enhancing the adjustments](https://image.slidesharecdn.com/i02095568-130910044137-phpapp01/85/Comparison-of-available-Methods-to-Estimate-Effort-Performance-and-Cost-with-the-Proposed-Method-3-320.jpg)
![Comparison Ofavailable Methods To Estimate Effort, Performance And Cost With The Proposed
www.ijeijournal.com Page | 58
made to the functional sizing techniques. In the existing systems, the effort and cost estimation are more
concentrated on the development of software systems and not much on the quality coverage. Hence the quality
assurance for the effort estimation is proposed in this paper. This paper discusses fuzzy classification techniques
as a basis for constructing quality models that can identify the quality problems.
Performance measurement is a process of assessing the results of a company, organization, project, or
individual to (a) determine how effective the operations are, and (b) make changes to address performance gaps,
shortfalls, and other problems.
IV. Modeling Procedure
The proposed modeling procedure clearly describes the steps to build the effort/cost models. The tasks
and their importance are also explained in detail in their respective sections.
Fig 1 Block diagram of the Proposed Model
V. Lines of Code
The traditional size metric for estimating software developmenteffort and for measuring productivity
has been lines ofcode (LOC). A large number of cost estimation models havebeen proposed, most of which are a
function of lines of code,or thousands of lines of code (KLOC). Generally, the effortestimation model consists
of two parts. One part provides abase estimate as a function of software size and is of thefollowing form:
E = A + B x (KLOC)C
Where E is the estimated effort in man-months; A. B. andC are constants; and KLOC is the estimated
number ofthousands of line of code in the final system. The secondpart modifies the base estimate to account for
the influence ofenvironmental factors [33]. As an example, Boehm‟s COCOMO model uses lines of coderaised
to a power between 1.05 and 1.20 to determine thebase estimate. The specific exponent depends on whether
theproject is simple, average, or complex. The model then uses15 cost influence factors as independent
multipliers to adjustthe base estimate. Conte, Dunsmore, and Shenidentifiedsome typical models including the
following:
Method to calculate Lines of code, Function point and person
month are discussed with the existing method
Fuzzy based proposed model for effort estimation is proposed
Intermediate COCOMO and COCOMO II model are discussed to
calculate effort and cost with the proposed function point and
trimmed drivers and also the performance of s/w projects are
measured.
Albrecht’s FP and Author’s proposed FP are taken and each
is converted to its LOC using the language factor, the LOC
is applied to different cost and effort estimation methods
available and a comparison is done.
Albrecht’s FP and Author’s proposed FP are taken and
each FP is applied to the different Effort and Cost
estimation model available and a comparison is done.](https://image.slidesharecdn.com/i02095568-130910044137-phpapp01/85/Comparison-of-available-Methods-to-Estimate-Effort-Performance-and-Cost-with-the-Proposed-Method-4-320.jpg)
![Comparison Ofavailable Methods To Estimate Effort, Performance And Cost With The Proposed
www.ijeijournal.com Page | 59
5.1) Walston-Felix is a model developed by C.E. Walston and C.P. Felix in 1977, is a method of programming
measurement and estimation. Walston& Felix, is one of the static single variable models
E = 5.2 x (KLOC)0.91
(Walston-Felix model)
5.2)Nanus& Farr
PM = aL1.5
,where L = estimated KLOC
5.3) Bailey-Basili model [5] is based on data collected by organization which captures its environmental
factors and the differences among given projects
E = 5.5 + 0.73 x (KLOC) 1.16
(Bailey-Basili model)
5.4) E = 3.2 x (KLOC) 1.05
(Boehm simple model)
5.5) E = 3.0 x (KLOC) l.l2
(Boehm average model)
5.6) E = 2.8 x (KLOC)1.20
(Boehm complex model)
5.7) Doty model, published in 1977, is used to estimate efforts for Kilo lines of code (KLOC).
E = 5.288 x (KLOC)1.047 (Doty model).
The definition of KLOC is important when comparing thesemodels. Some models include comment
lines, and others donot. Similarly, the definition of what effort (E) is beingestimated is equally important. Effort
may represent onlycoding at one extreme or the total analysis, design, coding, andtesting effort at the other
extreme. As a result, it is difficultto compare these models.There are a number of problems with using LOC as
the unitof measure for software size. The primary problem is the lackof a universally accepted definition for
exactly what a line ofcode really is. Another difficulty with lines of code as a measure of systemsize is its
language dependence. It is not possible to directlycompare projects developed by using different languages.Still
another problem with the lines of code measure is thefact that it is difficult to estimate the number of lines of
codethat will be needed to develop a system from the information available at requirements or design phases of
development If cost models based on size are to be useful, it is necessaryto be able to predict the size of the final
product as early andaccurately as possible. Finally, the lines of codemeasure places undue emphasis on coding,
which is only onepart of the implementation phase of a software developmentproject.
VI. Theoretical background for effort and cost estimation based on function points[33]
Software cost estimation is the process of predicting theeffort to be required to develop a software
system. Most cost estimation models attempt to generate an effort estimate, which can then be converted into the
project duration and cost. Effort is often measured in person months of the programmers, analysts and project
managers. The software size is the most important factor that affects the software cost. There are mainly two
types of software size metrics: source lines of code (SLOC) and FPs. SLOC is a natural artefact that measures
software physical size but it is usually not available until the coding phase and difficult to have the same
definition across different programming languages. FPs is an ideal software size metric to estimate cost since it
can be obtained in the early development phase, such as requirement, measures the software functional size and
is programming language independent. Calibrating FPs incorporates
6.1 Function Point
The function point metric (FP) proposed by Albrecht can be used effectively as a means for measuring the
functionality delivered by a system using historical data. FP can then be used to Estimate the cost or effort
required to design, code and test the software, Predict the number of errors that will be encountered during
testing and Forecast the number of components and/or the number of projected source lines in the implemented
system.
The steps for Calculating Function point metric is:
Count total is calculated using Information domain and the weighting factor.
The Value added factor is based on the responses to the following 14 characteristics, each involving
a scale from 0 to 5 and the empirical constants
Function point is the product of Count total and the Value added factor.](https://image.slidesharecdn.com/i02095568-130910044137-phpapp01/85/Comparison-of-available-Methods-to-Estimate-Effort-Performance-and-Cost-with-the-Proposed-Method-5-320.jpg)
![Comparison Ofavailable Methods To Estimate Effort, Performance And Cost With The Proposed
www.ijeijournal.com Page | 60
Thus Function points (FP) provide a measure of the functionality of a software product and is obtained
using the following equation:
FP = count-total X [0.65 + 0.01 X Σ Fi]
Where the count-total is a summation of weighted input/output characteristics, and Fi is the summation of
fourteen ranked factors.
Function point analysis is a method of quantifying the sizeand complexity of a software system in terms of the
functionsthat the system delivers to the user [33][39]. The function point approach has features that overcome
themajor problems with using lines of code as a measure of systemsize. First, function points are independent of
the language,tools, or methodologies used for implementation. Second, function pointscan be estimated from
requirements specifications or designspecifications, thus making it possible to estimate developmenteffort in the
early phases of development. Since functionpoints are directly linked to the statement of requirements,any
change of requirements can easily be followed by areestimate.Third, since function points are based on
thesystem user‟s extemal view of the system, nontechnical usersof the software system have a better
understanding of whatfunction points are measuring .The method resolves manyof the inconsistencies that arise
when using lines of code asa software size measure.FPs can be used to estimate the relative size and complexity
ofsoftware in the early stages of development – analysis and designthe historical information and gives a more
accurate view of software size. Number of external inputs (Els): Each El originates from a user or is transmitted
from another application and providesdistinct application-oriented data or control information.Inputs are often
used to update internal logical files (ILFs).Inputs should be distinguished from enquiries, which arecounted
separately.Number of external outputs (EOs): Each EO is derivedwithin the application and provides
information to the user.In this context EO refers to reports, screens, error messages,and so on. Individual data
items within a report are notcounted separately.Number of external enquiries (EQs): An EQ is defined asan
online input that results in the generation of someimmediate software response in the form of an onlineoutput
(often retrieved from an ILF).Number of ILFs: Each ILF is a logical grouping of data thatresides within the
application‟s boundary and is maintainedviaEls.Number of external interface files (EIFs): Each EIF is alogical
grouping of data that resides external to theapplication but provides data that may be of use to
theapplication.Organisations that use FP methods can develop criteria fordetermining whether a particular entry
is simple, average orcomplex. Nonetheless, the determination of complexity is somewhat subjective.The
function point metric (FP), first proposed by Albrecht [ALB79] can be used to
Estimate the cost or effort required to design, code and test the software.
Predict the number of errors that will be encountered during testing.
Forecast the number of components and /or the number of projected source lines in the implemented
system.
Existing FP-oriented Estimation/Cost models From the Literature (33):
6.1.1 SEER-SEM ESTIMATION MODEL
SEER (System Evaluation and Estimation of Resources) is a proprietary model owned by Galorath
Associates, Inc. SEER (SEER-SEM) is an algorithmic project management software application designed
specifically to estimate, plan and monitor the effort and resources required for any type of software development
and/or maintenance project. SEER, referring to one having the ability to foresee the future, relies on parametric
algorithms, knowledge bases, simulation-based probability, and historical precedents to allow project managers,
engineers, and cost analysts to accurately estimate a project's cost schedule, risk and effort before the project is
started. This model is based upon the initial work of Dr. Randall Jensen. The mathematical equations used in
SEER are not available to the public, but the writings of Dr. Jensen make the basic equations available for
review. The basic equation, Dr.Jensen calls it the "software equation" is:
Se =Cte(Ktd)0.5
where, „S‟ is the effective lines of code, „ct‟ is the effective developer technology constant, „k‟ is the total life
cycle cost in man-years, and „td‟ is the development time in years
6.1.2) Albrecht and Gaffney model
The Alhrechtand Gaffney Model Albrecht-Gaffney model established by IBM DP
ServicesOrganization uses function point to estimate efforts. Albrecht and Gaffney give the function point
counts and the resulting work-hours, which we call effort, for each project.](https://image.slidesharecdn.com/i02095568-130910044137-phpapp01/85/Comparison-of-available-Methods-to-Estimate-Effort-Performance-and-Cost-with-the-Proposed-Method-6-320.jpg)
![Comparison Ofavailable Methods To Estimate Effort, Performance And Cost With The Proposed
www.ijeijournal.com Page | 61
E = 12.39 + 0.0545 FP Albrecht and Gaffney model (3)
6.1.3)Kemerer model
Kemerer model is a cost estimation model using function points and linear regression. Kemmerer also
developed a cost estimation model using function points and linear regression. The dependent variable, Effort,
is measured in man-months where one man-month is 152 work-hours.
E = −37 + 0.96 FP Kemerer model (4)
6.1.4). SLIM ESTIAMTION MODEL
The Putnam model is an empirical software effort estimation model.[1]
The original paper by
Lawrence H. Putnam published in 1978 is seen as pioneering work in the field of software process
modelling.The SLIM estimating method was developed in the late 1970s by Larry Putnam of Quantitative
Software Management [34,35, 36]. SLIM Software Life-Cycle Model was developed by Larry. Putnam [37].
SLIM hires the probabilistic principle calledRayleigh distribution between personnel level and time. It is one of
the earliest of these types of models developed, and is among the most widely used. Closely related software
parametric models are Constructive Cost Model (COCOMO), Parametric Review of Information for Costing
and Evaluation – Software (PRICE-S), and Software Evaluation and Estimation of Resources – Software
Estimating Model (SEER-SEM).
Putnam used his observations about productivity levels to derive the software equation:
where:
Size is the product size (whatever size estimate is used by your organization is appropriate). Putnam
uses ESLOC (Effective Source Lines of Code) throughout his books.
B is a scaling factor and is a function of the project size.
Productivity is the Process Productivity, the ability of a particular software organization to produce
software of a given size at a particular defect rate.
Effort is the total effort applied to the project in person-years.
Time is the total schedule of the project in years.
In practical use, when making an estimate for a software task the software equation is solved for effort:
LOC = c K0.3
T1.3
6.1.5)SMPEEM
Software maintenance size is discussed and the software maintenance project effort estimation model
(SMPEEM) is proposed. The SMPEEM uses function points to calculate the volume of the maintenance
function
E = 0.054 × FP 1.353
SMPEEM (5)
6.1.6)Matson, Barnett and Mellichamp model
A scatter-plot of the data (Fig. 5(a)) suggests that a linearrelationship is present and we fit our initial model,
E = 585.7 + 15.12 FP (2)
where the developmental effort is given in work-hours. Matson, Barrett and Mellichamp model [8] develop a
software cost estimation model using function points
E = 585.7 + 15.12 FP Matson, Barnett and Mellichamp model (6)
.
6.1.7)COCOMO ESTIMATION MODEL
The COCOMO is the most complete and thoroughlydocumented model used in effort estimation. The
modelprovides detailed formulae for determining the developmenttime schedule, overall development effort,
effort breakdownby phase and activity, as well as maintenance effort. Themodel is developed in three versions
of different levels ofdetail: basic, intermediate and detailed. The overallmodelling process has three classes of
systems:Embedded: This class of systems is characterised by tightconstraints, changing environment and
unfamiliarsurroundings. Eg: aerospace,medicineetc.Organic: This category includes all the systems that
aresmall relative to project size and team size, and have astable environment, familiar surroundings and
relaxedinterfaces. These are simple business systems, dataprocessing systems and small libraries.Semi-detached:
The software systems under this categoryare a mix of those of organic and embedded nature. Someexamples of
software of this class are operating systems,database management systems and inventory
managementsystems.B. The Constructive Cost Model (COCOMO)The Constructive Cost Model (COCOMO) is
the well-knownsoftware effort estimation model based on regressiontechniques. The COCOMO model was](https://image.slidesharecdn.com/i02095568-130910044137-phpapp01/85/Comparison-of-available-Methods-to-Estimate-Effort-Performance-and-Cost-with-the-Proposed-Method-7-320.jpg)
![Comparison Ofavailable Methods To Estimate Effort, Performance And Cost With The Proposed
www.ijeijournal.com Page | 62
proposed by BarryBoehm in 1981[2] and it is one of the most cited, best known,widely used and the most
plausible of all proposed effortestimation methods. The COCOMO model uses to calculate theamount of effort
then based on the calculated effort it makestime, cost and number of staff estimates for software
projects.COCOMO 81 was the first and stable model on that time.COCOMO II, was proposed and developed to
solve most of theCOCOMO 81 problems. The Post-Architecture Level ofCOCOMO II uses 17 cost drivers that
they presents projectattributes, programmer abilities, developments tools. The cost drivers and scale factors for
COCOMO II arerated on a scale from Very Low to Extra High in the same wayas in COCOMO 81.
A is the Multiplicative Constant, Size is the Size of the software measures in terms of KSLOC
(thousands of Source Lines of Code, Function Points or Object Points).The scale factors (SF) are based on a
significant source of exponential variation on a project‟s effort or productivity variation.
6.1.8) COCOMO 81(Intermediate COCOMO)
COCOMO 81 (Constructive Cost Model) is an empirical estimation scheme proposed in 1981 [29] as a
model forestimating effort, cost, and schedule for software projects. These formulae link the size of the system
and Effort Multipliers (EM) to find the effort to develop a software system. In COCOMO 81, effort is expressed
as Person Months (PM) and it can be calculated as
PM = a * Sizeb * ∑EMi
where,“a” and “b” are the domain constants in the model. It contains 15 effort multipliers. This estimation
scheme accounts the experience and data of the past projects, which is extremely complex to understand and
apply the same.
Cost drives have a rating level that expresses the impact ofthe driver on development effort, PM. These
rating can rangefrom Extra Low to Extra High. For the purpose of quantitative analysis, each rating level of
each cost driver has a weight associated with it. The weight is called Effort Multiplier. The average EM
assigned to a cost driver is 1.0 and the rating level associated with that weight is called Nominal.
6.1.9) COCOMO II
In 1997, an enhanced scheme for estimating the effort for software development activities, which is
called as COCOMOII. In COCOMO II, the effort requirement can be calculated as:
Effort = A * [SIZE]B
* ∏ EFFORT Multiplier
I=1 to 17
Where B = 1.01 + 0.01 * ∑ SCALE FACTOR
J= 1 to 5
Cost drives are used to capture characteristics of the software development that affect the effort to
complete the project.COCOMO II used to predict effort and time and this larger number of parameters resulted
in having strong co-linearity and highly variable prediction accuracy. This model uses LOC (Lines of Code) as
one of the estimation variables. The COCOMO also uses FP (Function Point) as one of the estimationvariables.
COCOMO II models are still influencing in the effortestimation activities due to their better accuracy compared
to other estimation schemes.
7.Proposed effort and cost estimation process in the author‟s new approach
To compute Albrecht‟s FPs, the following relationship is used
FP = count-total X [0.65 + 0.01 X Σ Fi]
where count total is the sum of all FP entries as shown above,The Fi (i= 1 to14) have VAF. The 0.65 and 0.01
are empirically derived constants. The constant values in (1) and the weighing factors that areapplied to
information domain counts are determined empirically.
The proposed method presents a set of primary metrics and the mode to calculate the Lines of code,
Function point and Person month are also discussed in the first layer. In the middle layer a fuzzy based
proposed model for effort estimation is discussed, the enhancements proposed is grouping the fourteen GSCs
into groups, first group is “System complexity” which consist of Data communication Complexity, Distributed
Data Processing Complexity, Performance Complexity and Heavily used configuration Complexity, the average
of the four weighted scores together gives the System complexity. Second group is “I/O complexity” which
consist of Transaction rate Complexity, Online data entry Complexity, End user efficiency Complexity and](https://image.slidesharecdn.com/i02095568-130910044137-phpapp01/85/Comparison-of-available-Methods-to-Estimate-Effort-Performance-and-Cost-with-the-Proposed-Method-8-320.jpg)
![Comparison Ofavailable Methods To Estimate Effort, Performance And Cost With The Proposed
www.ijeijournal.com Page | 64
I/O Complexity
Transaction rate 2 3
On-line data entry 5 3
End User Efficiency 3 4
On-line update 0 3
Application Complexity
Complex Processing 0 2
Reusability 0 3
Installation Ease 2 3
Operational Ease 5 3
Multiple sites 0 3
Facilitate Change 0 4
Quality Complexity
Quality of requirements
(for our model)
1 0.5
FP Estimated = Count total x [0.65 + 0.01 x Σ(Fi)]
FP Estimated for Existing (Hospital application) = 125 x [0.65 + 0.01*103.75] = 103.75
FP
FP Estimated for Existing (HR) = 88 x [0.65 + 0.01 * 40] = 92.4 FP
FP for the Proposed model (Hospital application) = 125 x [0.65 + 0.01*4.91] = 87.39 FP
FP for the Proposed model (HR) = 88 x [0.65 + 0.01 * 9.0] = 65.12
Assuming Productivity for VB/Oracle is 15hrs/Function Point
Effort for the Existing model (Using Hospital application) is 1556.25 person hours
Effort for the Existing model (HR) is 1386 person hours
Effort for the proposed model (Hospital application) is 1310 person hours
Effort for the proposed model (HR) is 976.8 person hours
Assuming a person works for 8.5hrs/day and 22 days a month, the effort obtained for the existing and
proposed are:
Effort for Hospital application in person month is 8 approximately.
Effort for HR in person month is 8 approximately.
Effort from the proposed model for Hospital application in person month is 7 approximately.
Effort from the proposed model for HR in person month is 7 approximately.
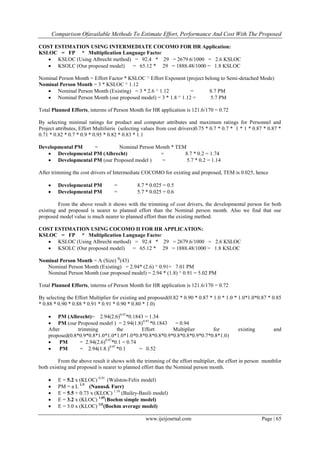
3. Cost Estimation for HR application using Intermediate COCOMO:
Table 3:Planned effort for HR application
Table of planned effort for HR application
Analysis Phase 3 3.648
Design Phase 9 10.944
Construction Phase 39 47.424
Testing 27 32.832
Project Planning 4 4.864
Project tracking 4 4.864
Software Quality
Assurance
1 1.216
Configuration
Management
3 3.648
Project Documentation 2 2.432
Reviews 6 7.296
Training 1 1.216
Inter group coordinal 1 1.216
100 121.6](https://image.slidesharecdn.com/i02095568-130910044137-phpapp01/85/Comparison-of-available-Methods-to-Estimate-Effort-Performance-and-Cost-with-the-Proposed-Method-10-320.jpg)
![Comparison Ofavailable Methods To Estimate Effort, Performance And Cost With The Proposed
www.ijeijournal.com Page | 66
E = 2.8 x (KLOC) 1.20
(Boehm complex model)
E = 5.288 x (KLOC)1.047
(Doty model).
Table 4: Effort Estimation using Albrecht‟s FP and Proposed FP
Effort Estimation
Different model for Effort
Estimation using LOC
Using Albrecht’s FP Author’s Proposed FP
Walston-Felix 12.41 8.88
Nanus& Farr 8.38 5.80
Bailey-Basili 7.71 6.94
Boehm simple 8.73 5.93
Boehm average 8.75 5.56
Boehm complex 8.81 5.67
Doty model 14.38 9.79
Existing FP-oriented Estimation/Cost models From the Literature
Se = Cte(Ktd)0.5
SEER-SEM ESTIMATION MODEL
E = 12.39 + 0.0545 FP Albrecht and Gaffney model
E = −37 + 0.96 FP Kemerer model
LOC = c K 0.3
T 1.3
Putnam model
E = 0.054 × FP 1.353
SMPEEM
E = 585.7 + 15.12 FP Matson, Barnett and Mellichamp model
PM = a * Sizeb * ∑ EMi Intermediate COCOMO
Effort = A * [SIZE]B
* ∏ EFFORT Multiplier COCOMO II
I=1 to 17
Where B = 1.01 + 0.01 * ∑ SCALE FACTOR
J= 1 to 5
Table 5: Cost Estmation Using Albrecht‟s FP and Proposed FP
Cost Estimation
Different model for Cost
Estimation using FP
Using Albrecht’s FP Author’s Proposed FP
Albrecht and Gaffney model 17.37 15.91
Kemerer model 51.7 25.52
SMPEEM 24.66 15.36
Matson, Barnett and
Mellichamp
1982.788 1570.31
Intermediate COCOMO 1.74 (0.72is planned effort) 1.14 (0.72 is planned effort)
With trimmered cost drivers
of Intermediate COCOMO
0.5 (0.72is planned effort) 0.6 (0.72is planned effort)
COCOMO II 1.34(0.72is planned effort) 0.94(0.72is planned effort)
With trimmered Effort
Multiplier of COCOMO II
0.74(0.72is planned effort) 0.52(0.72is planned effort)
Performance Measurement Indicators for Hospital and HR Application(39)
Table 6: VAF and FP for the Existing and Proposed Applications
Performance
Indicators
Hospital Application HR Application
Existing Proposed Existing Proposed
VAF 18 06 1.05 0.735
FP 104FP 89FP 92.4FP 64.68FP
Effort Estimation 8.0 7.0 8.0 7.0
Project Duration 158days 136 days 163 days 141 days
Schedule
Predictability
-10.2%
(underrun)
-11.6%
(underrun)
-7.4%
(underrun)
-8.4%
(underrun)
Requirements
Completion Ratio
75% 75% 87.5% 87.5%
Post-Release
Defect Density
3.8 per 100 FP 3.3 per l00 FP 4.3 4.3 per 100 FP 3.1 per 100 FP](https://image.slidesharecdn.com/i02095568-130910044137-phpapp01/85/Comparison-of-available-Methods-to-Estimate-Effort-Performance-and-Cost-with-the-Proposed-Method-12-320.jpg)
![Comparison Ofavailable Methods To Estimate Effort, Performance And Cost With The Proposed
www.ijeijournal.com Page | 67
VIII. Conclusion & Future Scope
The grouping of the 14 GSC into groups is to simplify the counting process and reduces the probability
of errors while counting; this enhanced system focuses on minimizing the effort by enhancing the adjustments
made to the functional sizing techniques. In the existing systems, the effort and cost estimation are more
concentrated on the development of software systems and not much on the quality coverage. Hence, the
proposed model ensures the quality assurance for the effort estimation. This paper presents fuzzy classification
techniques as a basis for constructing quality models. Empirical validation for software development effort
multipliers of COCOMO II model is analyzed and the ratings for the cost drivers are defined. By adding new
ratings to the cost drivers and scale factors and seeing that the characteristic behaviour is not altered, the
developmental person month of our proposed model is obtained, and also the effort multipliers of Intermediate
COCOMO model is analyzed and the ratings for the cost drivers are defined. By adding new ratings to the cost
drivers and seeing that the characteristic behaviour is not altered, the developmental person month of our
proposed model is obtained. It is observed that the effort estimated with COCOMO II and Intermediate
COCOMO are very much nearer to their respective planned efforts; with our proposed cost model minimal
effort variance can be achieved by predicting the cost drivers for computing the EAF.
The software size is the most important factor that affects the software cost. There are mainly two types
of software size metrics they are LOC and FPs. LOC is a natural artefact that measures software physical size
but it is usually not available until the coding phase and difficult to have the same definition across different
programming languages and paper presents that FP is an ideal software size metric to estimate cost since it can
be obtained in the early development phase. Hence this type of Estimation may be recommended for the
software development. In this paper we have also altered the ratings of the cost drivers of the COCOMO II and
intermediate COCOMO and by adding the new rating the existing characteristic of the model is not altered. By
tailoring the value of the cost drivers, the total effort multiplier is obtained. From the enhanced adjustment
factor, the altered rating of the cost driver, Scale Factors, Effort and Schedule Constants, the effort of the
software project in person month is obtained. It is found that the obtained person month is very much nearer to
the planned effort. In this paper the obtained Albrecht‟s FP and Authors FP for HR application are given to the
available LOC and FP oriented models and comparative analysis is done.
References
[1]. SaleemBasha, Dhavachelvan.P. “Analysis of Empirical Software Effort Estimation Models” (IJCSIS) International Journal of
Computer Science and Information Security, Vol. 7, No. 3, 2010.
[2]. Jorgen MSjoberg D.I.K, “The Impact of Customer Expectation on Software Development Effort Estimates”International Journal
ofProject Management, Elsevier, pp 317-325, 2004.
[3]. Chiu NH, Huang SJ, “The Adjusted Analogy-Based Software Effort Estimation Based on Similarity Distances,” Journal of Systems
and Software, Volume 80, Issue 4, pp 628-640, 2007.
[4]. Kaczmarek J, Kucharski M, “Size and Effort Estimation for Applications Written in Java,” Journal of Information and Software
Technology, Volume 46, Issue 9, pp 589-60, 2004
[5]. Jeffery R, RuheM,Wieczorek I, “Using Public Domain Metrics to Estimate Software Development Effort,” In Proceedings of the 7th
International Symposium on Software Metrics, IEEE Computer Society, Washington, DC, pp 16–27, 2001
[6]. Heiat A, “Comparison of Artificial Neural Network and Regression Models for Estimating Software Development Effort,” Journal
of Information and Software Technology, Volume 44, Issue 15, pp 911- 922, 2002.
[7]. K. Srinivasan and D. Fisher, "Machine learning approaches to estimating software development effort," IEEE Transactions on
Software Engineering, vol. 21, pp. 126-137, 1995.
[8]. A. R. Venkatachalam, "Software Cost Estimation Using Artificial Neural Networks," Presented at 1993 International Joint
Conference on Neural Networks, Nagoya, Japan, 1993.
[9]. G. H. Subramanian, P. C. Pendharkar, and M. Wallace, "An Empirical Study of the Effect of Complexity, Platform, and Program
Type on Software Development Effort of Business Applications,"Empirical Software Engineering, vol. 11, pp. 541-553, 2006.
[10]. R. W. Selby and A. A. Porter, "Learning from examples: generation and evaluation of decision trees for software resource analysis,"
IEEE Transactions on Software Engineering, vol. 14, pp. 1743-1757, 1988.
[11]. S. Kumar, B. A. Krishna, and P. S. Satsangi, "Fuzzy systems and neural networks in software engineering project
management,"Journal of Applied Intelligence, vol. 4, pp. 31-52, 1994.
[12]. Huang SJ, Lin CY, Chiu NH, “Fuzzy Decision Tree Approach forEmbedding Risk Assessment Information into Software Cost
Estimation Model,” Journal of Information Science and Engineering,Volume 22, Number 2, pp 297–313, 2006.
[13]. M. van Genuchten and H. Koolen, "On the Use of Software Cost Models," Information & Management, vol. 21, pp. 37-44, 1991.
[14]. T. K. Abdel-Hamid, "Adapting, Correcting, and Perfecting softwareestimates: Amaintenance metaphor " in Computer, vol. 26, pp.
20-29, 1993
[15]. K. Maxwell, L. Van Wassenhove, and S. Dutta, "Performance Evaluation of General and Company Specific Models in
SoftwareDevelopment Effort Estimation," Management Science, vol. 45, pp. 787-803, 1999.
[16]. H. Azath,and R.S.D. Wahidabanu “Efficient effort estimation system viz. function pointsand quality assurance coverage”IETSoftw.,
2012, Vol. 6, Iss. 4, pp. 335–341 335, doi: 10.1049/iet-sen.2011.0146.
[17]. Deng, J.D., Purvis, M.K., Purvis, M.A.: „Software effort estimation: harmonizing algorithms and domain knowledge in an
integrated data mining approach‟, Inf. Sci. Discuss. Pap. Ser., 2009, 2009, (5), pp. 1–13
[18]. Idri, A., Khoshgoftaar, T.M., Abran, A.: „Can neural networks be easilyinterpreted in software cost estimation?‟. 2002 World
Congress on Computational Intelligence, Honolulu, Huwaii, 12–17May 2002, pp. 1–8.
[19]. Mittal, H., Bhatia, P.: „A comparative study of conventional effort estimation and fuzzy effort estimation based on triangular fuzzy
numbers‟, Int. J. Comput. Sci. Secur., 2002, 1, (4), pp. 36–47](https://image.slidesharecdn.com/i02095568-130910044137-phpapp01/85/Comparison-of-available-Methods-to-Estimate-Effort-Performance-and-Cost-with-the-Proposed-Method-13-320.jpg)
![Comparison Ofavailable Methods To Estimate Effort, Performance And Cost With The Proposed
www.ijeijournal.com Page | 68
[20]. Benton, A., Bradly, M.: „The International Function Point User Group(IFPUG)‟, in „Function point counting practices manual –
release 4.1‟(SA, 1999).
[21]. Aljahdali, S., Sheta,A.F.: „Software effort estimation by tuning COOCMOmodel parameters using differential evolution‟. Int. Conf.
on Computer Systems and Applications (AICCSA), 16–19 May 2010, pp.1-6.
[22]. Boehm, B.W.: „Software engineering economics‟ (Prentice Hall,Englewood Cliffs, NJ, 1981).
[23]. Peischl, B., Nica, M., Zanker, M., Schmid, W.: „Recommending effort estimation methods for software project management‟. Proc.
IEEE/WIC/ACM Int. Conf. on Web Intelligence and Intelligent AgentTechnology, Milano, Italy, 2009, vol. 3, pp. 77–80
[24]. B.W. Boehm, “Software Engineering Economics,” Prentice Hall, 1981.
[25]. B.W. Boehm, E. Horowitz, R. Madachy, D. Reifer, B. K. Clark, B.Steece, A. W. Brown, S. Chulani, and C. Abts, “Software
CostEstimation with COCOMO II,” Prentice Hall, 2000.
[26]. F. J. Heemstra, "Software cost estimation," Information and Software Technology, vol. 34, pp. 627-639, 1992
[27]. N. Fenton, "Software Measurement: A necessary Scientific Basis,"IEEE Transactions on Software Engineering, vol. 20, pp. 199-
206, 1994.
[28]. Barry Boehma, Chris Abtsa andSunitaChulani, “Softwaredevelopment cost estimation approaches -A survey” Annals of Software
Engineering, pp 177-205, 2000.
[29]. James Nelson, H., Monarchi, D.E.: „Ensuring the quality of conceptual representations‟, Softw. Qual. J., 1997, 15, (2), pp. 213–233.
[30]. Khoshgoftaar, T.M., Allen, E.b., Naik, A., Jones, W.D., Hudepohl, J.P.:„Using classification trees for software quality models:
lessons learned‟,Int. J. Softw. Eng. Knowl. Eng., 1999, 9, (2), pp. 217–231
[31]. Kitchenham, B.A.: „Cross versus within-company cost estimation studies:a systematic review‟, IEEE Trans. Softw. Eng., 2007, 33,
(5), pp. 316–329
[32]. Hannay, J.E., Sjøberg, D.I.K., Dyba, T.: „A systematic review of theory use in software engineering experiments‟, Softw. – Pract.
Exper., 2007,33, (2), pp. 87–107
[33]. Jack E. Matson, Bruce E. Barrett, and Joseph M. Mellichamp, “Software Development Cost Estimation Using Function Points”
IEEE TRANSACTIONS ON SOFTWARE ENGINEERING, VOL. 20, NO. 4, APRIL 1994
[34]. CHRIS F. KEMERER “An Empirical Validation of Software Cost Estimation Models”
[35]. Putnam. L.H. General empirical solution to the macro software sizing estimating problem. IEEE Trans. Soffw. Eng. SE 4, 4 (July
1978), 345-361.
[36]. Putnam. L.. and Fitzsimmons, A. Estimating software costs. Datamation 25, lo-12 (Sept.-Nov. 1979)
[37]. B Boehm, C Abts, and S Chulani. "Software Development Cost Estimation Approaches – A Survey”, Technical Report USC-CSE-
2000-505", University of Southern California – Center for Software Engineering, USA, (2000).
[38]. S. chulani, B. Boehm, and B. Steece, “Bayesian Analysis of Emperical Software Engineering Cost Models,‟ IEEE Trans. Software
Eng., vol.25, no. 4, pp.573-583, 1999.
[39]. M.Pauline, P.Aruna and B.Shadaksharappa “Fuzzy-Base Approach Using Enhanced Function Point to Evaluate the Performance of
Software Project”, The IUP Journal of Computer Sciences, Vol. VI, No. 2, 2012.
[40]. Pauline.M, Aruna.P, Shadaksharappa.B, “Software Cost Estimation Model based on Proposed Function Point and Trimmed Cost
Drivers Using Cocomo II” (IJERT) International Journal of Engineering Research & Technology, Vol. 1 Issue 5,July–2012.
[41]. Pauline.M, Aruna.P, Shadaksharappa.B, “Layered Model to Estimate Effort, Performance and Cost of the Software Projects”
International Journal of Computer Applications, Vol. 63, No. 13,2013.
[42]. YunsikAhn, JungseokSuh, Seungryeol Kim and Hyunsoo Kim, “The Software maintenance project effort estimation model based
on function points” J. Softw. Maint. Evol.: Res. Pract. 2003; 15:71–85 (DOI: 10.1002/smr.269).
[43]. Barry Boehm, “COCOMO II Model Definition Manual”Version 1.4 - Copyright University of Southern California.](https://image.slidesharecdn.com/i02095568-130910044137-phpapp01/85/Comparison-of-available-Methods-to-Estimate-Effort-Performance-and-Cost-with-the-Proposed-Method-14-320.jpg)
This paper presents a novel software effort and cost estimation model that incorporates quality assurance through fuzzy logic techniques. The authors propose enhancements to existing function point analysis by grouping general system characteristics and adjusting factors to improve accuracy in estimates. A comparative study demonstrates the model's effectiveness against traditional methods, showcasing its applicability in hospital and HR application case studies.
![Review on cost estimation technque for web application [part 1]](https://cdn.slidesharecdn.com/ss_thumbnails/reviewoncostestimationtechnqueforwebapplicationpart1-150817143144-lva1-app6891-thumbnail.jpg?width=640&height=640&fit=bounds)