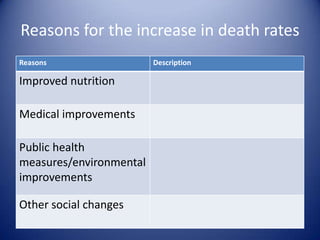
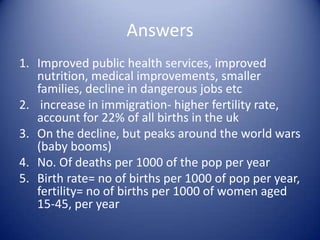
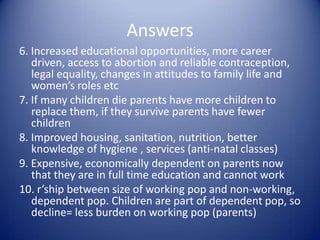
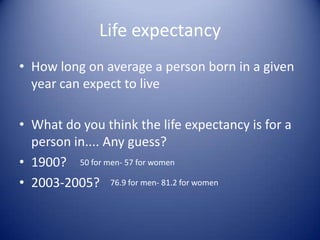
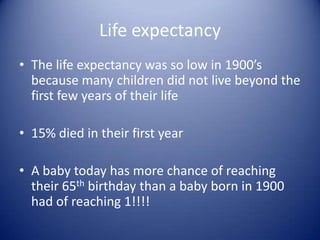
Demographics since 1900We will be looking at the changes in birth rates and death ratesUnderstand reasons why these are both in declineInvestigating life expectancy and the ‘AGEING’ population
Demography Is the study of populations and their characteristics-Size- is the population large or small? Growing or declining?Age structure- is the average age of the population rising or falling?
What causes a rise in the size of our population?What causes a decline in the size of our population?
What factors affect the country’s population?Increase= births and immigration (enter country) Decrease= deaths and emigration (exit country)ImmigrationEmigration
Key termsBirth rate= number of births per 1000 of the population over a yearFertility rate= number of births per 1000 women aged 15 to 44 over a yearDeath rate= number of deaths per 1000 of the population over a year
Births Look at the graph on page 48, what has happened to the birth rate since 1900?
Birth ratesLong term declineBUT.....Baby booms!!- What do you think was the reason for the first two baby booms?
Reasons for the decline in birth ratesChanges in the position of womenDecline in the infant mortality rate Children have become an economic assetChild Centredness
Task In groups of 3 you will each become an expert in one reason for the decline in birth rate...Expert 1= changes in the position of womenExpert 2= decline in IMRExpert 3= children have become an economic liability AND child centrednessYou will have 10 minutes to read up, make notes and prepare your reason, ready to teach to the rest of your group
 Future trends in birth rates Generally, there has been a decline in birth ratesBUT ...... (AO2)Since 2001 there has been a slight increase in birthsWhy? Increase in immigration= women from outside UK have higher fertility rates
How would the changes in birth rates impact on the family and public services/policies?
Effects of changes in fertilityThe familySmaller families means women are more likely to be free to go to work= dual earner couplePublic servicesFewer schools, child health and maternity services neededEffects of changes in fertilityDependency ratio = r’ship between working (independent) and non-working (dependent) parts of the populationChildren = dependent on the earnings and taxes of their parents (working population!)Less children= “ reduces the burden of dependency”
Death ratesIn the UK, the death rate has fallen (halved) since 1900However, there have been fluctuations:What significant events may have accounted for rises in death rates in the 1900’s?
Reasons for the increase in death rates
Quiz State three reasons for the decline in death rate (3)Why has there been a slight increase in births since 2001 (1)What are the trends for birth rate and death rate in the UK, since 1900? (2)Define death rate (2)What is the difference between birth rate and fertility rate? (2)
Quiz 6. State 2 reasons why changes in the position of women has led to a decline in birth rate (2)7. Why does a fall in IMR lead to a decrease in birth rate? (1)8. State two reasons for the fall in IMR (2)9. Why have children become a liability? (2)10.What is the dependency ratio and how does a decline in birth rate affect this? (4)/21
Answers Improved public health services, improved nutrition, medical improvements, smaller families, decline in dangerous jobs etc increase in immigration- higher fertility rate, account for 22% of all births in the ukOn the decline, but peaks around the world wars (baby booms)No. Of deaths per 1000 of the pop per yearBirth rate= no of births per 1000 of pop per year, fertility= no of births per 1000 of women aged 15-45, per year
Answers 6. Increased educational opportunities, more career driven, access to abortion and reliable contraception, legal equality, changes in attitudes to family life and women’s roles etc7. If many children die parents have more children to replace them, if they survive parents have fewer children8. Improved housing, sanitation, nutrition, better knowledge of hygiene , services (anti-natal classes)9. Expensive, economically dependent on parents now that they are in full time education and cannot work10. r’ship between size of working pop and non-working, dependent pop. Children are part of dependent pop, so decline= less burden on working pop (parents)
Life expectancy How long on average a person born in a given year can expect to liveWhat do you think the life expectancy is for a person in.... Any guess?1900?2003-2005?50 for men- 57 for women76.9 for men- 81.2 for women
Life expectancy The life expectancy was so low in 1900’s because many children did not live beyond the first few years of their life15% died in their first yearA baby today has more chance of reaching their 65th birthday than a baby born in 1900 had of reaching 1!!!!
Class, gender and regional differencesFemales live longer than malesPeople in the south live longer than people in the north- why?Middle class live longer than working class- why?
What do these diagrams tell us about the age profile in the UK overtime?1901					2005					80+80+60-7960-7940-5940-5920-3920-390-190-19
......The ageing populationThe average age of the UK population is rising1971= 34.12007= 39.6We now have more older people, while younger groups are shrinking!!Why do we have an ageing population? =increased life expectancy, decreased birth/fertility rates
Effects of an Ageing populationHow does the increase in old people effect public services and the dependency ratio?
Effects of an ageing populationPublic services use services such as NHS and social care services more
Increased expenditure on services such as, housing (old people’s homes), transport (free bus pass)Effects of an ageing populationDependency ratioEconomically dependent on working group (through taxes)
Economic burden
BUT age of retirement is rising- so old people are not always economically dependent!Policy implicationsProblem= “how do we finance a longer period of old age?”Hirsh (2005)- “ a number of social policies need to change in order to tackle problems faced by an ageing population!”Pay more into pension schemesIncrease retirement age – educational resourcesChanges in housing policy- trade down into smaller houses/retirement houses
Old age can be seen as a social construct- shaped and defined by society

SociologyExchange.co.uk Shared Resource

  • 1.
    Demographics since 1900Wewill be looking at the changes in birth rates and death ratesUnderstand reasons why these are both in declineInvestigating life expectancy and the ‘AGEING’ population
  • 2.
    Demography Is thestudy of populations and their characteristics-Size- is the population large or small? Growing or declining?Age structure- is the average age of the population rising or falling?
  • 3.
    What causes arise in the size of our population?What causes a decline in the size of our population?
  • 4.
    What factors affectthe country’s population?Increase= births and immigration (enter country) Decrease= deaths and emigration (exit country)ImmigrationEmigration
  • 5.
    Key termsBirth rate=number of births per 1000 of the population over a yearFertility rate= number of births per 1000 women aged 15 to 44 over a yearDeath rate= number of deaths per 1000 of the population over a year
  • 6.
    Births Look atthe graph on page 48, what has happened to the birth rate since 1900?
  • 7.
    Birth ratesLong termdeclineBUT.....Baby booms!!- What do you think was the reason for the first two baby booms?
  • 8.
    Reasons for thedecline in birth ratesChanges in the position of womenDecline in the infant mortality rate Children have become an economic assetChild Centredness
  • 9.
    Task In groupsof 3 you will each become an expert in one reason for the decline in birth rate...Expert 1= changes in the position of womenExpert 2= decline in IMRExpert 3= children have become an economic liability AND child centrednessYou will have 10 minutes to read up, make notes and prepare your reason, ready to teach to the rest of your group
  • 10.
    Future trendsin birth rates Generally, there has been a decline in birth ratesBUT ...... (AO2)Since 2001 there has been a slight increase in birthsWhy? Increase in immigration= women from outside UK have higher fertility rates
  • 11.
    How would thechanges in birth rates impact on the family and public services/policies?
  • 12.
    Effects of changesin fertilityThe familySmaller families means women are more likely to be free to go to work= dual earner couplePublic servicesFewer schools, child health and maternity services neededEffects of changes in fertilityDependency ratio = r’ship between working (independent) and non-working (dependent) parts of the populationChildren = dependent on the earnings and taxes of their parents (working population!)Less children= “ reduces the burden of dependency”
  • 13.
    Death ratesIn theUK, the death rate has fallen (halved) since 1900However, there have been fluctuations:What significant events may have accounted for rises in death rates in the 1900’s?
  • 14.
    Reasons for theincrease in death rates
  • 15.
    Quiz State threereasons for the decline in death rate (3)Why has there been a slight increase in births since 2001 (1)What are the trends for birth rate and death rate in the UK, since 1900? (2)Define death rate (2)What is the difference between birth rate and fertility rate? (2)
  • 16.
    Quiz 6. State2 reasons why changes in the position of women has led to a decline in birth rate (2)7. Why does a fall in IMR lead to a decrease in birth rate? (1)8. State two reasons for the fall in IMR (2)9. Why have children become a liability? (2)10.What is the dependency ratio and how does a decline in birth rate affect this? (4)/21
  • 17.
    Answers Improved publichealth services, improved nutrition, medical improvements, smaller families, decline in dangerous jobs etc increase in immigration- higher fertility rate, account for 22% of all births in the ukOn the decline, but peaks around the world wars (baby booms)No. Of deaths per 1000 of the pop per yearBirth rate= no of births per 1000 of pop per year, fertility= no of births per 1000 of women aged 15-45, per year
  • 18.
    Answers 6. Increasededucational opportunities, more career driven, access to abortion and reliable contraception, legal equality, changes in attitudes to family life and women’s roles etc7. If many children die parents have more children to replace them, if they survive parents have fewer children8. Improved housing, sanitation, nutrition, better knowledge of hygiene , services (anti-natal classes)9. Expensive, economically dependent on parents now that they are in full time education and cannot work10. r’ship between size of working pop and non-working, dependent pop. Children are part of dependent pop, so decline= less burden on working pop (parents)
  • 19.
    Life expectancy Howlong on average a person born in a given year can expect to liveWhat do you think the life expectancy is for a person in.... Any guess?1900?2003-2005?50 for men- 57 for women76.9 for men- 81.2 for women
  • 20.
    Life expectancy Thelife expectancy was so low in 1900’s because many children did not live beyond the first few years of their life15% died in their first yearA baby today has more chance of reaching their 65th birthday than a baby born in 1900 had of reaching 1!!!!
  • 21.
    Class, gender andregional differencesFemales live longer than malesPeople in the south live longer than people in the north- why?Middle class live longer than working class- why?
  • 22.
    What do thesediagrams tell us about the age profile in the UK overtime?1901 2005 80+80+60-7960-7940-5940-5920-3920-390-190-19
  • 23.
    ......The ageing populationTheaverage age of the UK population is rising1971= 34.12007= 39.6We now have more older people, while younger groups are shrinking!!Why do we have an ageing population? =increased life expectancy, decreased birth/fertility rates
  • 24.
    Effects of anAgeing populationHow does the increase in old people effect public services and the dependency ratio?
  • 25.
    Effects of anageing populationPublic services use services such as NHS and social care services more
  • 26.
    Increased expenditure onservices such as, housing (old people’s homes), transport (free bus pass)Effects of an ageing populationDependency ratioEconomically dependent on working group (through taxes)
  • 27.
  • 28.
    BUT age ofretirement is rising- so old people are not always economically dependent!Policy implicationsProblem= “how do we finance a longer period of old age?”Hirsh (2005)- “ a number of social policies need to change in order to tackle problems faced by an ageing population!”Pay more into pension schemesIncrease retirement age – educational resourcesChanges in housing policy- trade down into smaller houses/retirement houses
  • 29.
    Old age canbe seen as a social construct- shaped and defined by society