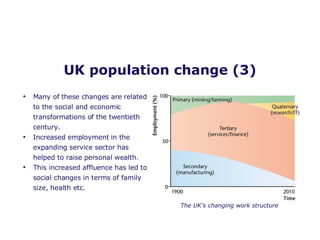
The document discusses trends in the UK population including aging, immigration, and regional shifts. Some key points:
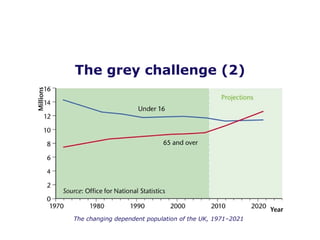
- The proportion of over-60s is expected to rise significantly, increasing the dependency ratio and challenging the economy.
- Immigration has helped offset population aging but its future impact is uncertain.
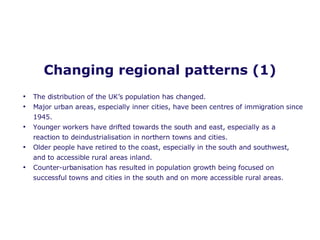
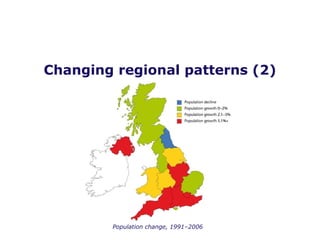
- Younger workers have moved to southern and eastern regions while older residents settle in coastal and rural areas.
- The upcoming decades will see the large "baby boom" generation retire, placing greater burden on a smaller working-age population to support them. Careful planning is needed to address this challenge.


![Getting Started with Apache Spark: Big Data Made Simple [Free Meetup]](https://cdn.slidesharecdn.com/ss_thumbnails/apachesparkgettingstarted-260203175547-8361bcc3-thumbnail.jpg?width=640&height=640&fit=bounds)