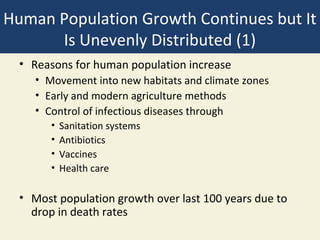
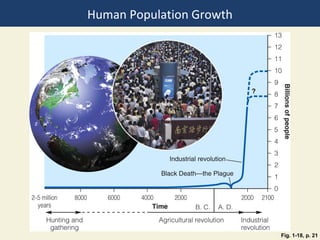
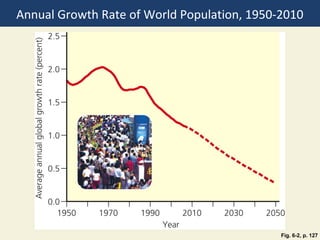
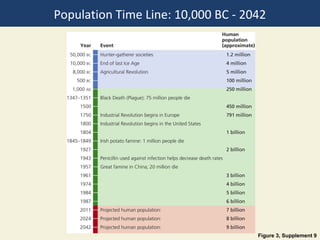
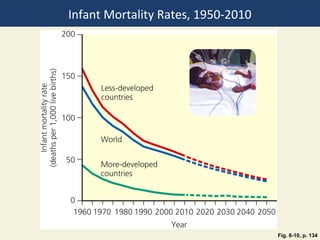
1. The human population has grown rapidly over the last century due to declining death rates from improvements in health, sanitation and medicine.
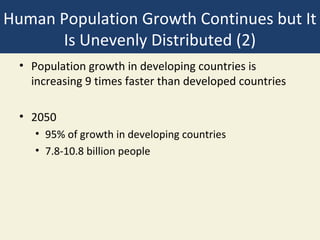
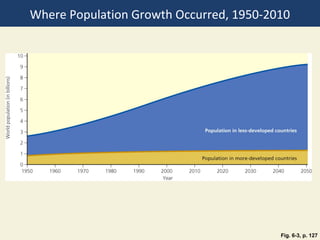
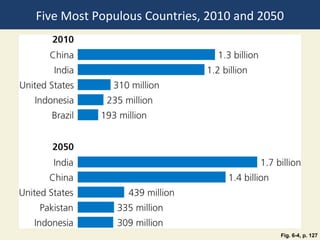
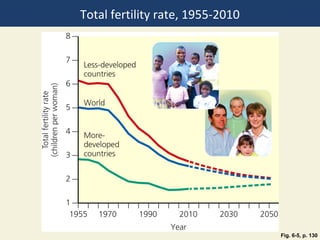
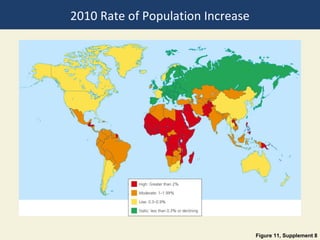
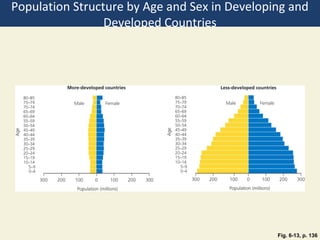
2. Population growth is increasing much faster in developing countries, projected to rise from 7.8-10.8 billion people by 2050 with 95% of growth occurring in developing nations.
3. Slowing population growth requires empowering women through education and jobs, expanding access to family planning, and reducing poverty through economic development.
Population growth in developing countries is increasing 9 times faster than developed countries by 2050
95% of growth in developing countries and will probably reach 7.5-10.8 billion people
Carrying capacity is the maximum population that a given area can sustain.
Carrying capacity of human is the maximum number of people who could live in reasonable freedom and comfort indefinitely, without decreasing the ability of the earth to sustain future generations.
Population growth in developing countries is increasing 9 times faster than developed countries by 2050
95% of growth in developing countries and will probably reach 7.5-10.8 billion people
Carrying capacity is the maximum popul
Demographic transition in India and its effectsSarinkumar P S
Population expansion around the world has shown a pattern of rapid increase, again stabilization and very small increase or decline after that. This trend is conceptualized as demographic transition. In the following presentation we will look at:
1. PopulationDynamics
2. Demographictransitiontheory
3. PatternofDemographictransitionacrosstheworld
4. DemographictransitioninIndia
5. EffectsofdemographictransitioninIndia
*Since India is overpopulated there going to be more unemployment and scarcity of resources. It’ll get harder to feed all those people, since there aren’t enough resources for all the people.
*If we want to get rid of overpopulation, we must give all the citizens better education on the sexual grounds and create laws that forbid a family to have more than one child.
A Strategic Approach: GenAI in EducationPeter Windle
Artificial Intelligence (AI) technologies such as Generative AI, Image Generators and Large Language Models have had a dramatic impact on teaching, learning and assessment over the past 18 months. The most immediate threat AI posed was to Academic Integrity with Higher Education Institutes (HEIs) focusing their efforts on combating the use of GenAI in assessment. Guidelines were developed for staff and students, policies put in place too. Innovative educators have forged paths in the use of Generative AI for teaching, learning and assessments leading to pockets of transformation springing up across HEIs, often with little or no top-down guidance, support or direction.
This Gasta posits a strategic approach to integrating AI into HEIs to prepare staff, students and the curriculum for an evolving world and workplace. We will highlight the advantages of working with these technologies beyond the realm of teaching, learning and assessment by considering prompt engineering skills, industry impact, curriculum changes, and the need for staff upskilling. In contrast, not engaging strategically with Generative AI poses risks, including falling behind peers, missed opportunities and failing to ensure our graduates remain employable. The rapid evolution of AI technologies necessitates a proactive and strategic approach if we are to remain relevant.
How to Make a Field invisible in Odoo 17Celine George
It is possible to hide or invisible some fields in odoo. Commonly using “invisible” attribute in the field definition to invisible the fields. This slide will show how to make a field invisible in odoo 17.
Palestine last event orientationfvgnh .pptxRaedMohamed3
An EFL lesson about the current events in Palestine. It is intended to be for intermediate students who wish to increase their listening skills through a short lesson in power point.
Operation “Blue Star” is the only event in the history of Independent India where the state went into war with its own people. Even after about 40 years it is not clear if it was culmination of states anger over people of the region, a political game of power or start of dictatorial chapter in the democratic setup.
The people of Punjab felt alienated from main stream due to denial of their just demands during a long democratic struggle since independence. As it happen all over the word, it led to militant struggle with great loss of lives of military, police and civilian personnel. Killing of Indira Gandhi and massacre of innocent Sikhs in Delhi and other India cities was also associated with this movement.
Model Attribute Check Company Auto PropertyCeline George
In Odoo, the multi-company feature allows you to manage multiple companies within a single Odoo database instance. Each company can have its own configurations while still sharing common resources such as products, customers, and suppliers.
Macroeconomics- Movie Location
This will be used as part of your Personal Professional Portfolio once graded.
Objective:
Prepare a presentation or a paper using research, basic comparative analysis, data organization and application of economic information. You will make an informed assessment of an economic climate outside of the United States to accomplish an entertainment industry objective.
Welcome to TechSoup New Member Orientation and Q&A (May 2024).pdfTechSoup
In this webinar you will learn how your organization can access TechSoup's wide variety of product discount and donation programs. From hardware to software, we'll give you a tour of the tools available to help your nonprofit with productivity, collaboration, financial management, donor tracking, security, and more.
Acetabularia Information For Class 9 .docxvaibhavrinwa19
Acetabularia acetabulum is a single-celled green alga that in its vegetative state is morphologically differentiated into a basal rhizoid and an axially elongated stalk, which bears whorls of branching hairs. The single diploid nucleus resides in the rhizoid.
2024.06.01 Introducing a competency framework for languag learning materials ...Sandy Millin
http://sandymillin.wordpress.com/iateflwebinar2024
Published classroom materials form the basis of syllabuses, drive teacher professional development, and have a potentially huge influence on learners, teachers and education systems. All teachers also create their own materials, whether a few sentences on a blackboard, a highly-structured fully-realised online course, or anything in between. Despite this, the knowledge and skills needed to create effective language learning materials are rarely part of teacher training, and are mostly learnt by trial and error.
Knowledge and skills frameworks, generally called competency frameworks, for ELT teachers, trainers and managers have existed for a few years now. However, until I created one for my MA dissertation, there wasn’t one drawing together what we need to know and do to be able to effectively produce language learning materials.
This webinar will introduce you to my framework, highlighting the key competencies I identified from my research. It will also show how anybody involved in language teaching (any language, not just English!), teacher training, managing schools or developing language learning materials can benefit from using the framework.
2. Human Population Growth Continues but It
Is Unevenly Distributed (1)
• Reasons for human population increase
• Movement into new habitats and climate zones
• Early and modern agriculture methods
• Control of infectious diseases through
• Sanitation systems
• Antibiotics
• Vaccines
• Health care
• Most population growth over last 100 years due to
drop in death rates
3. Human Population Growth Continues but It
Is Unevenly Distributed (2)
• Population growth in developing countries is
increasing 9 times faster than developed countries
• 2050
• 95% of growth in developing countries
• 7.8-10.8 billion people
10. The Human Population Can Grow,
Decline, or Remain Fairly Stable
• Population change
• Births: fertility
• Deaths: mortality
• Migration
• Population change =
(births + immigration) – (deaths + emigration)
• Crude birth rate: # live births/1000/year
• Crude death rate: # deaths/1000/year
11. Women Having Fewer Babies but Not Few
Enough to Stabilize the World’s Population
• Fertility rate
• number of children born to a woman during her
lifetime
• Replacement-level fertility rate
• Average number of children a couple must have to
replace themselves
• 2.1 in developed countries
• Up to 2.5 in developing countries
• Total fertility rate (TFR)
• Average number of children born to women in a
population
17. Several Factors Affect Birth Rates and
Fertility Rates (1)
• Children as part of the labor force-have more kids to
bring in more income
• Cost of raising and educating children-lower rates in
areas where it costs more
• Availability of private and public pension-pensions reduce
the need to have lots of kids to care for them in old age
• Urbanization-urban areas have lower birth rates
• Educational and employment opportunities for women-
those with access to education and employment tend to
have lower birth rates
18. Several Factors Affect Birth Rates and
Fertility Rates (2)
• Average age of a woman at birth of first child
• Availability of legal abortions
• Availability of reliable birth control methods
• Religious beliefs, traditions, and cultural norms
21. Several Factors Affect Death Rates (1)
• Life expectancy
• Infant mortality rate
• Number of live births that die in first year
• Why are people living longer?
• Increased food supply and distribution
• Better nutrition
• Medical advances
• Improved sanitation
22. Several Factors Affect Death Rates (2)
• U.S. is 54th in world for infant mortality rate
• U.S. infant mortality rate high due to
• Inadequate health care for poor women during
pregnancy and their infants
• Drug addiction among pregnant women
• High birth rate among teenagers
25. Migration Affects an Area’s Population
Size
• Economic improvement
• Religious freedom
• Political freedom
• Wars
• Environmental refugees
26. A Population’s Age Structure Helps Us
Make Projections
• Age structure categories
• Prereproductive ages (0-14)
• Reproductive ages (15-44)
• Postreproductive ages (45 and older)
• Seniors are the fastest-growing age group
29. Populations Made Up of Mostly Older
People Can Decline Rapidly
• Slow decline
• Manageable
• Rapid decline
• Severe economic problems
• How pay for services for elderly
• Proportionally fewer young people working
• Labor shortages
• Severe social problems
30. Empowering Women Can Slow
Population Growth
• Factors that decrease total fertility rates:
• Education
• Paying jobs
• Ability to control fertility
• Women
• Do most of the domestic work and child care
• Provide unpaid health care
• 2/3 of all work for 10% of world’s income
• Discriminated against legally and culturally
32. Promote Family Planning
• Family planning in less-developed countries
• Responsible for a 55% drop in TFRs
• Financial benefits: money spent on family planning
saves far more in health, education costs
• Two problems
1. 42% pregnancies unplanned, 26% end with abortion
2. Many couples do not have access to family planning
33. Three Big Ideas
1. The human population is increasing rapidly and may soon
bump up against environmental limits.
2. Even if population growth were not a serious problem,
the increasing use of resources per person is expanding
the overall human ecological footprint and putting a strain
on the earth’s resources.
3. We ccan slow population growth by reducing poverty
through economic development, elevating the status of
women, and encouraging family planning.
Editor's Notes
Figure 1.18: Exponential growth: The J-shaped curve represents past exponential world population growth, with projections to 2100 showing possible population stabilization as the J-shaped curve of growth changes to an S-shaped curve. (This figure is not to scale.) (Data from the World Bank and United Nations, 2008; photo L. Yong/UNEP/Peter Arnold, Inc.)
6-2
Figure 6.3: Most of the world’s population growth between 1950 and 2010 took place in the world’s less-developed countries. This gap is projected to increase between 2010 and 2050. (Data from United Nations Population Division, The 2008 Revision and Population Reference Bureau, 2010 World Population Data Sheet )
Figure 6.4: This chart shows the populations of the world’s five most populous countries in 2010 and 2050 (projected). In 2010, more than one of every three persons on the earth lived in China (with 19% of the world’s population) or India (with 17%). (Data from United Nations Population Division)
Figure 6.B: This list describes eight major ways in which we humans have altered natural systems to meet our growing population’s resource needs and wants ( Concept 6-1 ). See an animation based on this figure at CengageNOW. Questions: Which three of these impacts do you believe have been the most harmful? Explain. How does your lifestyle contribute directly or indirectly to each of these harmful impacts?
Figure 6.5: This graph tracks the total fertility rate for both the more-developed and less-developed regions of the world, 1955–2010, with projections to 2050 (based on medium population projections). Although the world’s average TFR has dropped to 2.5, it will have to drop to around 2.1 to eventually halt the world’s population growth. (Data from United Nations Population Division)
Figure 6.6: The top graph shows the total fertility rates for the United States between 1917 and 2010 and the bottom graph shows the country’s birth rate between 1917 and 2010. Question: The U.S. fertility rate has declined and remained at or below replacement levels since 1972. So why is the population of the United States still increasing? (Data from Population Reference Bureau and U.S. Census Burea u)
Figure 6.7: This chart lists some major changes that took place in the United States between 1900 and 2000. Question: Which two of these changes do you think were the most important? (Data from U.S. Census Bureau and Department of Commerce )
Figure 6.8: This girl is carrying well water across parched earth that has dried out and cracked during a severe drought in India.
Figure 6.9: These young girls are child laborers in the state of Rajasthan in India. They are weaving wool on looms to make carpets for export, and receive very little money for their work.
Figure 6.10: This graph tracks the infant mortality rates for the world’s more-developed countries and less-developed countries, 1950–2010, with projections to 2050 based on medium population projections. (Data from United Nations Population Division)
Figure 6.12: This chart represents the generalized population age-structure diagrams for countries with rapid (1.5–3%), slow (0.3–1.4%), zero (0–0.2%), and negative (declining) population growth rates. A population with a large proportion of its people in the prereproductive age group (far left) has a significant potential for rapid population growth. See an animation based on this figure at CengageNOW. Question: Which of these diagrams best represents the country where you live? (Data from Population Reference Bureau)
Figure 6.13: Global outlook: These charts illustrate population structure by age and sex in less-developed countries and more-developed countries for 2010. Question: If all girls under 15 were to have only one child during their lifetimes, how do you think these structures would change over time? (Data from United Nations Population Division and Population Reference Bureau)
Figure 6.20: These women from a village in the West African country of Burkina Faso are bringing home fuelwood. Typically, they spend two hours a day, two or three times a week, searching for and hauling fuelwood.