Download to read offline


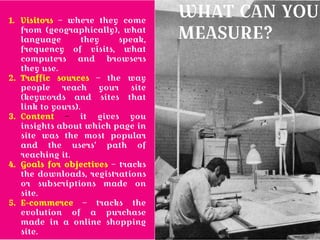


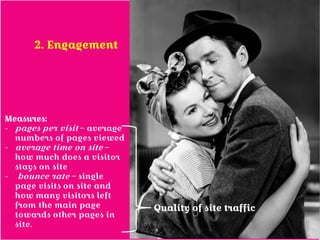


This document discusses how to use Google Analytics to measure website traffic and performance. It explains that Google Analytics requires setting up an account and implementing JavaScript tracking code on website pages. It then outlines key metrics that can be measured like visitors, traffic sources, content performance, goals and conversions. The three core metrics are acquisition, engagement, and outcomes. Various features of Google Analytics are also described like keywords clouds, real-time data, dashboards, and multi-channel funnels. Tips for improving a website based on analytics data are provided at the end.


