Download to read offline


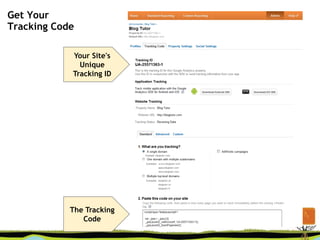
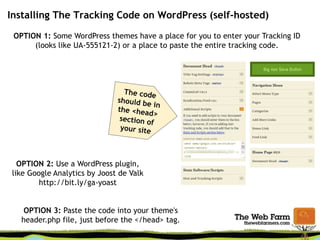
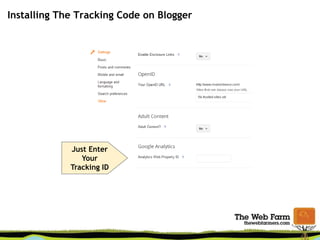
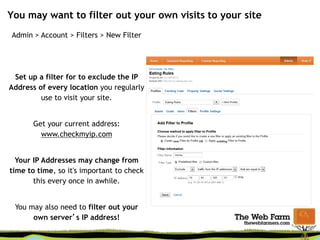
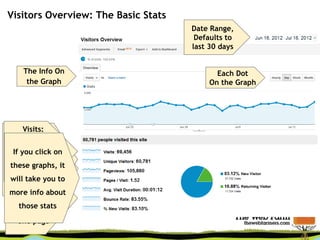
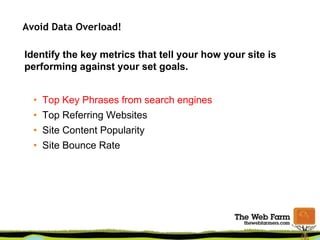

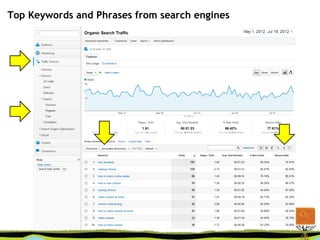


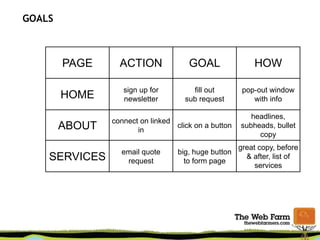
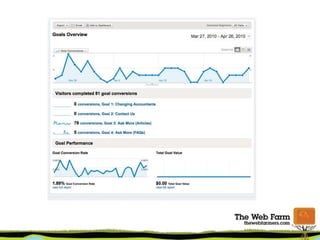
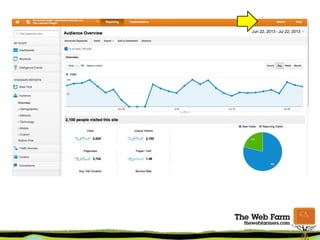
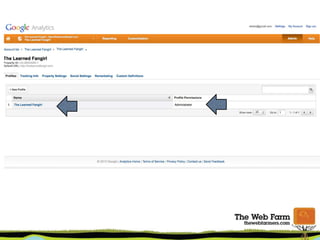
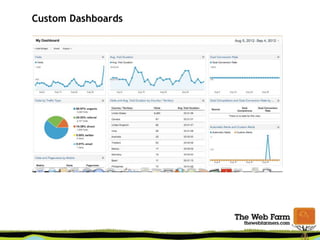
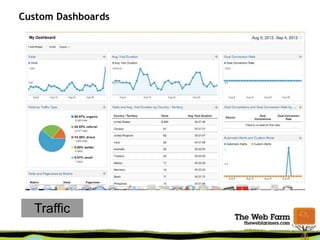


The document provides an overview of using Google Analytics for small businesses. It covers key metrics to measure like top keywords, referring websites, content popularity and bounce rate. It discusses setting up accounts and tracking codes, as well as setting up goals and conversions. Additional topics include new vs returning visitors, custom dashboards, and resources for learning more about Google Analytics.


![[Webinar] Advanced Google Analytics](https://cdn.slidesharecdn.com/ss_thumbnails/webinargoogleanalyticsbychristinasanders-170328183539-thumbnail.jpg?width=640&height=640&fit=bounds)


