Download to read offline


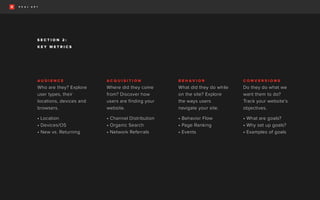
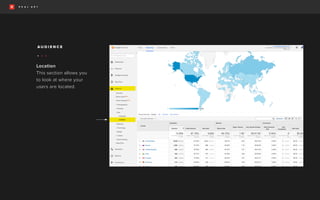
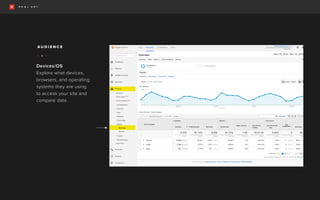
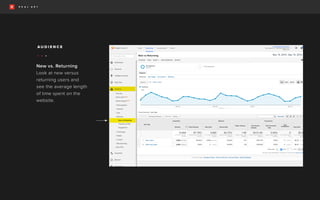
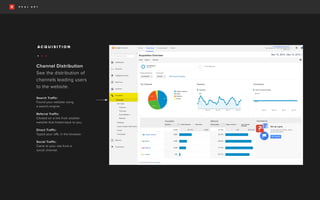
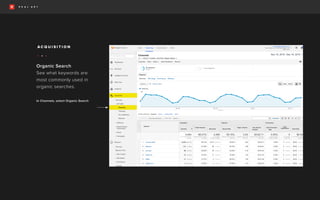
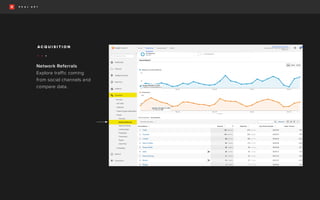
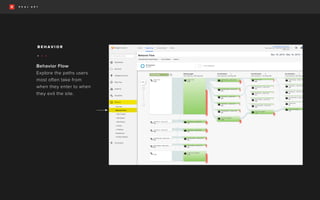


This presentation covers using Google Analytics to measure website success through key metrics such as audience, acquisition, behavior, and conversions. It discusses setting goals, reviewing weekly metrics like traffic, landing pages, and conversion rates, and looking at directional insights rather than exact numbers. Sample reports are provided on audience geography and devices, acquisition sources, user behavior flows, and goal examples like newsletter signups. Key terms are defined and resources listed.


![Public Relations 2.0 by Niel Robertson [Metrics Marketing Bootcamp]](https://cdn.slidesharecdn.com/ss_thumbnails/pr2-0presentation-110210162553-phpapp01-thumbnail.jpg?width=640&height=640&fit=bounds)


