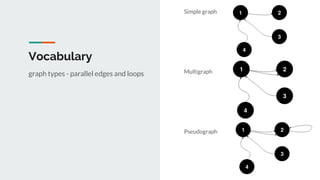
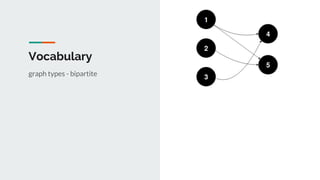
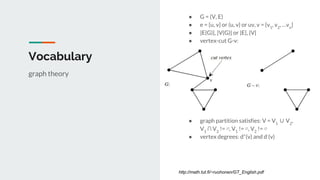
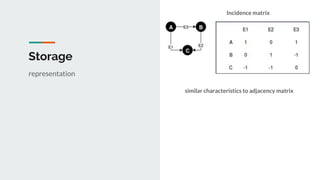
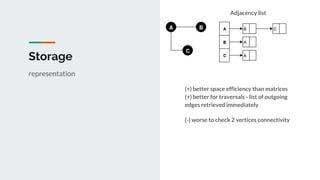
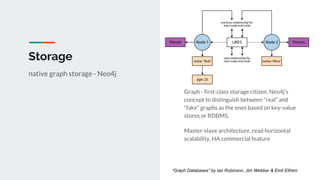
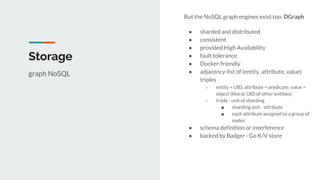
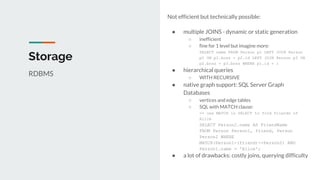
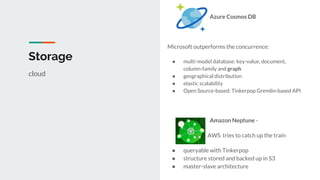
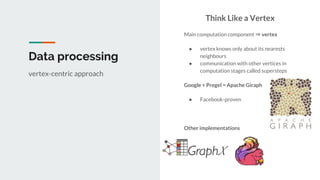
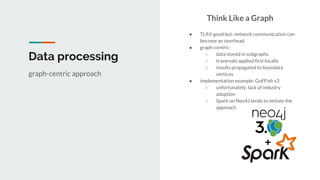
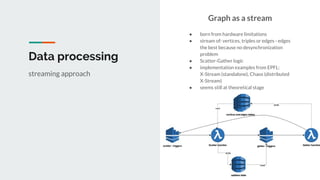
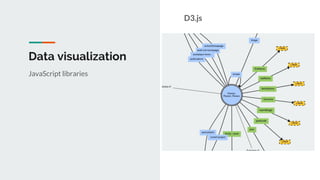
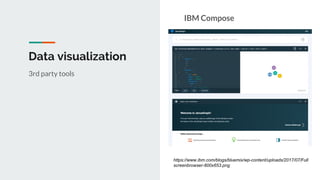
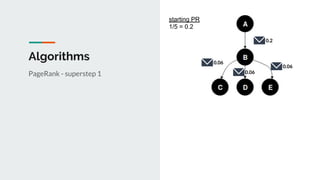
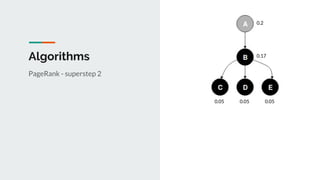
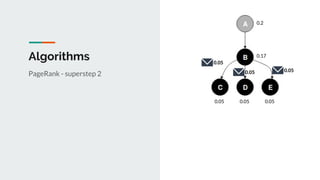
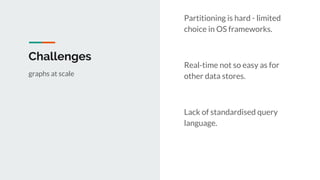
Graphs - going distributed
vertices, edges, degrees, properties… in the Big Data era
Plan
1. Vocabulary
2. Storage
3. Ad-hoc analysis
4. Data processing
5. Data visualization
6. Algorithms
7. Challenges
Vocabulary
fundamentals
Vocabulary
Undirected graph
Directed graph
graph types - direction
Vocabulary
Acyclic
Cyclic
graph types - cycles
Vocabulary
Labeled graph
graph types - labels
Vocabulary
Simple graph
Multigraph
Pseudograph
graph types - parallel edges and loops
Vocabulary
graph types - bipartite
Vocabulary
● G = (V, E)
● e = {u, v} or (u, v) or uv, v = {v1
, v2
, …vn
}
● |E(G)|, |V(G)| or |E|, |V|
● vertex-cut G-v:
●
●
●
●
●
●
● s
●
●
● graph partition satisfies: V = V1
∪ V2
,
V1
∩ V2
!= ∅, V1
!= ∅, V2
!= ∅
● vertex degrees: d+
(v) and d-
(v)
graph theory
http://math.tut.fi/~ruohonen/GT_English.pdf
Storage
Adjacency matrix
representation
(+) easy to check vertices connectivity
(+) easy to add or remove vertices
(-) not space efficient
(-) traversal execution
Storage
Incidence matrix
representation
similar characteristics to adjacency matrix
Storage
Adjacency list
representation
(+) better space efficiency than matrices
(+) better for traversals - list of outgoing
edges retrieved immediately
(-) worse to check 2 vertices connectivity
Storage
Edge table
representation
https://docs.microsoft.com/en-us/sql/relational-databases/graphs/media/
person-friends-tables.png?view=sql-server-2017
Storage
Index-free adjacency list
representation (+) natural graph data representation
(+) traversal time is always N
(-) inefficient with vertex-to-vertex
connectivity checks
(-) writing is hard for supernodes
(-) horizontal scalability is not easy
Storage
Graph - first-class storage citizen. Neo4j’s
concept to distinguish between “real” and
“fake” graphs as the ones based on key-value
stores or RDBMS.
Master-slave architecture, read horizontal
scalability, HA commercial feature
native graph storage - Neo4j
“Graph Databases” by Ian Robinson, Jim Webber & Emil Eifrem
Storage
NoSQL data stores used as a persistence
layer.
NoSQL - on top of other types
https://docs.janusgraph.org/latest/images/architecture-layer-diagram.svg
But the NoSQL graph engines exist too: DGraph
● sharded and distributed
● consistent
● provided High Availability
● fault tolerance
● Docker-friendly
● adjacency-list of (entity, attribute, value)
triples
○ entity = UID, attribute = predicate, value =
object (literal, UID of other entities)
○ triple - unit of sharding
■ sharding unit - attribute
■ each attribute assigned to a group of
nodes
● schema definition or interference
● backed by Badger - Go K/V store
Storage
graph NoSQL
Not efficient but technically possible:
● multiple JOINS - dynamic or static generation
○ inefficient
○ fine for 1 level but imagine more:
SELECT name FROM Person p1 LEFT JOIN Person
p2 ON p1.boss = p2.id LEFT JOIN Person p3 ON
p2.boss = p3.boss WHERE p1.id = 1
● hierarchical queries
○ WITH RECURSIVE
● native graph support: SQL Server Graph
Databases
○ vertices and edge tables
○ SQL with MATCH clause:
-- use MATCH in SELECT to find friends of
Alice
SELECT Person2.name AS FriendName
FROM Person Person1, friend, Person
Person2 WHERE
MATCH(Person1-(friend)->Person2) AND
Person1.name = 'Alice';
● a lot of drawbacks: costly joins, querying difficulty
Storage
RDBMS
Storage
Azure Cosmos DB
Microsoft outperforms the concurrence:
● multi-model database: key-value, document,
column-family and graph
● geographical distribution
● elastic scalability
● Open Source-based: Tinkerpop Gremlin-based API
Amazon Neptune -
AWS tries to catch up the train
● queryable with Tinkerpop
● structure stored and backed up in S3
● master-slave architecture
cloud
Storage
FlockDB
● aka: horizontally scaling relational database
● graph reduced to “edges between nodes” table
● not maintained anymore
big graph players - Twitter
https://blog.twitter.com/content/dam/blog-twitter/archive/it_s_in_the_c
oud96.thumb.1280.1280.png
Storage
TAO
● aka: “The Associations and Objects”
● large collection of geographically distributed server
clusters
● persistent storage with memory cachebig graph players - Facebook
https://scontent-cdg2-1.xx.fbcdn.net/v/t1.0-9/s720x720/1016494_1
0151647749827200_1788611608_n.png?_nc_cat=106&_nc_ht=sc
ontent-cdg2-1.xx&oh=6c17fc682408be59f3a4718b34200324&oe=
5C4FFAA6
Ad-hoc analysis
Cypher
● natural representation of graphs in query
language
○ expresses graph traversal
○ applies to simple and more complex
cases
● limited to Neo4J
Any edges between node1 and node2
MATCH (node1)-->(node2)
Users with more than 10 friends
MATCH (user)-[:FRIEND]-(friend) WHERE
user.name = $name WITH user,
count(friend) AS friends WHERE
friends > 10 RETURN user
Edge creation with a property
CREATE (worker)-[:WORKS_FORY {since:
2018}]->(company)
query languages
Ad-hoc analysis
Gremlin
● less SQL-friendly
● DSL
● OLTP and OLAP
● vendor-agnostic
Every vertex with the code property equals to
‘AUS’
g.V().has('code','AUS').valueMap(true
).unfold()
Every vertex with ‘airport’ label grouped by a
country
g.V().hasLabel('airport').groupCount(
).by('country')
Traversal result partial output
g.V().has('code','SAF').repeat(out())
.emit().path().by('code').limit(10)
query languages
Ad-hoc analysis
GraphQL +-
● DGraph proposal
● inspired from GraphQL
● query = nested blocks starting with a query
root
● more a JSON document than a query
All nodes with “jones indiana” in name
{
me(func: allofterms(name@en, "jones
indiana")) {
name@en
genre {
name@en
}
}
}
query languages
Data processing
going distributed
Data processing
Think Like a Vertex
Main computation component ⇒ vertex
● vertex knows only about its nearests
neighbours
● communication with other vertices in
computation stages called supersteps
Google + Pregel = Apache Giraph
● Facebook-proven
Other implementations
vertex-centric approach
Data processing
Think Like a Graph
● TLAV good but: network communication can
become an overhead
● graph-centric:
○ data stored in subgraphs
○ traversals applied first locally
○ results propagated to boundary
vertices
● implementation example: GoFFish v3
○ unfortunately: lack of industry
adoption
○ Spark on Neo4J tends to imitate the
approach
graph-centric approach
Data processing
Graph as a stream
● born from hardware limitations
● stream of: vertices, triples or edges - edges
the best because no desynchronization
problem
● Scatter-Gather logic
● implementation examples from EPFL:
X-Stream (standalone), Chaos (distributed
X-Stream)
● seems still at theoretical stage
streaming approach
Data visualization
D3.js
JavaScript libraries
Data visualization
Sigma.js
JavaScript libraries
Data visualization
Alchemy.js
JavaScript libraries
Data visualization
Neo4J console
databases UIs
Data visualization
DGraph Ratel
databases UIs
https://user-images.githubusercontent.com/4924405/34387959-6d224
cd2-eb31-11e7-9169-9d23cc1e6405.png
Data visualization
Cytoscape
3rd party tools
http://manual.cytoscape.org/en/stable/_images/sampleOriginal.png
Data visualization
Linkurious
3rd party tools
https://linkurio.us/wp-content/uploads/2015/09/czech-ehealth-ecosyst
em.png
Data visualization
IBM Compose
3rd party tools
https://www.ibm.com/blogs/bluemix/wp-content/uploads/2017/07/Full
screenbrowser-800x653.png
Algorithms
PageRank
● problem of authority of vertices in the graph
● math formula:
PR(v) = (0.15/N+0.85) * Sum PR(vin)/L(vin)
● used for: recommendation systems
(TwitterRank, ItemRank), anomaly detection,
authority detection (BooRank), prediction and
much more
Algorithms
PageRank - superstep 1
starting PR
1/5 = 0.2
0.2
0.06
0.06
0.06
Algorithms
PageRank - superstep 1
0.17
0.2
0.050.050.05
Algorithms
PageRank - superstep 2
0.17
0.2
0.050.050.05
Algorithms
PageRank - superstep 2
0.17
0.2
0.050.050.05
0.050.05
0.05
Algorithms
PageRank - superstep 3
0.17
0.2
0.040.040.04
Challenges
Partitioning is hard - limited
choice in OS frameworks.
Real-time not so easy as for
other data stores.
Lack of standardised query
language.
graphs at scale
Thank you
Questions ?

Distributed graph processing

  • 1.
    Graphs - goingdistributed vertices, edges, degrees, properties… in the Big Data era
  • 2.
    Plan 1. Vocabulary 2. Storage 3.Ad-hoc analysis 4. Data processing 5. Data visualization 6. Algorithms 7. Challenges
  • 3.
  • 4.
  • 5.
  • 6.
  • 7.
  • 8.
  • 9.
    Vocabulary ● G =(V, E) ● e = {u, v} or (u, v) or uv, v = {v1 , v2 , …vn } ● |E(G)|, |V(G)| or |E|, |V| ● vertex-cut G-v: ● ● ● ● ● ● ● s ● ● ● graph partition satisfies: V = V1 ∪ V2 , V1 ∩ V2 != ∅, V1 != ∅, V2 != ∅ ● vertex degrees: d+ (v) and d- (v) graph theory http://math.tut.fi/~ruohonen/GT_English.pdf
  • 10.
    Storage Adjacency matrix representation (+) easyto check vertices connectivity (+) easy to add or remove vertices (-) not space efficient (-) traversal execution
  • 11.
  • 12.
    Storage Adjacency list representation (+) betterspace efficiency than matrices (+) better for traversals - list of outgoing edges retrieved immediately (-) worse to check 2 vertices connectivity
  • 13.
  • 14.
    Storage Index-free adjacency list representation(+) natural graph data representation (+) traversal time is always N (-) inefficient with vertex-to-vertex connectivity checks (-) writing is hard for supernodes (-) horizontal scalability is not easy
  • 15.
    Storage Graph - first-classstorage citizen. Neo4j’s concept to distinguish between “real” and “fake” graphs as the ones based on key-value stores or RDBMS. Master-slave architecture, read horizontal scalability, HA commercial feature native graph storage - Neo4j “Graph Databases” by Ian Robinson, Jim Webber & Emil Eifrem
  • 16.
    Storage NoSQL data storesused as a persistence layer. NoSQL - on top of other types https://docs.janusgraph.org/latest/images/architecture-layer-diagram.svg
  • 17.
    But the NoSQLgraph engines exist too: DGraph ● sharded and distributed ● consistent ● provided High Availability ● fault tolerance ● Docker-friendly ● adjacency-list of (entity, attribute, value) triples ○ entity = UID, attribute = predicate, value = object (literal, UID of other entities) ○ triple - unit of sharding ■ sharding unit - attribute ■ each attribute assigned to a group of nodes ● schema definition or interference ● backed by Badger - Go K/V store Storage graph NoSQL
  • 18.
    Not efficient buttechnically possible: ● multiple JOINS - dynamic or static generation ○ inefficient ○ fine for 1 level but imagine more: SELECT name FROM Person p1 LEFT JOIN Person p2 ON p1.boss = p2.id LEFT JOIN Person p3 ON p2.boss = p3.boss WHERE p1.id = 1 ● hierarchical queries ○ WITH RECURSIVE ● native graph support: SQL Server Graph Databases ○ vertices and edge tables ○ SQL with MATCH clause: -- use MATCH in SELECT to find friends of Alice SELECT Person2.name AS FriendName FROM Person Person1, friend, Person Person2 WHERE MATCH(Person1-(friend)->Person2) AND Person1.name = 'Alice'; ● a lot of drawbacks: costly joins, querying difficulty Storage RDBMS
  • 19.
    Storage Azure Cosmos DB Microsoftoutperforms the concurrence: ● multi-model database: key-value, document, column-family and graph ● geographical distribution ● elastic scalability ● Open Source-based: Tinkerpop Gremlin-based API Amazon Neptune - AWS tries to catch up the train ● queryable with Tinkerpop ● structure stored and backed up in S3 ● master-slave architecture cloud
  • 20.
    Storage FlockDB ● aka: horizontallyscaling relational database ● graph reduced to “edges between nodes” table ● not maintained anymore big graph players - Twitter https://blog.twitter.com/content/dam/blog-twitter/archive/it_s_in_the_c oud96.thumb.1280.1280.png
  • 21.
    Storage TAO ● aka: “TheAssociations and Objects” ● large collection of geographically distributed server clusters ● persistent storage with memory cachebig graph players - Facebook https://scontent-cdg2-1.xx.fbcdn.net/v/t1.0-9/s720x720/1016494_1 0151647749827200_1788611608_n.png?_nc_cat=106&_nc_ht=sc ontent-cdg2-1.xx&oh=6c17fc682408be59f3a4718b34200324&oe= 5C4FFAA6
  • 22.
    Ad-hoc analysis Cypher ● naturalrepresentation of graphs in query language ○ expresses graph traversal ○ applies to simple and more complex cases ● limited to Neo4J Any edges between node1 and node2 MATCH (node1)-->(node2) Users with more than 10 friends MATCH (user)-[:FRIEND]-(friend) WHERE user.name = $name WITH user, count(friend) AS friends WHERE friends > 10 RETURN user Edge creation with a property CREATE (worker)-[:WORKS_FORY {since: 2018}]->(company) query languages
  • 23.
    Ad-hoc analysis Gremlin ● lessSQL-friendly ● DSL ● OLTP and OLAP ● vendor-agnostic Every vertex with the code property equals to ‘AUS’ g.V().has('code','AUS').valueMap(true ).unfold() Every vertex with ‘airport’ label grouped by a country g.V().hasLabel('airport').groupCount( ).by('country') Traversal result partial output g.V().has('code','SAF').repeat(out()) .emit().path().by('code').limit(10) query languages
  • 24.
    Ad-hoc analysis GraphQL +- ●DGraph proposal ● inspired from GraphQL ● query = nested blocks starting with a query root ● more a JSON document than a query All nodes with “jones indiana” in name { me(func: allofterms(name@en, "jones indiana")) { name@en genre { name@en } } } query languages
  • 25.
  • 26.
    Data processing Think Likea Vertex Main computation component ⇒ vertex ● vertex knows only about its nearests neighbours ● communication with other vertices in computation stages called supersteps Google + Pregel = Apache Giraph ● Facebook-proven Other implementations vertex-centric approach
  • 27.
    Data processing Think Likea Graph ● TLAV good but: network communication can become an overhead ● graph-centric: ○ data stored in subgraphs ○ traversals applied first locally ○ results propagated to boundary vertices ● implementation example: GoFFish v3 ○ unfortunately: lack of industry adoption ○ Spark on Neo4J tends to imitate the approach graph-centric approach
  • 28.
    Data processing Graph asa stream ● born from hardware limitations ● stream of: vertices, triples or edges - edges the best because no desynchronization problem ● Scatter-Gather logic ● implementation examples from EPFL: X-Stream (standalone), Chaos (distributed X-Stream) ● seems still at theoretical stage streaming approach
  • 29.
  • 30.
  • 31.
  • 32.
  • 33.
    Data visualization DGraph Ratel databasesUIs https://user-images.githubusercontent.com/4924405/34387959-6d224 cd2-eb31-11e7-9169-9d23cc1e6405.png
  • 34.
    Data visualization Cytoscape 3rd partytools http://manual.cytoscape.org/en/stable/_images/sampleOriginal.png
  • 35.
    Data visualization Linkurious 3rd partytools https://linkurio.us/wp-content/uploads/2015/09/czech-ehealth-ecosyst em.png
  • 36.
    Data visualization IBM Compose 3rdparty tools https://www.ibm.com/blogs/bluemix/wp-content/uploads/2017/07/Full screenbrowser-800x653.png
  • 37.
    Algorithms PageRank ● problem ofauthority of vertices in the graph ● math formula: PR(v) = (0.15/N+0.85) * Sum PR(vin)/L(vin) ● used for: recommendation systems (TwitterRank, ItemRank), anomaly detection, authority detection (BooRank), prediction and much more
  • 38.
    Algorithms PageRank - superstep1 starting PR 1/5 = 0.2 0.2 0.06 0.06 0.06
  • 39.
    Algorithms PageRank - superstep1 0.17 0.2 0.050.050.05
  • 40.
    Algorithms PageRank - superstep2 0.17 0.2 0.050.050.05
  • 41.
    Algorithms PageRank - superstep2 0.17 0.2 0.050.050.05 0.050.05 0.05
  • 42.
    Algorithms PageRank - superstep3 0.17 0.2 0.040.040.04
  • 43.
    Challenges Partitioning is hard- limited choice in OS frameworks. Real-time not so easy as for other data stores. Lack of standardised query language. graphs at scale
  • 44.