Download as PDF, PPTX

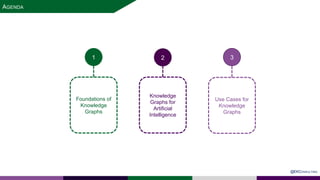
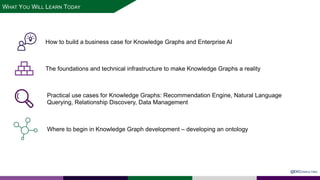

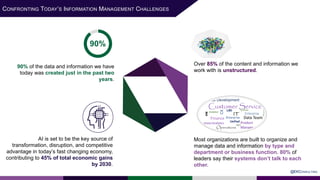
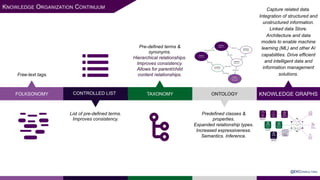
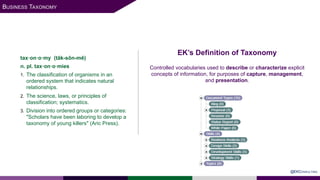

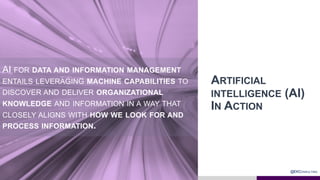
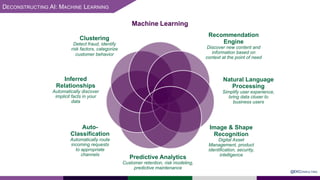
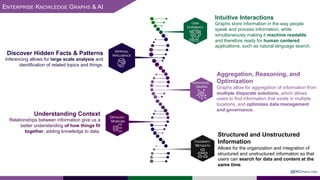


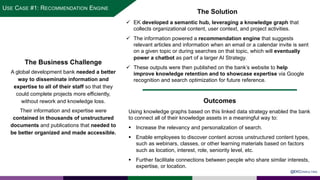
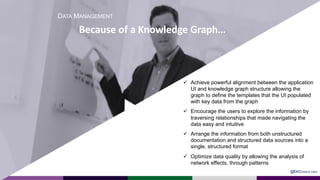


The presentation at Data Summit Connect 2020 focused on knowledge graphs, their foundations, and practical applications in artificial intelligence. It highlighted the importance of knowledge graphs in organizing structured and unstructured information, improving data management, and enabling advanced capabilities like natural language processing and recommendation engines. Use cases illustrated their value in sectors such as banking, supply chain, and federal agencies to enhance information dissemination, query efficiency, and relationship discovery.