SK hynix 000660-Algorithm Investment Report
•
0 likes•144 views

This document contains performance data and analysis for Algorithm company from 2014-2017. It includes key financial metrics such as sales, operating profit, net income, debt ratio, and EPS. It also shows the company's stock price history and compares it to sector averages. In addition, it provides an indication of the stock's future price range and recommends an amount to purchase.
![[Price for scheduled purchasing]
Arbitrarily made
Algorithm stocks Trading Strategies (consolidated) 000660 Date
Period
Gap
(Indication /
stock)
Color
low price 64,196 W 64,196 W ~ 0 W -23 % 462,996 W 7
Low mid 76,662 W 76,662 W ~ 64,196 W -8 % 157,684 W 2
Mid 89,127 W 89,127 W ~ 76,662 W 7 % -147,627 W -2
High mid 101,593 W 101,593 W ~ 89,127 W 22 % -452,938 W -4
Suggested Purchase
Amount 2,035,327 W
Number of stocks
purchased 24
Indication price Range Buying / Selling Buying / Selling [Stocks]
High price 114,058 W 114,058 W~ ~ 101,593 W 37 % -758,250 W -7
2017-10-16
3 months
Current stock price Evaluation
Stock price rise
probability score
Investment opinion Prospective purchase amount
83,100 W Mid 33.6 Normal 5,000,000 W
38.8 30.5 41.4 53.8 43.7 42.6
2017.05.16 2017.06.14 2017.07.12 2017.08.09 2017.09.07 2017.10.13
Stock price rise
probability score
A Sector 48.4 48.6 47.0 48.3 45.7 43.1
33.6B Sector 29.2 12.5 35.8 48.3 41.7 42.1
Total average
2017.07.12 2017.08.09 2017.09.07 2017.10.13
Total of
increase rate
Total score
A Sector 0 % -3 % 3 % -6 % -6 %
-1 % 47.0B Sector -133 % 65 % 26 % -16 % 1 %
Total average -27 % 26 % 23 % -23 % -3 %
2017.06.14
48 49 47 48 46 43
29
13
36
48
42 42
39
31
41
54
44 43
0
10
20
30
40
50
60
2017.05.16 2017.06.14 2017.07.12 2017.08.09 2017.09.07 2017.10.13
Stock price rise probability score
A sector
B sector
Total average
0% -3% 3% -6% -6%
-133%
65%
26%
-16%
1%
-27%
26% 23%
-23%
-3%
-150%
-100%
-50%
0%
50%
100%
2017.06.14 2017.07.12 2017.08.09 2017.09.07 2017.10.13
Increase rate of stock price rise
A sector
B sector
Total average
SK hynix](data:image/gif;base64,R0lGODlhAQABAIAAAAAAAP///yH5BAEAAAAALAAAAAABAAEAAAIBRAA7)
Recommended
Recommended
More Related Content
What's hot
What's hot (20)
Similar to SK hynix 000660-Algorithm Investment Report
Similar to SK hynix 000660-Algorithm Investment Report (20)
More from 알고리즘 기업분석 컨설팅-알기컨,algikeon
More from 알고리즘 기업분석 컨설팅-알기컨,algikeon (20)
Recently uploaded
Recently uploaded (20)
SK hynix 000660-Algorithm Investment Report
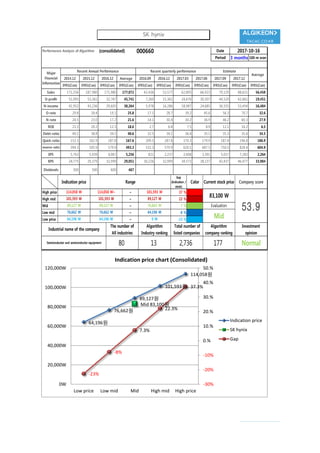
- 1. Performance Analysis of Algorithm (consolidated) 000660 Date Period 3 months 100-m won 2014.12 2015.12 2016.12 Average 2016.09 2016.12 2017.03 2017.06 2017.09 2017.12 IFRS(Con) IFRS(Con) IFRS(Con) IFRS(Con) IFRS(Con) IFRS(Con) IFRS(Con) IFRS(Con) IFRS(Con) IFRS(Con) IFRS(Con) Sales 171,256 187,980 171,980 177,072 42,436 53,577 62,895 66,923 79,129 88,631 56,458 O-profit 51,095 53,361 32,767 45,741 7,260 15,361 24,676 30,507 44,529 62,661 19,451 N-income 41,952 43,236 29,605 38,264 5,978 16,286 18,987 24,685 36,555 53,454 16,484 O-rate 29.8 28.4 19.1 25.8 17.1 28.7 39.2 45.6 56.3 70.7 32.6 N-rate 24.5 23.0 17.2 21.6 14.1 30.4 30.2 36.9 46.2 60.3 27.9 ROE 23.3 20.2 12.3 18.6 2.7 6.8 7.5 8.9 12.1 16.2 6.5 Debt-ratio 49.1 38.8 34.1 40.6 32.5 34.1 36.4 35.1 35.3 35.6 34.5 Quick-ratio 153.3 161.9 187.8 167.6 209.5 187.8 170.3 179.9 187.4 196.8 186.9 reserve-ratio 394.3 505.9 579.9 493.3 532.3 579.9 620.1 687.5 750.5 820.4 604.9 EPS 5,763 5,939 4,067 5,256 821 2,237 2,608 3,391 5,017 7,282 2,264 BPS 24,775 29,379 32,999 29,051 30,226 32,999 34,573 38,137 42,437 46,477 33,984 Dividends 300 500 600 467 Major Financial Information Recent Annual Performance Recent quarterly performance Estimate Average 2017-10-16 Gap (Indication / stock) Color High price ~ 37 % High mid ~ 22 % Mid ~ 7 % Low mid ~ -8 % Low price ~ -23 % Normal 64,196 W 64,196 W 0 W Industrial name of the company The number of All industries Algorithm Industry ranking Total number of listed companies Algorithm company ranking Investment opinion Semiconductor and semiconductor equipment 80 13 2,736 177 101,593 W 101,593 W 89,127 W 89,127 W 89,127 W 76,662 W Evaluation 114,058 W 114,058 W~ 101,593 W 83,100 W 53.976,662 W 76,662 W 64,196 W Mid Indication price Range Current stock price Company score 64,196원 76,662원 89,127원 101,593원 114,058원 Mid 83,100원 -23% -8% 7.3% 22.3% 37.3% -30% -20% -10% 0.% 10.% 20.% 30.% 40.% 50.% 0W 20,000W 40,000W 60,000W 80,000W 100,000W 120,000W Low price Low mid Mid High mid High price Indication price chart (Consolidated) Indication price SK hynix Gap SK hynix
- 2. [Price for scheduled purchasing] Arbitrarily made Algorithm stocks Trading Strategies (consolidated) 000660 Date Period Gap (Indication / stock) Color low price 64,196 W 64,196 W ~ 0 W -23 % 462,996 W 7 Low mid 76,662 W 76,662 W ~ 64,196 W -8 % 157,684 W 2 Mid 89,127 W 89,127 W ~ 76,662 W 7 % -147,627 W -2 High mid 101,593 W 101,593 W ~ 89,127 W 22 % -452,938 W -4 Suggested Purchase Amount 2,035,327 W Number of stocks purchased 24 Indication price Range Buying / Selling Buying / Selling [Stocks] High price 114,058 W 114,058 W~ ~ 101,593 W 37 % -758,250 W -7 2017-10-16 3 months Current stock price Evaluation Stock price rise probability score Investment opinion Prospective purchase amount 83,100 W Mid 33.6 Normal 5,000,000 W 38.8 30.5 41.4 53.8 43.7 42.6 2017.05.16 2017.06.14 2017.07.12 2017.08.09 2017.09.07 2017.10.13 Stock price rise probability score A Sector 48.4 48.6 47.0 48.3 45.7 43.1 33.6B Sector 29.2 12.5 35.8 48.3 41.7 42.1 Total average 2017.07.12 2017.08.09 2017.09.07 2017.10.13 Total of increase rate Total score A Sector 0 % -3 % 3 % -6 % -6 % -1 % 47.0B Sector -133 % 65 % 26 % -16 % 1 % Total average -27 % 26 % 23 % -23 % -3 % 2017.06.14 48 49 47 48 46 43 29 13 36 48 42 42 39 31 41 54 44 43 0 10 20 30 40 50 60 2017.05.16 2017.06.14 2017.07.12 2017.08.09 2017.09.07 2017.10.13 Stock price rise probability score A sector B sector Total average 0% -3% 3% -6% -6% -133% 65% 26% -16% 1% -27% 26% 23% -23% -3% -150% -100% -50% 0% 50% 100% 2017.06.14 2017.07.12 2017.08.09 2017.09.07 2017.10.13 Increase rate of stock price rise A sector B sector Total average SK hynix
- 3. 정보와 완전 정보 결 투자판단 있습니 위배 무단으 숙지하 Compliance notice ① The information provided by The Algorithm Company Analysis Consulting is obtained through reliable data and information and The Algorithm Company Analysis Program (TACAP), but its accuracy or completeness are not guaranteed. Furthermore, it may change over time.Therefore, we are not legally responsible for the results of the data provided by The Algorithm Company Analysis Consulting because of information errors or omissions. ② The Algorithm Company Analysis Consulting and all the information provided on it site are reference materials for investment decisions and the final responsibility of investment is up to users utilizing this information. ③ The Algorithm Company Analysis Consulting and its site do not do anything that violates the related laws such as discretionary transaction. ④ Users can not reallocate and recycle the information provided by The Algorithm Company Analysis Consulting firm let alone the information provided by its Site. ⑤ Be sure to know about application period of this algorithm analysis report in order to improve its accuracy. Tel : 070 - 4667 - 5009 Email : tacac@tacac.co.kr Homepage : tacac.co.kr Blog : tacac.blog.me Request : http://tacac.co.kr/?page_id=1374 ① Consulting The Algori accuracy o change ove results of Consulting ② informatio investmen up ③ do anythin transaction ④ The Algori informatio ⑤ analysis re