SHINSEGAEFOOD-031440-Algorithm Investment Report
•
0 likes•95 views

SHINSEGAEFOOD-031440-Algorithm Investment Report
![[Price for scheduled purchasing]
Arbitrarily made
Algorithm stocks Trading Strategies (consolidated) 031440 Date
Period
Gap
(Indication /
stock)
Color
low price 140,192 W 140,192 W ~ 0 W 9 % -529,733 W -4
Low mid 178,590 W 178,590 W ~ 140,192 W 39 % -2,269,416 W -13
Mid 216,987 W 216,987 W ~ 178,590 W 69 % -4,009,098 W -18
High mid 255,385 W 255,385 W ~ 216,987 W 99 % -5,748,781 W -23
Suggested Purchase
Amount 5,821,973 W
Number of stocks
purchased 45
Indication price Range Buying / Selling Buying / Selling [Stocks]
High price 293,782 W 293,782 W~ ~ 255,385 W 129 % -7,488,463 W All selling
2018-02-12
3 months
Current stock price Evaluation
Stock price rise
probability score
Investment opinion Prospective purchase amount
128,500 W Low price 66.2 Buy 10,000,000 W
39.7 44.7 45.8 28.8 37.3 39.9
2017.09.11 2017.10.17 2017.11.14 2017.12.12 2018.01.12 2018.02.09
Stock price rise
probability score
A Sector 44.7 48.1 46.2 50.3 45.5 46.1
66.2B Sector 34.6 41.3 45.4 50.3 29.2 33.8
Total average
2017.11.14 2017.12.12 2018.01.12 2018.02.09
Total of
increase rate
Total score
A Sector 7 % -4 % 8 % -10 % 1 %
-3 % 48.0B Sector 16 % 9 % 10 % -72 % 14 %
Total average 11 % 3 % -59 % 23 % 6 %
2017.10.17
45
48 46
50
46 46
35
41
45
50
29
34
40
45 46
29
37 40
0
10
20
30
40
50
60
2017.09.11 2017.10.17 2017.11.14 2017.12.12 2018.01.12 2018.02.09
Stock price rise probability score
A sector
B sector
Total average
7%
-4%
8%
-10%
1%
16%
9% 10%
-72%
14%11%
3%
-59%
23%
6%
-80%
-60%
-40%
-20%
0%
20%
40%
2017.10.17 2017.11.14 2017.12.12 2018.01.12 2018.02.09
Increase rate of stock price rise
A sector
B sector
Total average
SHINSEGAEFOOD](data:image/gif;base64,R0lGODlhAQABAIAAAAAAAP///yH5BAEAAAAALAAAAAABAAEAAAIBRAA7)
Recommended
Recommended
More Related Content
What's hot
What's hot (20)
Similar to SHINSEGAEFOOD-031440-Algorithm Investment Report
Similar to SHINSEGAEFOOD-031440-Algorithm Investment Report (20)
More from 알고리즘 기업분석 컨설팅-알기컨,algikeon
More from 알고리즘 기업분석 컨설팅-알기컨,algikeon (20)
Recently uploaded
Recently uploaded (20)
SHINSEGAEFOOD-031440-Algorithm Investment Report
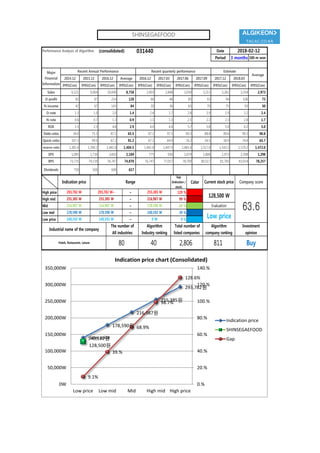
- 1. Performance Analysis of Algorithm (consolidated) 031440 Date Period 3 months 100-m won 2014.12 2015.12 2016.12 Average 2016.12 2017.03 2017.06 2017.09 2017.12 2018.03 IFRS(Con) IFRS(Con) IFRS(Con) IFRS(Con) IFRS(Con) IFRS(Con) IFRS(Con) IFRS(Con) IFRS(Con) IFRS(Con) IFRS(Con) Sales 6,521 9,064 10,690 8,758 2,803 2,848 3,030 3,211 3,261 3,354 2,973 O-profit 82 87 214 128 66 48 85 93 94 106 73 N-income 42 67 143 84 30 36 65 70 75 93 50 O-rate 1.3 1.0 2.0 1.4 2.4 1.7 2.8 2.9 2.9 3.2 2.4 N-rate 0.6 0.7 1.3 0.9 1.1 1.3 2.1 2.2 2.3 2.8 1.7 ROE 1.5 2.3 4.8 2.9 4.0 4.4 5.7 5.8 5.9 6.2 5.0 Debt-ratio 34.0 75.3 87.1 65.5 87.1 97.1 90.3 88.8 89.6 90.3 90.8 Quick-ratio 107.3 99.0 67.2 91.2 67.2 64.9 76.2 54.5 58.9 74.4 65.7 reserve-ratio 1,381.4 1,390.2 1,441.8 1,404.5 1,441.8 1,447.9 1,481.4 1,517.0 1,543.3 1,570.2 1,472.0 EPS 1,085 1,730 3,693 2,169 775 930 1,679 1,808 1,973 2,398 1,298 BPS 73,725 74,139 76,747 74,870 76,747 77,057 78,709 80,517 81,785 83,014 78,257 Dividends 750 500 600 617 Major Financial Information Recent Annual Performance Recent quarterly performance Estimate Average 2018-02-12 Gap (Indication / stock) Color High price ~ 129 % High mid ~ 99 % Mid ~ 69 % Low mid ~ 39 % Low price ~ 9 % Buy 140,192 W 140,192 W 0 W Industrial name of the company The number of All industries Algorithm Industry ranking Total number of listed companies Algorithm company ranking Investment opinion Hotels, Restaurants, Leisure 80 40 2,806 811 255,385 W 255,385 W 216,987 W 216,987 W 216,987 W 178,590 W Evaluation 293,782 W 293,782 W~ 255,385 W 128,500 W 63.6178,590 W 178,590 W 140,192 W Low price Indication price Range Current stock price Company score 140,192원 178,590원 216,987원 255,385원 293,782원 Low price 128,500원 9.1% 39.% 68.9% 98.7% 128.6% 0.% 20.% 40.% 60.% 80.% 100.% 120.% 140.% 0W 50,000W 100,000W 150,000W 200,000W 250,000W 300,000W 350,000W Low price Low mid Mid High mid High price Indication price chart (Consolidated) Indication price SHINSEGAEFOOD Gap SHINSEGAEFOOD
- 2. [Price for scheduled purchasing] Arbitrarily made Algorithm stocks Trading Strategies (consolidated) 031440 Date Period Gap (Indication / stock) Color low price 140,192 W 140,192 W ~ 0 W 9 % -529,733 W -4 Low mid 178,590 W 178,590 W ~ 140,192 W 39 % -2,269,416 W -13 Mid 216,987 W 216,987 W ~ 178,590 W 69 % -4,009,098 W -18 High mid 255,385 W 255,385 W ~ 216,987 W 99 % -5,748,781 W -23 Suggested Purchase Amount 5,821,973 W Number of stocks purchased 45 Indication price Range Buying / Selling Buying / Selling [Stocks] High price 293,782 W 293,782 W~ ~ 255,385 W 129 % -7,488,463 W All selling 2018-02-12 3 months Current stock price Evaluation Stock price rise probability score Investment opinion Prospective purchase amount 128,500 W Low price 66.2 Buy 10,000,000 W 39.7 44.7 45.8 28.8 37.3 39.9 2017.09.11 2017.10.17 2017.11.14 2017.12.12 2018.01.12 2018.02.09 Stock price rise probability score A Sector 44.7 48.1 46.2 50.3 45.5 46.1 66.2B Sector 34.6 41.3 45.4 50.3 29.2 33.8 Total average 2017.11.14 2017.12.12 2018.01.12 2018.02.09 Total of increase rate Total score A Sector 7 % -4 % 8 % -10 % 1 % -3 % 48.0B Sector 16 % 9 % 10 % -72 % 14 % Total average 11 % 3 % -59 % 23 % 6 % 2017.10.17 45 48 46 50 46 46 35 41 45 50 29 34 40 45 46 29 37 40 0 10 20 30 40 50 60 2017.09.11 2017.10.17 2017.11.14 2017.12.12 2018.01.12 2018.02.09 Stock price rise probability score A sector B sector Total average 7% -4% 8% -10% 1% 16% 9% 10% -72% 14%11% 3% -59% 23% 6% -80% -60% -40% -20% 0% 20% 40% 2017.10.17 2017.11.14 2017.12.12 2018.01.12 2018.02.09 Increase rate of stock price rise A sector B sector Total average SHINSEGAEFOOD
- 3. 정보와 완전 정보 결 투자판단 있습니 위배 무단으 숙지하 Compliance notice ① The information provided by The Algorithm Company Analysis Consulting is obtained through reliable data and information and The Algorithm Company Analysis Program (TACAP), but its accuracy or completeness are not guaranteed. Furthermore, it may change over time.Therefore, we are not legally responsible for the results of the data provided by The Algorithm Company Analysis Consulting because of information errors or omissions. ② The Algorithm Company Analysis Consulting and all the information provided on it site are reference materials for investment decisions and the final responsibility of investment is up to users utilizing this information. ③ The Algorithm Company Analysis Consulting and its site do not do anything that violates the related laws such as discretionary transaction. ④ Users can not reallocate and recycle the information provided by The Algorithm Company Analysis Consulting firm let alone the information provided by its Site. ⑤ Be sure to know about application period of this algorithm analysis report in order to improve its accuracy. Tel : 070 - 4667 - 5009 Email : tacac@tacac.co.kr Homepage : tacac.co.kr Blog : tacac.blog.me SERVICES M&A, IPO, CORPORATE RESTRUCTURING, MANAGEMENT OF TECHNOLOGY, BUSINESS STRATEGY, FAMILY BUSINESS Request : http://tacac.co.kr/?page_id=1374 ① Consulting The Algori accuracy o change ove results of Consulting ② informatio investmen up ③ do anythin transaction ④ The Algori informatio ⑤ analysis re