NONG SHIM-004370-Algorithm Investment Report
•
0 likes•106 views

NONG SHIM-004370-Algorithm Investment Report
![[Price for scheduled purchasing]
Arbitrarily made
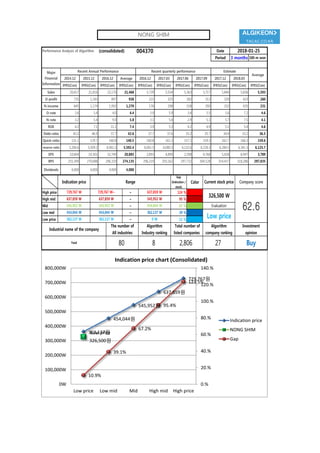
Algorithm stocks Trading Strategies (consolidated) 004370 Date
Period
Gap
(Indication /
stock)
Color
low price 362,137 W 362,137 W ~ 0 W 11 % -630,961 W -2
Low mid 454,044 W 454,044 W ~ 362,137 W 39 % -2,258,210 W -5
Mid 545,952 W 545,952 W ~ 454,044 W 67 % -3,885,458 W -7
High mid 637,859 W 637,859 W ~ 545,952 W 95 % -5,512,707 W -9
Suggested Purchase
Amount 5,780,776 W
Number of stocks
purchased 18
Indication price Range Buying / Selling Buying / Selling [Stocks]
High price 729,767 W 729,767 W~ ~ 637,859 W 124 % -7,139,955 W All selling
2018-01-25
3 months
Current stock price Evaluation
Stock price rise
probability score
Investment opinion Prospective purchase amount
326,500 W Low price 53.5 Buy 10,000,000 W
49.7 44.7 35.8 44.6 33.8 45.4
2017.08.24 2017.09.21 2017.10.27 2017.11.24 2017.12.22 2018.01.24
Stock price rise
probability score
A Sector 49.4 48.2 49.6 48.4 51.8 45.8
53.5B Sector 50.0 41.3 22.1 48.4 15.8 45.0
Total average
2017.10.27 2017.11.24 2017.12.22 2018.01.24
Total of
increase rate
Total score
A Sector -3 % 3 % -2 % 6 % -13 %
-5 % 43.7B Sector -21 % -87 % 54 % -206 % 65 %
Total average -11 % -25 % 20 % -32 % 26 %
2017.09.21
49 48 50 48
52
46
50
41
22
48
16
45
50
45
36
45
34
45
0
10
20
30
40
50
60
2017.08.24 2017.09.21 2017.10.27 2017.11.24 2017.12.22 2018.01.24
Stock price rise probability score
A sector
B sector
Total average
-3% 3% -2% 6%
-13%-21%
-87%
54%
-206%
65%
-11% -25%
20%
-32%
26%
-250%
-200%
-150%
-100%
-50%
0%
50%
100%
2017.09.21 2017.10.27 2017.11.24 2017.12.22 2018.01.24
Increase rate of stock price rise
A sector
B sector
Total average
NONG SHIM](data:image/gif;base64,R0lGODlhAQABAIAAAAAAAP///yH5BAEAAAAALAAAAAABAAEAAAIBRAA7)
Recommended
Recommended
More Related Content
What's hot
What's hot (20)
Similar to NONG SHIM-004370-Algorithm Investment Report
Similar to NONG SHIM-004370-Algorithm Investment Report (20)
More from 알고리즘 기업분석 컨설팅-알기컨,algikeon
More from 알고리즘 기업분석 컨설팅-알기컨,algikeon (20)
Recently uploaded
Recently uploaded (20)
NONG SHIM-004370-Algorithm Investment Report
- 1. Performance Analysis of Algorithm (consolidated) 004370 Date Period 3 months 100-m won 2014.12 2015.12 2016.12 Average 2016.12 2017.03 2017.06 2017.09 2017.12 2018.03 IFRS(Con) IFRS(Con) IFRS(Con) IFRS(Con) IFRS(Con) IFRS(Con) IFRS(Con) IFRS(Con) IFRS(Con) IFRS(Con) IFRS(Con) Sales 20,417 21,816 22,170 21,468 5,739 5,554 5,363 5,717 5,844 5,836 5,593 O-profit 735 1,183 897 938 221 325 182 313 329 423 260 N-income 645 1,174 1,992 1,270 176 298 158 290 332 435 231 O-rate 3.6 5.4 4.0 4.4 3.9 5.9 3.4 5.5 5.6 7.2 4.6 N-rate 3.2 5.4 9.0 5.8 3.1 5.4 2.9 5.1 5.7 7.5 4.1 ROE 4.2 7.1 11.1 7.4 3.9 5.3 4.2 4.9 5.1 5.4 4.6 Debt-ratio 43.2 46.9 37.7 42.6 37.7 37.6 35.2 35.7 34.4 33.2 36.5 Quick-ratio 131.1 129.7 160.8 140.5 160.8 161.3 157.1 159.3 162.7 166.3 159.6 reserve-ratio 5,206.6 5,509.2 6,061.5 5,592.4 6,061.5 6,080.3 6,132.6 6,228.3 6,284.5 6,341.3 6,125.7 EPS 10,604 19,301 32,749 20,885 2,893 4,899 2,598 4,768 5,428 6,947 3,789 BPS 255,399 270,688 296,319 274,135 296,319 293,162 297,732 304,128 314,437 318,286 297,835 Dividends 4,000 4,000 4,000 4,000 Major Financial Information Recent Annual Performance Recent quarterly performance Estimate Average 2018-01-25 Gap (Indication / stock) Color High price ~ 124 % High mid ~ 95 % Mid ~ 67 % Low mid ~ 39 % Low price ~ 11 % Buy 362,137 W 362,137 W 0 W Industrial name of the company The number of All industries Algorithm Industry ranking Total number of listed companies Algorithm company ranking Investment opinion Food 80 8 2,806 27 637,859 W 637,859 W 545,952 W 545,952 W 545,952 W 454,044 W Evaluation 729,767 W 729,767 W~ 637,859 W 326,500 W 62.6454,044 W 454,044 W 362,137 W Low price Indication price Range Current stock price Company score 362,137원 454,044원 545,952원 637,859원 729,767원 Low price 326,500원 10.9% 39.1% 67.2% 95.4% 123.5% 0.% 20.% 40.% 60.% 80.% 100.% 120.% 140.% 0W 100,000W 200,000W 300,000W 400,000W 500,000W 600,000W 700,000W 800,000W Low price Low mid Mid High mid High price Indication price chart (Consolidated) Indication price NONG SHIM Gap NONG SHIM
- 2. [Price for scheduled purchasing] Arbitrarily made Algorithm stocks Trading Strategies (consolidated) 004370 Date Period Gap (Indication / stock) Color low price 362,137 W 362,137 W ~ 0 W 11 % -630,961 W -2 Low mid 454,044 W 454,044 W ~ 362,137 W 39 % -2,258,210 W -5 Mid 545,952 W 545,952 W ~ 454,044 W 67 % -3,885,458 W -7 High mid 637,859 W 637,859 W ~ 545,952 W 95 % -5,512,707 W -9 Suggested Purchase Amount 5,780,776 W Number of stocks purchased 18 Indication price Range Buying / Selling Buying / Selling [Stocks] High price 729,767 W 729,767 W~ ~ 637,859 W 124 % -7,139,955 W All selling 2018-01-25 3 months Current stock price Evaluation Stock price rise probability score Investment opinion Prospective purchase amount 326,500 W Low price 53.5 Buy 10,000,000 W 49.7 44.7 35.8 44.6 33.8 45.4 2017.08.24 2017.09.21 2017.10.27 2017.11.24 2017.12.22 2018.01.24 Stock price rise probability score A Sector 49.4 48.2 49.6 48.4 51.8 45.8 53.5B Sector 50.0 41.3 22.1 48.4 15.8 45.0 Total average 2017.10.27 2017.11.24 2017.12.22 2018.01.24 Total of increase rate Total score A Sector -3 % 3 % -2 % 6 % -13 % -5 % 43.7B Sector -21 % -87 % 54 % -206 % 65 % Total average -11 % -25 % 20 % -32 % 26 % 2017.09.21 49 48 50 48 52 46 50 41 22 48 16 45 50 45 36 45 34 45 0 10 20 30 40 50 60 2017.08.24 2017.09.21 2017.10.27 2017.11.24 2017.12.22 2018.01.24 Stock price rise probability score A sector B sector Total average -3% 3% -2% 6% -13%-21% -87% 54% -206% 65% -11% -25% 20% -32% 26% -250% -200% -150% -100% -50% 0% 50% 100% 2017.09.21 2017.10.27 2017.11.24 2017.12.22 2018.01.24 Increase rate of stock price rise A sector B sector Total average NONG SHIM
- 3. 정보와 완전 정보 결 투자판단 있습니 위배 무단으 숙지하 Compliance notice ① The information provided by The Algorithm Company Analysis Consulting is obtained through reliable data and information and The Algorithm Company Analysis Program (TACAP), but its accuracy or completeness are not guaranteed. Furthermore, it may change over time.Therefore, we are not legally responsible for the results of the data provided by The Algorithm Company Analysis Consulting because of information errors or omissions. ② The Algorithm Company Analysis Consulting and all the information provided on it site are reference materials for investment decisions and the final responsibility of investment is up to users utilizing this information. ③ The Algorithm Company Analysis Consulting and its site do not do anything that violates the related laws such as discretionary transaction. ④ Users can not reallocate and recycle the information provided by The Algorithm Company Analysis Consulting firm let alone the information provided by its Site. ⑤ Be sure to know about application period of this algorithm analysis report in order to improve its accuracy. Tel : 070 - 4667 - 5009 Email : tacac@tacac.co.kr Homepage : tacac.co.kr Blog : tacac.blog.me SERVICES M&A, IPO, CORPORATE RESTRUCTURING, MANAGEMENT OF TECHNOLOGY, BUSINESS STRATEGY, FAMILY BUSINESS Request : http://tacac.co.kr/?page_id=1374 ① Consulting The Algori accuracy o change ove results of Consulting ② informatio investmen up ③ do anythin transaction ④ The Algori informatio ⑤ analysis re