HOJEON LIMITED-111110-Algorithm Investment Report
•
1 like•155 views

HOJEON LIMITED-111110-Algorithm Investment Report
![[Price for scheduled purchasing]
Arbitrarily made
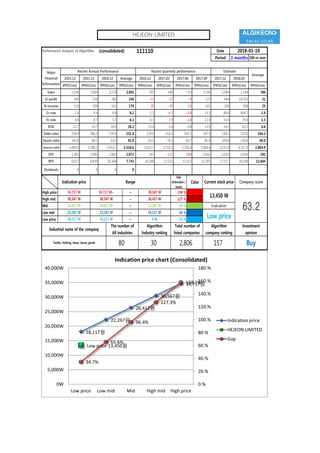
Algorithm stocks Trading Strategies (consolidated) 111110 Date
Period
Gap
(Indication /
stock)
Color
low price 18,117 W 18,117 W ~ 0 W 35 % -1,821,191 W -101
Low mid 22,267 W 22,267 W ~ 18,117 W 66 % -3,440,498 W -155
Mid 26,417 W 26,417 W ~ 22,267 W 96 % -5,059,806 W -192
High mid 30,567 W 30,567 W ~ 26,417 W 127 % -6,679,113 W All selling
Suggested Purchase
Amount 5,248,117 W
Number of stocks
purchased 390
Indication price Range Buying / Selling Buying / Selling [Stocks]
High price 34,717 W 34,717 W~ ~ 30,567 W 158 % -8,298,421 W All selling
2018-01-18
3 months
Current stock price Evaluation
Stock price rise
probability score
Investment opinion Prospective purchase amount
13,450 W Low price 36.4 Buy 10,000,000 W
41.4 59.6 38.4 48.8 49.3 30.6
2017.08.17 2017.09.14 2017.10.20 2017.11.17 2017.12.15 2018.01.17
Stock price rise
probability score
A Sector 44.8 48.9 45.9 46.2 49.5 41.1
36.4B Sector 37.9 70.4 30.8 46.2 49.2 20.0
Total average
2017.10.20 2017.11.17 2017.12.15 2018.01.17
Total of
increase rate
Total score
A Sector 8 % -7 % 1 % 7 % -20 %
-13 % 43.7B Sector 46 % -128 % 33 % 6 % -146 %
Total average 31 % -55 % 21 % 1 % -61 %
2017.09.14
45
49 46 46 49
4138
70
31
46 49
20
41
60
38
49 49
31
0
10
20
30
40
50
60
70
80
2017.08.17 2017.09.14 2017.10.20 2017.11.17 2017.12.15 2018.01.17
Stock price rise probability score
A sector
B sector
Total average
8%
-7% 1% 7%
-20%
46%
-128%
33%
6%
-146%
31%
-55%
21%
1%
-61%
-200%
-150%
-100%
-50%
0%
50%
100%
2017.09.14 2017.10.20 2017.11.17 2017.12.15 2018.01.17
Increase rate of stock price rise
A sector
B sector
Total average
HEJEON LIMITED](data:image/gif;base64,R0lGODlhAQABAIAAAAAAAP///yH5BAEAAAAALAAAAAABAAEAAAIBRAA7)
Recommended
Recommended
More Related Content
What's hot
What's hot (20)
Similar to HOJEON LIMITED-111110-Algorithm Investment Report
Similar to HOJEON LIMITED-111110-Algorithm Investment Report (20)
More from 알고리즘 기업분석 컨설팅-알기컨,algikeon
More from 알고리즘 기업분석 컨설팅-알기컨,algikeon (20)
Recently uploaded
Recently uploaded (20)
HOJEON LIMITED-111110-Algorithm Investment Report
- 1. Performance Analysis of Algorithm (consolidated) 111110 Date Period 3 months 100-m won 2014.12 2015.12 2016.12 Average 2016.12 2017.03 2017.06 2017.09 2017.12 2018.03 IFRS(Con) IFRS(Con) IFRS(Con) IFRS(Con) IFRS(Con) IFRS(Con) IFRS(Con) IFRS(Con) IFRS(Con) IFRS(Con) IFRS(Con) Sales 2,538 2,969 3,170 2,892 702 569 731 1,140 1,064 1,144 786 O-profit 189 250 280 240 -15 -27 -6 173 944 10,353 31 N-income 118 258 161 179 30 -45 -25 141 358 908 25 O-rate 7.4 8.4 8.8 8.2 -2.1 -4.7 -0.8 15.2 88.8 904.7 1.9 N-rate 4.6 8.7 5.1 6.1 4.3 -7.9 -3.4 12.4 33.6 79.4 1.3 ROE 22.7 43.7 18.0 28.1 13.4 -1.6 0.8 13.9 24.2 43.2 6.6 Debt-ratio 236.9 286.3 170.9 231.4 170.9 153.2 185.1 147.9 138.2 129.0 164.3 Quick-ratio 143.8 68.1 63.5 91.8 63.5 70.1 60.7 81.8 100.8 130.8 69.0 reserve-ratio 2,490.0 2,388.2 2,653.7 2,510.6 2,653.7 2,791.5 2,706.4 3,068.0 3,531.8 4,257.6 2,804.9 EPS 1,365 2,985 1,863 2,071 347 -521 -289 1,632 2,022 5,059 292 BPS 6,017 6,839 10,368 7,741 10,368 12,532 12,312 15,205 17,517 20,180 12,604 Dividends 0 0 0 0 Major Financial Information Recent Annual Performance Recent quarterly performance Estimate Average 2018-01-18 Gap (Indication / stock) Color High price ~ 158 % High mid ~ 127 % Mid ~ 96 % Low mid ~ 66 % Low price ~ 35 % Buy 18,117 W 18,117 W 0 W Industrial name of the company The number of All industries Algorithm Industry ranking Total number of listed companies Algorithm company ranking Investment opinion Textile, clothing, shoes, luxury goods 80 30 2,806 157 30,567 W 30,567 W 26,417 W 26,417 W 26,417 W 22,267 W Evaluation 34,717 W 34,717 W~ 30,567 W 13,450 W 63.222,267 W 22,267 W 18,117 W Low price Indication price Range Current stock price Company score 18,117원 22,267원 26,417원 30,567원 34,717원 Low price 13,450원 34.7% 65.6% 96.4% 127.3% 158.1% 0.% 20.% 40.% 60.% 80.% 100.% 120.% 140.% 160.% 180.% 0W 5,000W 10,000W 15,000W 20,000W 25,000W 30,000W 35,000W 40,000W Low price Low mid Mid High mid High price Indication price chart (Consolidated) Indication price HEJEON LIMITED Gap HEJEON LIMITED
- 2. [Price for scheduled purchasing] Arbitrarily made Algorithm stocks Trading Strategies (consolidated) 111110 Date Period Gap (Indication / stock) Color low price 18,117 W 18,117 W ~ 0 W 35 % -1,821,191 W -101 Low mid 22,267 W 22,267 W ~ 18,117 W 66 % -3,440,498 W -155 Mid 26,417 W 26,417 W ~ 22,267 W 96 % -5,059,806 W -192 High mid 30,567 W 30,567 W ~ 26,417 W 127 % -6,679,113 W All selling Suggested Purchase Amount 5,248,117 W Number of stocks purchased 390 Indication price Range Buying / Selling Buying / Selling [Stocks] High price 34,717 W 34,717 W~ ~ 30,567 W 158 % -8,298,421 W All selling 2018-01-18 3 months Current stock price Evaluation Stock price rise probability score Investment opinion Prospective purchase amount 13,450 W Low price 36.4 Buy 10,000,000 W 41.4 59.6 38.4 48.8 49.3 30.6 2017.08.17 2017.09.14 2017.10.20 2017.11.17 2017.12.15 2018.01.17 Stock price rise probability score A Sector 44.8 48.9 45.9 46.2 49.5 41.1 36.4B Sector 37.9 70.4 30.8 46.2 49.2 20.0 Total average 2017.10.20 2017.11.17 2017.12.15 2018.01.17 Total of increase rate Total score A Sector 8 % -7 % 1 % 7 % -20 % -13 % 43.7B Sector 46 % -128 % 33 % 6 % -146 % Total average 31 % -55 % 21 % 1 % -61 % 2017.09.14 45 49 46 46 49 4138 70 31 46 49 20 41 60 38 49 49 31 0 10 20 30 40 50 60 70 80 2017.08.17 2017.09.14 2017.10.20 2017.11.17 2017.12.15 2018.01.17 Stock price rise probability score A sector B sector Total average 8% -7% 1% 7% -20% 46% -128% 33% 6% -146% 31% -55% 21% 1% -61% -200% -150% -100% -50% 0% 50% 100% 2017.09.14 2017.10.20 2017.11.17 2017.12.15 2018.01.17 Increase rate of stock price rise A sector B sector Total average HEJEON LIMITED
- 3. 정보와 완전 정보 결 투자판단 있습니 위배 무단으 숙지하 Compliance notice ① The information provided by The Algorithm Company Analysis Consulting is obtained through reliable data and information and The Algorithm Company Analysis Program (TACAP), but its accuracy or completeness are not guaranteed. Furthermore, it may change over time.Therefore, we are not legally responsible for the results of the data provided by The Algorithm Company Analysis Consulting because of information errors or omissions. ② The Algorithm Company Analysis Consulting and all the information provided on it site are reference materials for investment decisions and the final responsibility of investment is up to users utilizing this information. ③ The Algorithm Company Analysis Consulting and its site do not do anything that violates the related laws such as discretionary transaction. ④ Users can not reallocate and recycle the information provided by The Algorithm Company Analysis Consulting firm let alone the information provided by its Site. ⑤ Be sure to know about application period of this algorithm analysis report in order to improve its accuracy. Tel : 070 - 4667 - 5009 Email : tacac@tacac.co.kr Homepage : tacac.co.kr Blog : tacac.blog.me SERVICES M&A, IPO, CORPORATE RESTRUCTURING, MANAGEMENT OF TECHNOLOGY, BUSINESS STRATEGY, FAMILY BUSINESS Request : http://tacac.co.kr/?page_id=1374 ① Consulting The Algori accuracy o change ove results of Consulting ② informatio investmen up ③ do anythin transaction ④ The Algori informatio ⑤ analysis re