YOUNGONE CORPORATION-111770-Algorithm Investment Report
•
0 likes•136 views

YOUNGONE CORPORATION-111770-Algorithm Investment Report
![[Price for scheduled purchasing]
Arbitrarily made
Algorithm stocks Trading Strategies (consolidated) 111770 Date
Period
Gap
(Indication /
stock)
Color
2018-02-02
3 months
Current stock price Evaluation
Stock price rise
probability score
Investment opinion Prospective purchase amount
32,700 W Low price 60.0 Buy 10,000,000 W
Suggested Purchase
Amount 6,176,981 W
Number of stocks
purchased 189
Indication price Range Buying / Selling Buying / Selling [Stocks]
High price 69,176 W 69,176 W~ ~ 60,549 W 112 % -6,890,308 W All selling
High mid 60,549 W 60,549 W ~ 51,922 W 85 % -5,260,690 W -87
Mid 51,922 W 51,922 W ~ 43,295 W 59 % -3,631,072 W -70
Low mid 43,295 W 43,295 W ~ 34,668 W 32 % -2,001,454 W -46
low price 34,668 W 34,668 W ~ 0 W 6 % -371,836 W -11
Stock price rise
probability score
A Sector 46.8 46.6 50.0 47.4 44.8 50.4
60.0B Sector 23.3 33.8 27.5 47.4 34.2 28.8
Total average
2017.09.01 2017.09.29 2017.11.06 2017.12.04 2018.01.04 2018.02.01
35.0 40.2 38.8 45.4 39.5 39.6
-15 % 0 %
2017.09.29 2017.11.06 2017.12.04 2018.01.04 2018.02.01
Total of
increase rate
Total score
A Sector -0 % 7 % -6 % -6 % 11 %
2 % 48.3B Sector 31 % -23 % 42 % -39 % -19 %
Total average 13 % -4 % 15 %
47 47
50 47 45
50
23
34
28
47
34
29
35
40 39
45
39 40
0
10
20
30
40
50
60
2017.09.01 2017.09.29 2017.11.06 2017.12.04 2018.01.04 2018.02.01
Stock price rise probability score
A sector
B sector
Total average
-0%
7%
-6% -6%
11%
31%
-23%
42%
-39%
-19%
13%
-4%
15%
-15%
0%
-60%
-40%
-20%
0%
20%
40%
60%
2017.09.29 2017.11.06 2017.12.04 2018.01.04 2018.02.01
Increase rate of stock price rise
A sector
B sector
Total average
YOUNGONE CORPORATION](data:image/gif;base64,R0lGODlhAQABAIAAAAAAAP///yH5BAEAAAAALAAAAAABAAEAAAIBRAA7)
Recommended
Recommended
More Related Content
What's hot
What's hot (20)
Similar to YOUNGONE CORPORATION-111770-Algorithm Investment Report
Similar to YOUNGONE CORPORATION-111770-Algorithm Investment Report (20)
More from 알고리즘 기업분석 컨설팅-알기컨,algikeon
More from 알고리즘 기업분석 컨설팅-알기컨,algikeon (20)
Recently uploaded
Recently uploaded (20)
YOUNGONE CORPORATION-111770-Algorithm Investment Report
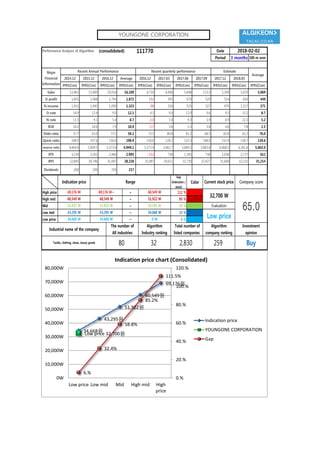
- 1. Performance Analysis of Algorithm (consolidated) 111770 Date Period 3 months 100-m won 2014.12 2015.12 2016.12 Average 2016.12 2017.03 2017.06 2017.09 2017.12 2018.03 IFRS(Con) IFRS(Con) IFRS(Con) IFRS(Con) IFRS(Con) IFRS(Con) IFRS(Con) IFRS(Con) IFRS(Con) IFRS(Con) IFRS(Con) Sales 12,463 15,849 20,016 16,109 4,710 4,406 5,648 5,513 5,399 5,470 5,069 O-profit 1,855 1,968 1,794 1,872 192 395 679 529 514 830 449 N-income 1,433 1,445 1,090 1,323 -94 326 525 327 479 1,217 271 O-rate 14.9 12.4 9.0 12.1 4.1 9.0 12.0 9.6 9.5 15.2 8.7 N-rate 11.5 9.1 5.4 8.7 -2.0 7.4 9.3 5.9 8.9 22.3 5.2 ROE 14.2 10.6 7.9 10.9 -2.7 3.6 5.3 3.8 4.6 7.8 2.5 Debt-ratio 37.7 63.0 73.5 58.1 73.5 80.8 81.2 68.5 65.8 63.2 76.0 Quick-ratio 248.9 197.6 150.0 198.9 150.0 128.2 132.3 148.0 152.9 158.7 139.6 reserve-ratio 4,464.4 5,009.5 5,373.4 4,949.1 5,373.4 5,461.7 5,689.2 5,883.8 6,068.5 6,261.6 5,602.0 EPS 3,234 3,261 2,460 2,985 -212 736 1,185 738 1,036 2,727 612 BPS 22,845 30,746 31,087 28,226 31,087 29,611 31,730 32,427 31,668 32,215 31,214 Dividends 200 200 250 217 2018-02-02 Major Financial Information Recent Annual Performance Recent quarterly performance Estimate Average Gap (Indication / stock) Color High price ~ 112 % High mid ~ 85 % Mid ~ 59 % Low mid ~ 32 % Low price ~ 6 % Indication price Range Current stock price Company score 60,549 W 60,549 W 51,922 W 51,922 W 51,922 W 43,295 W Evaluation 69,176 W 69,176 W~ 60,549 W 32,700 W 65.043,295 W 43,295 W 34,668 W Low price Buy 34,668 W 34,668 W 0 W Industrial name of the company The number of All industries Algorithm Industry ranking Total number of listed companies Algorithm company ranking Investment opinion Textile, clothing, shoes, luxury goods 80 32 2,830 259 34,668원 43,295원 51,922원 60,549원 69,176원 Low price 32,700원 6.% 32.4% 58.8% 85.2% 111.5% 0.% 20.% 40.% 60.% 80.% 100.% 120.% 0W 10,000W 20,000W 30,000W 40,000W 50,000W 60,000W 70,000W 80,000W Low price Low mid Mid High mid High price Indication price chart (Consolidated) Indication price YOUNGONE CORPORATION Gap YOUNGONE CORPORATION
- 2. [Price for scheduled purchasing] Arbitrarily made Algorithm stocks Trading Strategies (consolidated) 111770 Date Period Gap (Indication / stock) Color 2018-02-02 3 months Current stock price Evaluation Stock price rise probability score Investment opinion Prospective purchase amount 32,700 W Low price 60.0 Buy 10,000,000 W Suggested Purchase Amount 6,176,981 W Number of stocks purchased 189 Indication price Range Buying / Selling Buying / Selling [Stocks] High price 69,176 W 69,176 W~ ~ 60,549 W 112 % -6,890,308 W All selling High mid 60,549 W 60,549 W ~ 51,922 W 85 % -5,260,690 W -87 Mid 51,922 W 51,922 W ~ 43,295 W 59 % -3,631,072 W -70 Low mid 43,295 W 43,295 W ~ 34,668 W 32 % -2,001,454 W -46 low price 34,668 W 34,668 W ~ 0 W 6 % -371,836 W -11 Stock price rise probability score A Sector 46.8 46.6 50.0 47.4 44.8 50.4 60.0B Sector 23.3 33.8 27.5 47.4 34.2 28.8 Total average 2017.09.01 2017.09.29 2017.11.06 2017.12.04 2018.01.04 2018.02.01 35.0 40.2 38.8 45.4 39.5 39.6 -15 % 0 % 2017.09.29 2017.11.06 2017.12.04 2018.01.04 2018.02.01 Total of increase rate Total score A Sector -0 % 7 % -6 % -6 % 11 % 2 % 48.3B Sector 31 % -23 % 42 % -39 % -19 % Total average 13 % -4 % 15 % 47 47 50 47 45 50 23 34 28 47 34 29 35 40 39 45 39 40 0 10 20 30 40 50 60 2017.09.01 2017.09.29 2017.11.06 2017.12.04 2018.01.04 2018.02.01 Stock price rise probability score A sector B sector Total average -0% 7% -6% -6% 11% 31% -23% 42% -39% -19% 13% -4% 15% -15% 0% -60% -40% -20% 0% 20% 40% 60% 2017.09.29 2017.11.06 2017.12.04 2018.01.04 2018.02.01 Increase rate of stock price rise A sector B sector Total average YOUNGONE CORPORATION
- 3. 정보와 완전 정보 결 투자판단 있습니 위배 무단으 숙지하 Compliance notice ① The information provided by The Algorithm Company Analysis Consulting is obtained through reliable data and information and The Algorithm Company Analysis Program (TACAP), but its accuracy or completeness are not guaranteed. Furthermore, it may change over time.Therefore, we are not legally responsible for the results of the data provided by The Algorithm Company Analysis Consulting because of information errors or omissions. ② The Algorithm Company Analysis Consulting and all the information provided on it site are reference materials for investment decisions and the final responsibility of investment is up to users utilizing this information. ③ The Algorithm Company Analysis Consulting and its site do not do anything that violates the related laws such as discretionary transaction. ④ Users can not reallocate and recycle the information provided by The Algorithm Company Analysis Consulting firm let alone the information provided by its Site. ⑤ Be sure to know about application period of this algorithm analysis report in order to improve its accuracy. Tel : 070 - 4667 - 5009 Email : tacac@tacac.co.kr Homepage : tacac.co.kr Blog : tacac.blog.me SERVICES M&A, IPO, CORPORATE RESTRUCTURING, MANAGEMENT OF TECHNOLOGY, BUSINESS STRATEGY, FAMILY BUSINESS Request : http://tacac.co.kr/?page_id=1374 ① Consulting The Algori accuracy o change ove results of Consulting ② informatio investmen up ③ do anythin transaction ④ The Algori informatio ⑤ analysis re