ITSHANBUL-226320-Algorithm Investment Report
•
0 likes•75 views

ITSHANBUL-226320-Algorithm Investment Report
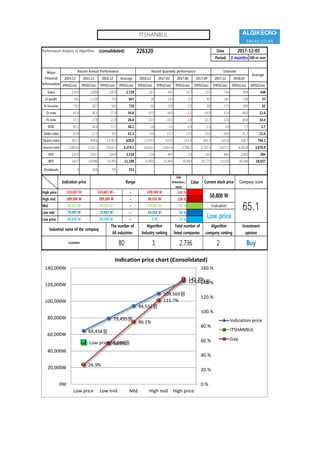
![[Price for scheduled purchasing]
Arbitrarily made
Algorithm stocks Trading Strategies (consolidated) 226320 Date
Period
Gap
(Indication /
stock)
Color
2017-12-05
3 months
Current stock price Evaluation
Stock price rise
probability score
Investment opinion Prospective purchase amount
50,800 W Low price 41.1 Buy 10,000,000 W
Suggested Purchase
Amount 5,398,558 W
Number of stocks
purchased 106
Indication price Range Buying / Selling Buying / Selling [Stocks]
High price 124,607 W 124,607 W~ ~ 109,569 W 145 % -7,843,499 W All selling
High mid 109,569 W 109,569 W ~ 94,532 W 116 % -6,245,478 W All selling
Mid 94,532 W 94,532 W ~ 79,495 W 86 % -4,647,457 W -49
Low mid 79,495 W 79,495 W ~ 64,458 W 56 % -3,049,436 W -38
low price 64,458 W 64,458 W ~ 0 W 27 % -1,451,415 W -23
Stock price rise
probability score
A Sector 43.2 44.2 45.9 48.2 51.8 48.3
41.1B Sector 12.5 25.8 27.9 48.2 58.8 47.9
Total average
2017.07.06 2017.08.03 2017.09.01 2017.09.29 2017.11.06 2017.12.04
27.8 35.0 36.9 59.6 55.3 48.1
-8 % -15 %
2017.08.03 2017.09.01 2017.09.29 2017.11.06 2017.12.04
Total of
increase rate
Total score
A Sector 2 % 4 % 5 % 7 % -7 %
8 % 56.3B Sector 52 % 7 % 42 % 18 % -23 %
Total average 21 % 5 % 38 %
43 44 46 48
52
48
13
26 28
48
59
48
28
35 37
60
55
48
0
10
20
30
40
50
60
70
2017.07.06 2017.08.03 2017.09.01 2017.09.29 2017.11.06 2017.12.04
Stock price rise probability score
A sector
B sector
Total average
2% 4% 5% 7%
-7%
52%
7%
42%
18%
-23%
21%
5%
38%
-8%
-15%
-40%
-20%
0%
20%
40%
60%
2017.08.03 2017.09.01 2017.09.29 2017.11.06 2017.12.04
Increase rate of stock price rise
A sector
B sector
Total average
ITSHANBUL](data:image/gif;base64,R0lGODlhAQABAIAAAAAAAP///yH5BAEAAAAALAAAAAABAAEAAAIBRAA7)
Recommended
Recommended
More Related Content
What's hot
What's hot (20)
Similar to ITSHANBUL-226320-Algorithm Investment Report
Similar to ITSHANBUL-226320-Algorithm Investment Report (20)
More from 알고리즘 기업분석 컨설팅-알기컨,algikeon
More from 알고리즘 기업분석 컨설팅-알기컨,algikeon (20)
Recently uploaded
Recently uploaded (20)
ITSHANBUL-226320-Algorithm Investment Report
- 1. Performance Analysis of Algorithm (consolidated) 226320 Date Period 3 months 100-m won 2014.12 2015.12 2016.12 Average 2016.12 2017.03 2017.06 2017.09 2017.12 2018.03 IFRS(Con) IFRS(Con) IFRS(Con) IFRS(Con) IFRS(Con) IFRS(Con) IFRS(Con) IFRS(Con) IFRS(Con) IFRS(Con) IFRS(Con) Sales 2,419 3,096 2,673 2,729 267 541 427 557 764 899 448 O-profit 991 1,118 733 947 28 133 -15 83 247 756 57 N-income 763 837 583 728 60 109 12 68 173 439 62 O-rate 41.0 36.1 27.4 34.8 10.5 24.6 -3.5 14.9 32.4 84.0 11.6 N-rate 31.5 27.0 21.8 26.8 22.5 20.1 2.8 12.2 22.6 48.8 14.4 ROE 95.1 26.4 17.2 46.2 1.8 3.2 0.3 1.5 3.4 7.7 1.7 Debt-ratio 92.9 22.5 8.6 41.3 8.6 11.2 15.0 15.0 18.0 21.7 12.4 Quick-ratio 181.2 499.6 1,179.3 620.0 1,179.3 922.0 531.4 543.7 421.8 328.7 794.1 reserve-ratio 2,005.0 7,102.3 4,016.1 4,374.5 4,016.1 4,003.4 3,708.2 3,755.5 4,077.2 4,542.8 3,870.8 EPS 3,479 3,817 2,659 3,318 274 497 55 310 643 2,002 284 BPS 3,657 14,446 15,491 11,198 15,491 15,445 20,443 20,771 23,310 26,160 18,037 Dividends 0 958 701 553 2017-12-05 Major Financial Information Recent Annual Performance Recent quarterly performance Estimate Average Gap (Indication / stock) Color High price ~ 145 % High mid ~ 116 % Mid ~ 86 % Low mid ~ 56 % Low price ~ 27 % Indication price Range Current stock price Company score 109,569 W 109,569 W 94,532 W 94,532 W 94,532 W 79,495 W Evaluation 124,607 W 124,607 W~ 109,569 W 50,800 W 65.179,495 W 79,495 W 64,458 W Low price Buy 64,458 W 64,458 W 0 W Industrial name of the company The number of All industries Algorithm Industry ranking Total number of listed companies Algorithm company ranking Investment opinion Cosmetics 80 1 2,736 2 64,458원 79,495원 94,532원 109,569원 124,607원 Low price 50,800원 26.9% 56.5% 86.1% 115.7% 145.3% 0.% 20.% 40.% 60.% 80.% 100.% 120.% 140.% 160.% 0W 20,000W 40,000W 60,000W 80,000W 100,000W 120,000W 140,000W Low price Low mid Mid High mid High price Indication price chart (Consolidated) Indication price ITSHANBUL Gap ITSHANBUL
- 2. [Price for scheduled purchasing] Arbitrarily made Algorithm stocks Trading Strategies (consolidated) 226320 Date Period Gap (Indication / stock) Color 2017-12-05 3 months Current stock price Evaluation Stock price rise probability score Investment opinion Prospective purchase amount 50,800 W Low price 41.1 Buy 10,000,000 W Suggested Purchase Amount 5,398,558 W Number of stocks purchased 106 Indication price Range Buying / Selling Buying / Selling [Stocks] High price 124,607 W 124,607 W~ ~ 109,569 W 145 % -7,843,499 W All selling High mid 109,569 W 109,569 W ~ 94,532 W 116 % -6,245,478 W All selling Mid 94,532 W 94,532 W ~ 79,495 W 86 % -4,647,457 W -49 Low mid 79,495 W 79,495 W ~ 64,458 W 56 % -3,049,436 W -38 low price 64,458 W 64,458 W ~ 0 W 27 % -1,451,415 W -23 Stock price rise probability score A Sector 43.2 44.2 45.9 48.2 51.8 48.3 41.1B Sector 12.5 25.8 27.9 48.2 58.8 47.9 Total average 2017.07.06 2017.08.03 2017.09.01 2017.09.29 2017.11.06 2017.12.04 27.8 35.0 36.9 59.6 55.3 48.1 -8 % -15 % 2017.08.03 2017.09.01 2017.09.29 2017.11.06 2017.12.04 Total of increase rate Total score A Sector 2 % 4 % 5 % 7 % -7 % 8 % 56.3B Sector 52 % 7 % 42 % 18 % -23 % Total average 21 % 5 % 38 % 43 44 46 48 52 48 13 26 28 48 59 48 28 35 37 60 55 48 0 10 20 30 40 50 60 70 2017.07.06 2017.08.03 2017.09.01 2017.09.29 2017.11.06 2017.12.04 Stock price rise probability score A sector B sector Total average 2% 4% 5% 7% -7% 52% 7% 42% 18% -23% 21% 5% 38% -8% -15% -40% -20% 0% 20% 40% 60% 2017.08.03 2017.09.01 2017.09.29 2017.11.06 2017.12.04 Increase rate of stock price rise A sector B sector Total average ITSHANBUL
- 3. 정보와 완전 정보 결 투자판단 있습니 위배 무단으 숙지하 Compliance notice ① The information provided by The Algorithm Company Analysis Consulting is obtained through reliable data and information and The Algorithm Company Analysis Program (TACAP), but its accuracy or completeness are not guaranteed. Furthermore, it may change over time.Therefore, we are not legally responsible for the results of the data provided by The Algorithm Company Analysis Consulting because of information errors or omissions. ② The Algorithm Company Analysis Consulting and all the information provided on it site are reference materials for investment decisions and the final responsibility of investment is up to users utilizing this information. ③ The Algorithm Company Analysis Consulting and its site do not do anything that violates the related laws such as discretionary transaction. ④ Users can not reallocate and recycle the information provided by The Algorithm Company Analysis Consulting firm let alone the information provided by its Site. ⑤ Be sure to know about application period of this algorithm analysis report in order to improve its accuracy. Tel : 070 - 4667 - 5009 Email : tacac@tacac.co.kr Homepage : tacac.co.kr Blog : tacac.blog.me SERVICES M&A, IPO, CORPORATE RESTRUCTURING, MANAGEMENT OF TECHNOLOGY, BUSINESS STRATEGY, FAMILY BUSINESS Request : http://tacac.co.kr/?page_id=1374 ① Consulting The Algori accuracy o change ove results of Consulting ② informatio investmen up ③ do anythin transaction ④ The Algori informatio ⑤ analysis re