INTERFLEX-051370-Algorithm Investment Report
•
1 like•130 views

INTERFLEX-051370-Algorithm Investment Report
![[Price for scheduled purchasing]
Arbitrarily made
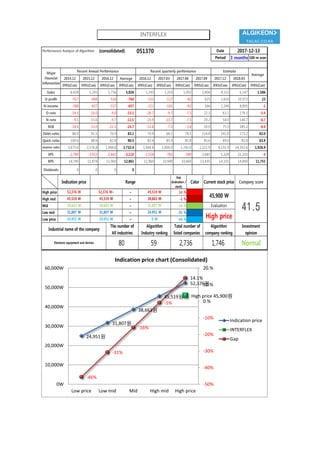
Algorithm stocks Trading Strategies (consolidated) 051370 Date
Period
Gap
(Indication /
stock)
Color
low price 24,951 W 24,951 W ~ 0 W -46 % 355,224 W 14
Low mid 31,807 W 31,807 W ~ 24,951 W -31 % 238,967 W 8
Mid 38,663 W 38,663 W ~ 31,807 W -16 % 122,709 W 3
High mid 45,519 W 45,519 W ~ 38,663 W -1 % 6,452 W 0
Suggested Purchase
Amount 778,309 W
Number of stocks
purchased 17
Indication price Range Buying / Selling Buying / Selling [Stocks]
High price 52,376 W 52,376 W~ ~ 45,519 W 14 % -109,805 W -2
2017-12-13
3 months
Current stock price Evaluation
Stock price rise
probability score
Investment opinion Prospective purchase amount
45,900 W High price 33.7 Normal 3,500,000 W
33.9 45.1 36.7 37.9 43.7 42.4
2017.07.14 2017.08.11 2017.09.11 2017.10.17 2017.11.14 2017.12.12
Stock price rise
probability score
A Sector 47.8 52.6 47.1 50.3 51.1 42.3
33.7B Sector 20.0 37.5 26.3 50.3 36.3 42.5
Total average
2017.09.11 2017.10.17 2017.11.14 2017.12.12
Total of
increase rate
Total score
A Sector 9 % -12 % 6 % 2 % -21 %
3 % 48.3B Sector 47 % -43 % 48 % -39 % 15 %
Total average 25 % -23 % 3 % 13 % -3 %
2017.08.11
48
53
47
50 51
42
20
38
26
50
36
43
34
45
37 38
44 42
0
10
20
30
40
50
60
2017.07.14 2017.08.11 2017.09.11 2017.10.17 2017.11.14 2017.12.12
Stock price rise probability score
A sector
B sector
Total average
9%
-12%
6% 2%
-21%
47%
-43%
48%
-39%
15%
25%
-23%
3%
13%
-3%
-60%
-40%
-20%
0%
20%
40%
60%
2017.08.11 2017.09.11 2017.10.17 2017.11.14 2017.12.12
Increase rate of stock price rise
A sector
B sector
Total average
INTERFLEX](data:image/gif;base64,R0lGODlhAQABAIAAAAAAAP///yH5BAEAAAAALAAAAAABAAEAAAIBRAA7)
Recommended
Recommended
More Related Content
What's hot
What's hot (20)
Similar to INTERFLEX-051370-Algorithm Investment Report
Similar to INTERFLEX-051370-Algorithm Investment Report (20)
More from 알고리즘 기업분석 컨설팅-알기컨,algikeon
More from 알고리즘 기업분석 컨설팅-알기컨,algikeon (20)
Recently uploaded
Recently uploaded (20)
INTERFLEX-051370-Algorithm Investment Report
- 1. Performance Analysis of Algorithm (consolidated) 051370 Date Period 3 months 100-m won 2014.12 2015.12 2016.12 Average 2016.12 2017.03 2017.06 2017.09 2017.12 2018.03 IFRS(Con) IFRS(Con) IFRS(Con) IFRS(Con) IFRS(Con) IFRS(Con) IFRS(Con) IFRS(Con) IFRS(Con) IFRS(Con) IFRS(Con) Sales 6,428 5,295 5,756 5,826 1,245 1,203 1,092 2,804 4,152 6,147 1,586 O-profit -917 -848 -516 -760 -333 -117 -82 625 2,619 10,972 23 N-income -588 -827 -557 -657 -322 -165 -82 566 2,244 8,895 -1 O-rate -14.3 -16.0 -9.0 -13.1 -26.7 -9.7 -7.5 22.3 63.1 178.5 -5.4 N-rate -9.1 -15.6 -9.7 -11.5 -25.9 -13.7 -7.5 20.2 54.0 144.7 -6.7 ROE -18.9 -33.0 -22.1 -24.7 -12.8 -7.2 -3.6 20.0 75.5 285.1 -0.9 Debt-ratio 86.9 91.5 70.9 83.1 70.9 64.1 78.1 114.8 141.0 173.2 82.0 Quick-ratio 100.6 88.6 82.4 90.5 82.4 85.9 81.8 85.6 89.0 92.8 83.9 reserve-ratio 3,675.6 2,576.8 1,944.8 2,732.4 1,944.8 1,800.0 1,741.0 2,221.9 4,155.9 14,392.6 1,926.9 EPS -2,789 -3,923 -2,642 -3,118 -1,528 -783 -389 2,685 5,329 21,103 -4 BPS 14,740 11,874 11,969 12,861 11,969 10,940 10,660 13,435 14,101 14,800 11,751 Dividends 0 0 0 0 Major Financial Information Recent Annual Performance Recent quarterly performance Estimate Average 2017-12-13 Gap (Indication / stock) Color High price ~ 14 % High mid ~ -1 % Mid ~ -16 % Low mid ~ -31 % Low price ~ -46 % Normal 24,951 W 24,951 W 0 W Industrial name of the company The number of All industries Algorithm Industry ranking Total number of listed companies Algorithm company ranking Investment opinion Electronic equipment and devices 80 59 2,736 1,746 45,519 W 45,519 W 38,663 W 38,663 W 38,663 W 31,807 W Evaluation 52,376 W 52,376 W~ 45,519 W 45,900 W 41.531,807 W 31,807 W 24,951 W High price Indication price Range Current stock price Company score 24,951원 31,807원 38,663원 45,519원 52,376원 High price 45,900원 -46% -31% -16% -1% 14.1% -50% -40% -30% -20% -10% 0.% 10.% 20.% 0W 10,000W 20,000W 30,000W 40,000W 50,000W 60,000W Low price Low mid Mid High mid High price Indication price chart (Consolidated) Indication price INTERFLEX Gap INTERFLEX
- 2. [Price for scheduled purchasing] Arbitrarily made Algorithm stocks Trading Strategies (consolidated) 051370 Date Period Gap (Indication / stock) Color low price 24,951 W 24,951 W ~ 0 W -46 % 355,224 W 14 Low mid 31,807 W 31,807 W ~ 24,951 W -31 % 238,967 W 8 Mid 38,663 W 38,663 W ~ 31,807 W -16 % 122,709 W 3 High mid 45,519 W 45,519 W ~ 38,663 W -1 % 6,452 W 0 Suggested Purchase Amount 778,309 W Number of stocks purchased 17 Indication price Range Buying / Selling Buying / Selling [Stocks] High price 52,376 W 52,376 W~ ~ 45,519 W 14 % -109,805 W -2 2017-12-13 3 months Current stock price Evaluation Stock price rise probability score Investment opinion Prospective purchase amount 45,900 W High price 33.7 Normal 3,500,000 W 33.9 45.1 36.7 37.9 43.7 42.4 2017.07.14 2017.08.11 2017.09.11 2017.10.17 2017.11.14 2017.12.12 Stock price rise probability score A Sector 47.8 52.6 47.1 50.3 51.1 42.3 33.7B Sector 20.0 37.5 26.3 50.3 36.3 42.5 Total average 2017.09.11 2017.10.17 2017.11.14 2017.12.12 Total of increase rate Total score A Sector 9 % -12 % 6 % 2 % -21 % 3 % 48.3B Sector 47 % -43 % 48 % -39 % 15 % Total average 25 % -23 % 3 % 13 % -3 % 2017.08.11 48 53 47 50 51 42 20 38 26 50 36 43 34 45 37 38 44 42 0 10 20 30 40 50 60 2017.07.14 2017.08.11 2017.09.11 2017.10.17 2017.11.14 2017.12.12 Stock price rise probability score A sector B sector Total average 9% -12% 6% 2% -21% 47% -43% 48% -39% 15% 25% -23% 3% 13% -3% -60% -40% -20% 0% 20% 40% 60% 2017.08.11 2017.09.11 2017.10.17 2017.11.14 2017.12.12 Increase rate of stock price rise A sector B sector Total average INTERFLEX
- 3. 정보와 완전 정보 결 투자판단 있습니 위배 무단으 숙지하 Compliance notice ① The information provided by The Algorithm Company Analysis Consulting is obtained through reliable data and information and The Algorithm Company Analysis Program (TACAP), but its accuracy or completeness are not guaranteed. Furthermore, it may change over time.Therefore, we are not legally responsible for the results of the data provided by The Algorithm Company Analysis Consulting because of information errors or omissions. ② The Algorithm Company Analysis Consulting and all the information provided on it site are reference materials for investment decisions and the final responsibility of investment is up to users utilizing this information. ③ The Algorithm Company Analysis Consulting and its site do not do anything that violates the related laws such as discretionary transaction. ④ Users can not reallocate and recycle the information provided by The Algorithm Company Analysis Consulting firm let alone the information provided by its Site. ⑤ Be sure to know about application period of this algorithm analysis report in order to improve its accuracy. Tel : 070 - 4667 - 5009 Email : tacac@tacac.co.kr Homepage : tacac.co.kr Blog : tacac.blog.me SERVICES M&A, IPO, CORPORATE RESTRUCTURING, MANAGEMENT OF TECHNOLOGY, BUSINESS STRATEGY, FAMILY BUSINESS Request : http://tacac.co.kr/?page_id=1374 ① Consulting The Algori accuracy o change ove results of Consulting ② informatio investmen up ③ do anythin transaction ④ The Algori informatio ⑤ analysis re