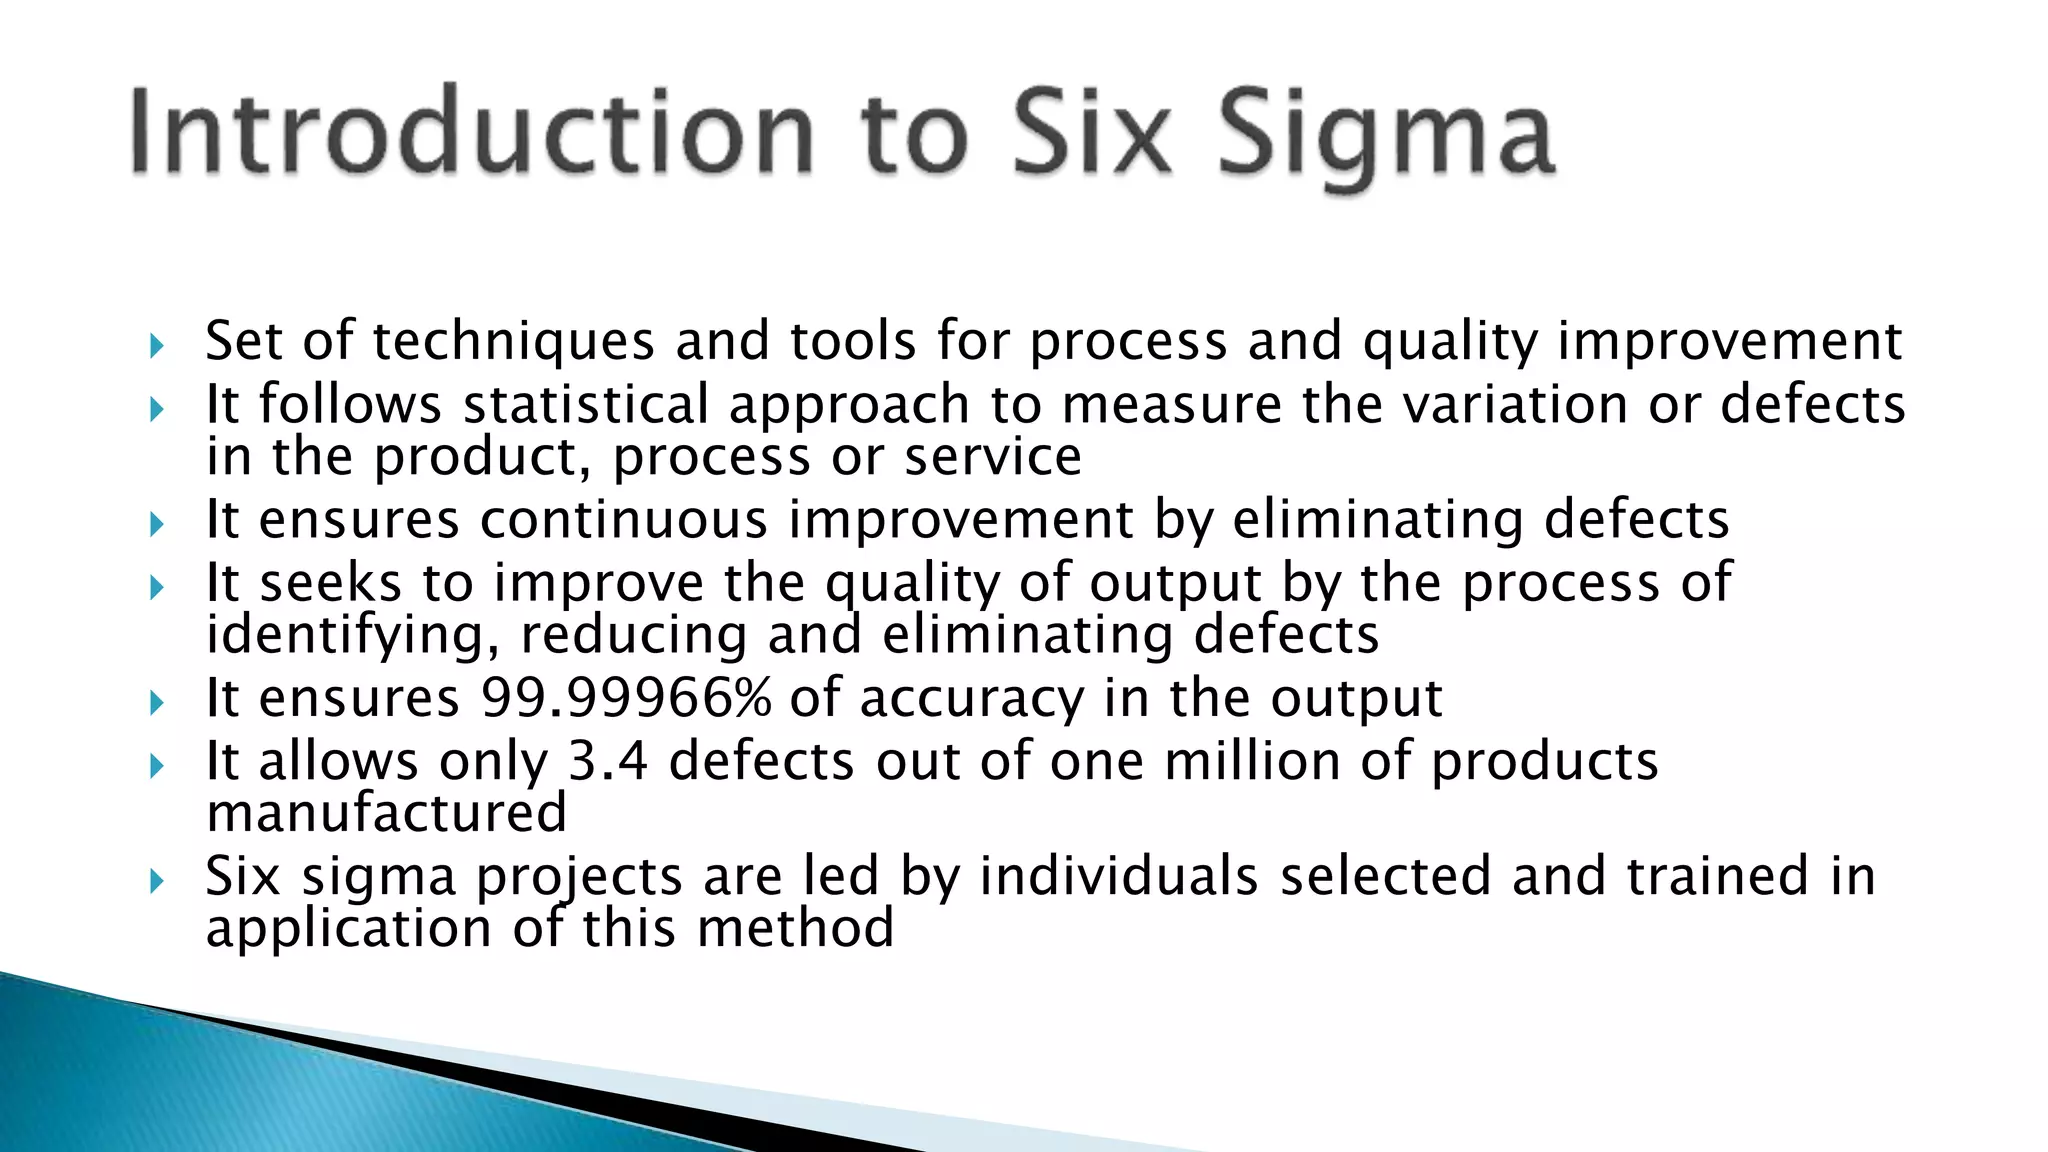
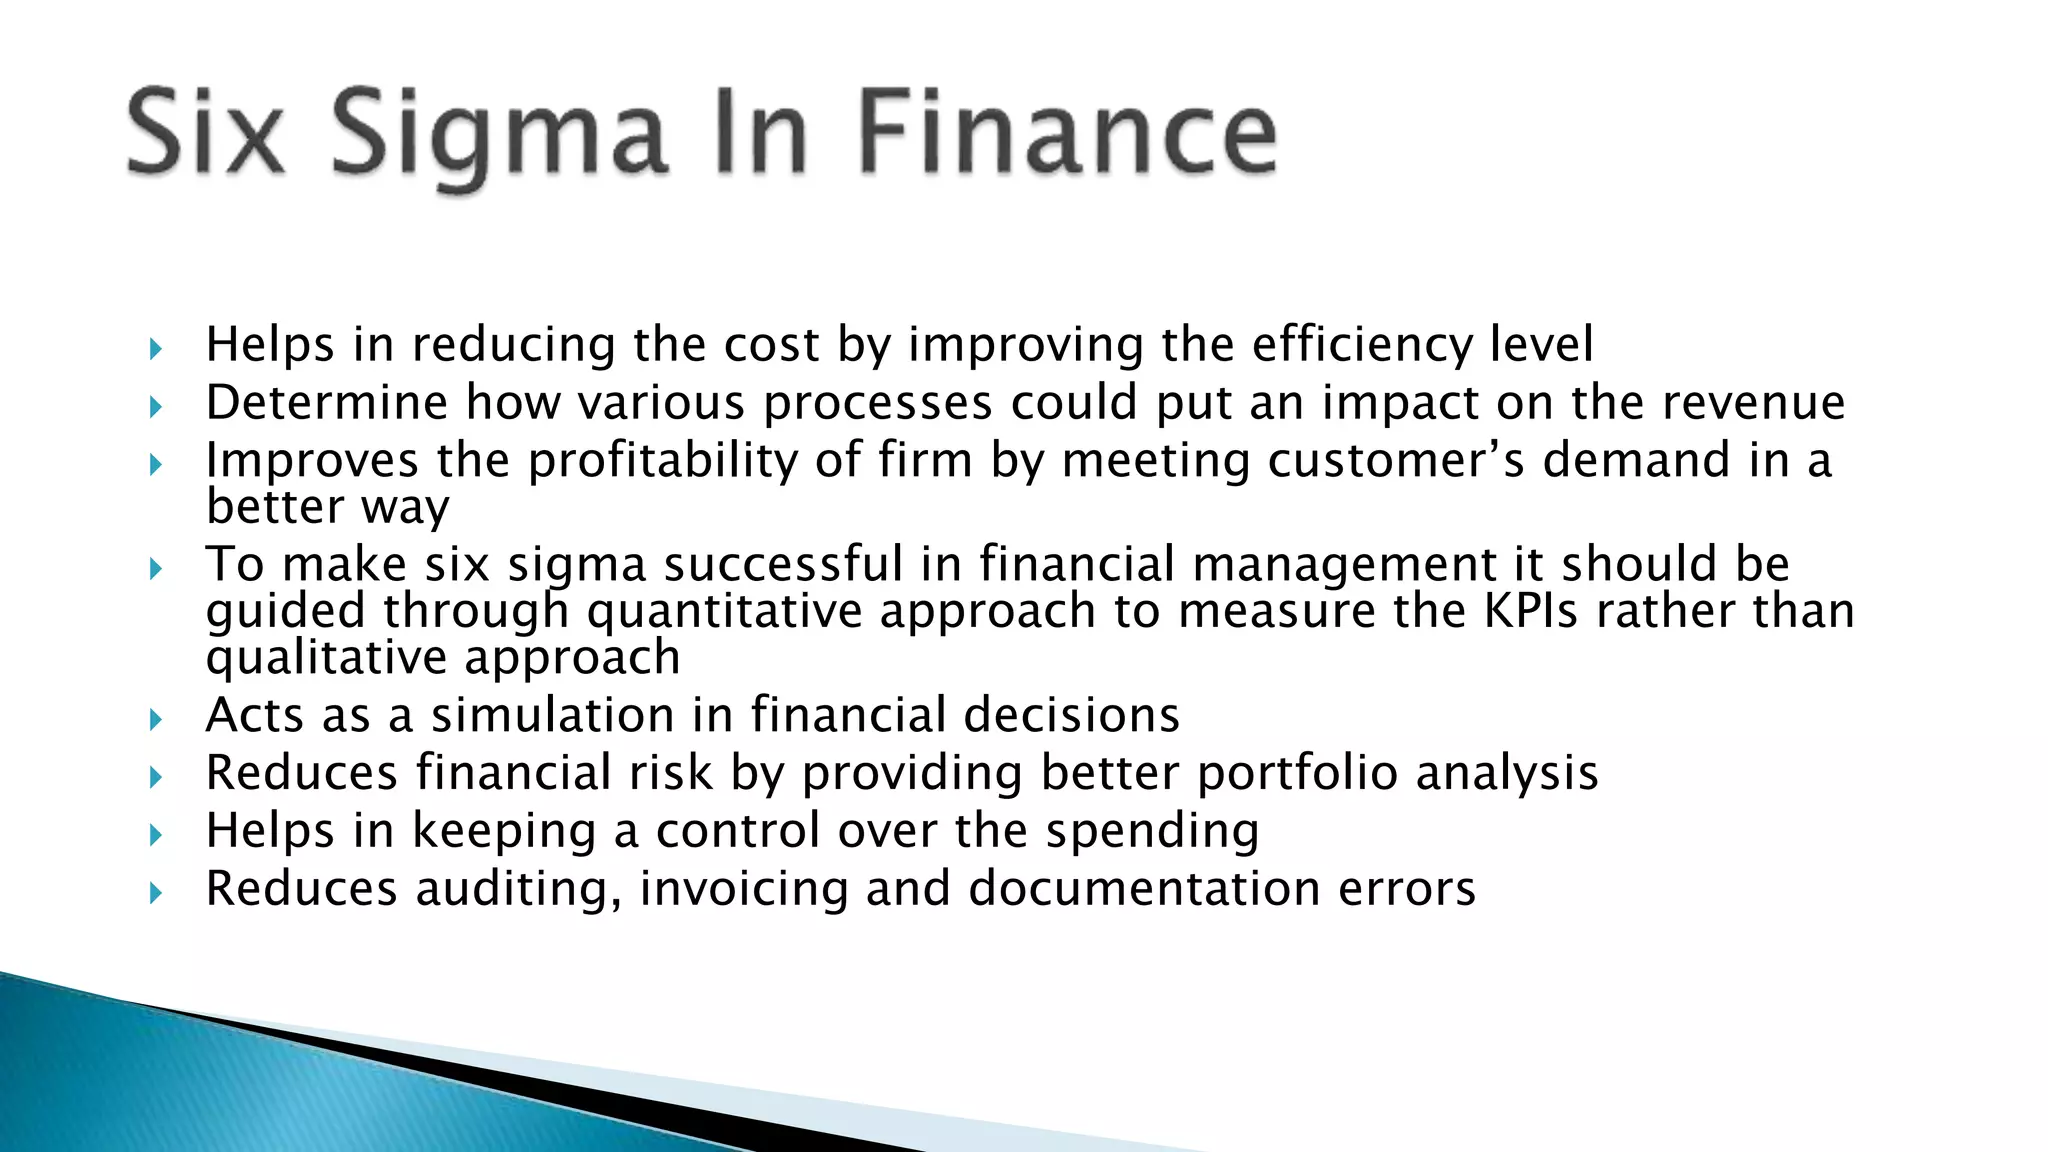
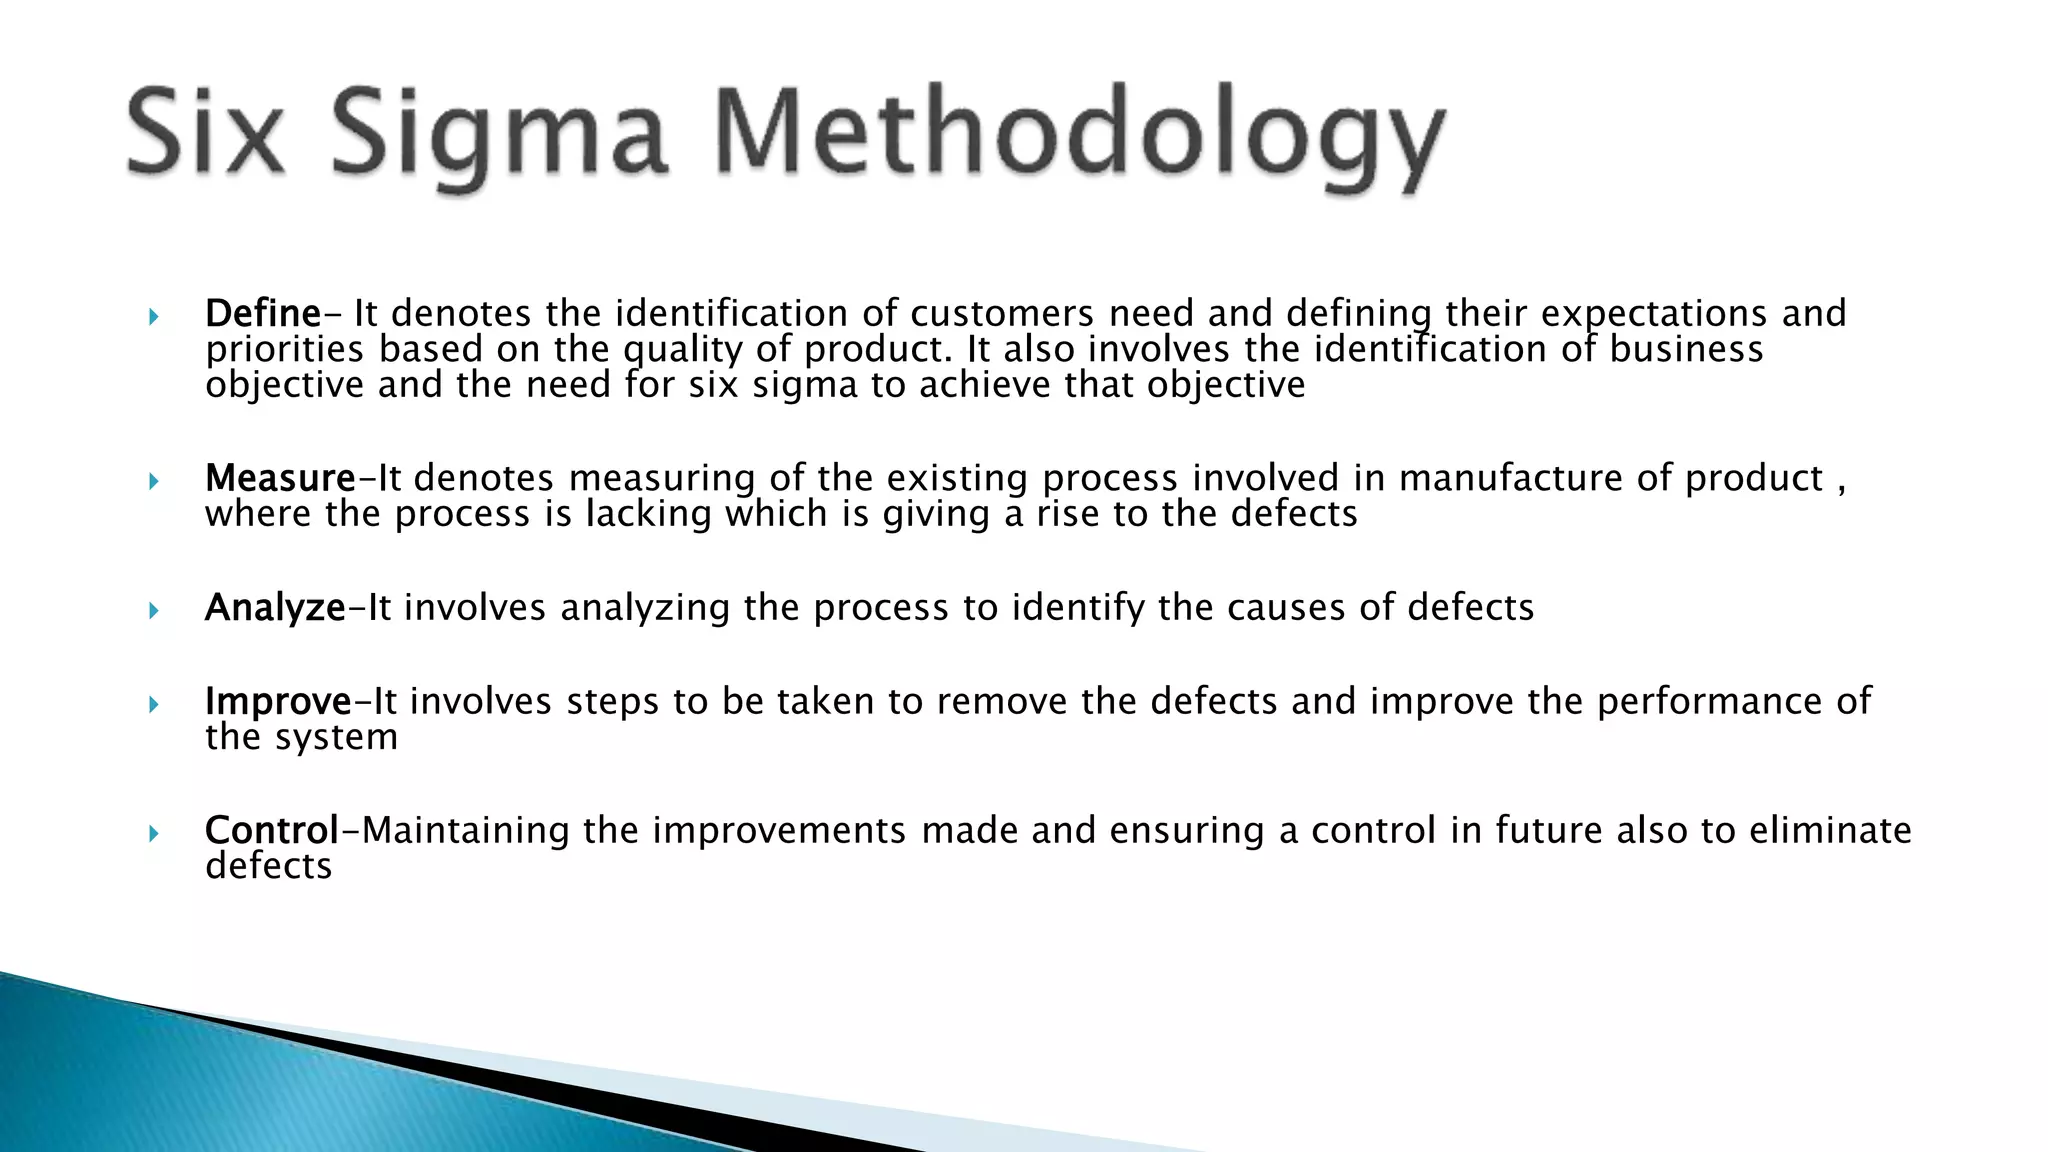
 Introduction to Six Sigma
 Normal Distribution Curve and Related Value
 Six Sigma in Finance
 Methodology
 Organization Structure
 Benefits
 Analytical Tools
 Set of techniques and tools for process and quality improvement
 It follows statistical approach to measure the variation or defects
in the product, process or service
 It ensures continuous improvement by eliminating defects
 It seeks to improve the quality of output by the process of
identifying, reducing and eliminating defects
 It ensures 99.99966% of accuracy in the output
 It allows only 3.4 defects out of one million of products
manufactured
 Six sigma projects are led by individuals selected and trained in
application of this method
Sigma Level Defects per million Accuracy
1 sigma 3,17,300 ppm 68.27%
2 sigma 45,500 ppm 95.45%
3 sigma 2700 ppm 99.73%
4 sigma 63 ppm 999.9937%
5 sigma 57 ppm 99.9943%
6 sigma 3.4 ppm 99.99966%
 Helps in reducing the cost by improving the efficiency level
 Determine how various processes could put an impact on the revenue
 Improves the profitability of firm by meeting customer’s demand in a
better way
 To make six sigma successful in financial management it should be
guided through quantitative approach to measure the KPIs rather than
qualitative approach
 Acts as a simulation in financial decisions
 Reduces financial risk by providing better portfolio analysis
 Helps in keeping a control over the spending
 Reduces auditing, invoicing and documentation errors
 Define- It denotes the identification of customers need and defining their expectations and
priorities based on the quality of product. It also involves the identification of business
objective and the need for six sigma to achieve that objective
 Measure-It denotes measuring of the existing process involved in manufacture of product ,
where the process is lacking which is giving a rise to the defects
 Analyze-It involves analyzing the process to identify the causes of defects
 Improve-It involves steps to be taken to remove the defects and improve the performance of
the system
 Control-Maintaining the improvements made and ensuring a control in future also to eliminate
defects
 Quality leader- These are the executives or managers who guide the direction of six
sigma professionals in the direction of organization’s objective.
 Master Black Belt- These are the six sigma professionals trained in depth with six sigma
tools and techniques for process improvement. They are involves in taking strategic
decisions and training black belt and green belt members.
 Black Belt- These professionals work and lead the projects on quality improvement.
They train and coaches project team members.
 Green Belt- They assist in completing the projects by doing data analysis.
 Yellow Belt- This belt is provided on completion of the basic foundational course on six
sigma.
 Improved quality of the products with minimal defect
 Reduced cycle time with improved process
 Improved efficiency and productivity leading to better output
 Increased customer satisfaction and customer equity
 Removal of non-value adding activities
 Gained reputation for reliable product and services
 Better revenue generation by achieving competitive advantage
on quality
 Flowcharts:- This chart depicts the whole process involved right from the supplier to the customer. It
helps in analyzing the process from input to output defining each stage involved
 Run-charts:- These charts are used to observe the data patterns to figure out the trend. It thus helps in
making predictions
 Pareto-charts:- These charts are based on the pareto principle that says about 80% of problems occur
due to 20% causes. Example – 80% of customer complaints are due to bad quality of product
 Check-sheets:- Check-sheets helps in systematically collect and store data with the use of tally or
frequency distribution
 Cause and effect diagram:- Diagrams showing various causes and related effects
 Process control charts:- Time sequenced charts to keep a control over the activities completion time in
the project
 Failure mode and effect analysis:- This is an analysis process done to figure out what would be the
impact level for various failures
 Like
 Subscribe
 Share

Six sigma & finance

  • 2.
     Introduction toSix Sigma  Normal Distribution Curve and Related Value  Six Sigma in Finance  Methodology  Organization Structure  Benefits  Analytical Tools
  • 3.
     Set oftechniques and tools for process and quality improvement  It follows statistical approach to measure the variation or defects in the product, process or service  It ensures continuous improvement by eliminating defects  It seeks to improve the quality of output by the process of identifying, reducing and eliminating defects  It ensures 99.99966% of accuracy in the output  It allows only 3.4 defects out of one million of products manufactured  Six sigma projects are led by individuals selected and trained in application of this method
  • 5.
    Sigma Level Defectsper million Accuracy 1 sigma 3,17,300 ppm 68.27% 2 sigma 45,500 ppm 95.45% 3 sigma 2700 ppm 99.73% 4 sigma 63 ppm 999.9937% 5 sigma 57 ppm 99.9943% 6 sigma 3.4 ppm 99.99966%
  • 6.
     Helps inreducing the cost by improving the efficiency level  Determine how various processes could put an impact on the revenue  Improves the profitability of firm by meeting customer’s demand in a better way  To make six sigma successful in financial management it should be guided through quantitative approach to measure the KPIs rather than qualitative approach  Acts as a simulation in financial decisions  Reduces financial risk by providing better portfolio analysis  Helps in keeping a control over the spending  Reduces auditing, invoicing and documentation errors
  • 7.
     Define- Itdenotes the identification of customers need and defining their expectations and priorities based on the quality of product. It also involves the identification of business objective and the need for six sigma to achieve that objective  Measure-It denotes measuring of the existing process involved in manufacture of product , where the process is lacking which is giving a rise to the defects  Analyze-It involves analyzing the process to identify the causes of defects  Improve-It involves steps to be taken to remove the defects and improve the performance of the system  Control-Maintaining the improvements made and ensuring a control in future also to eliminate defects
  • 8.
     Quality leader-These are the executives or managers who guide the direction of six sigma professionals in the direction of organization’s objective.  Master Black Belt- These are the six sigma professionals trained in depth with six sigma tools and techniques for process improvement. They are involves in taking strategic decisions and training black belt and green belt members.  Black Belt- These professionals work and lead the projects on quality improvement. They train and coaches project team members.  Green Belt- They assist in completing the projects by doing data analysis.  Yellow Belt- This belt is provided on completion of the basic foundational course on six sigma.
  • 9.
     Improved qualityof the products with minimal defect  Reduced cycle time with improved process  Improved efficiency and productivity leading to better output  Increased customer satisfaction and customer equity  Removal of non-value adding activities  Gained reputation for reliable product and services  Better revenue generation by achieving competitive advantage on quality
  • 10.
     Flowcharts:- Thischart depicts the whole process involved right from the supplier to the customer. It helps in analyzing the process from input to output defining each stage involved  Run-charts:- These charts are used to observe the data patterns to figure out the trend. It thus helps in making predictions  Pareto-charts:- These charts are based on the pareto principle that says about 80% of problems occur due to 20% causes. Example – 80% of customer complaints are due to bad quality of product  Check-sheets:- Check-sheets helps in systematically collect and store data with the use of tally or frequency distribution  Cause and effect diagram:- Diagrams showing various causes and related effects  Process control charts:- Time sequenced charts to keep a control over the activities completion time in the project  Failure mode and effect analysis:- This is an analysis process done to figure out what would be the impact level for various failures
  • 11.