Downloaded 803 times

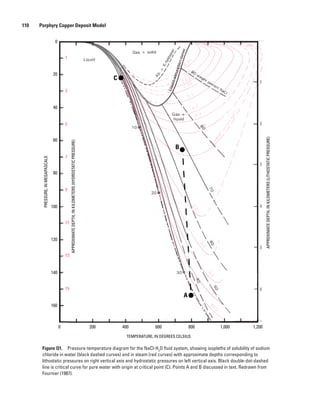
![xii
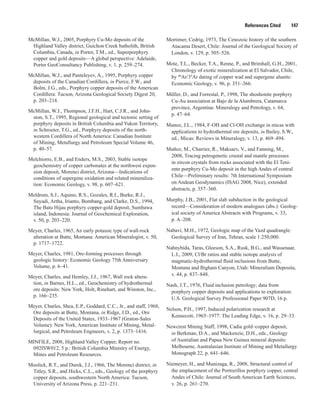
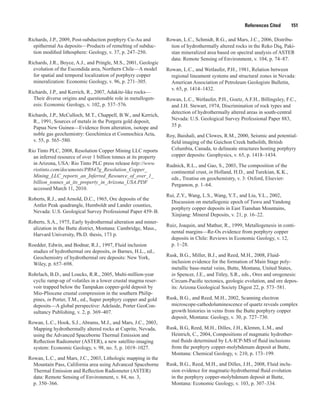
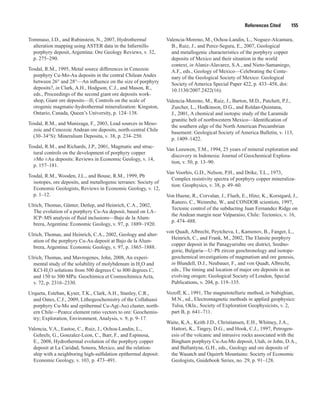
Temperature in degrees Celsius (°C) may be converted to degrees Fahrenheit (°F) as follows:
°F=(1.8×°C)+32
Temperature in degrees Fahrenheit (°F) may be converted to degrees Celsius (°C) as follows:
°C=(°F-32)/1.8
Altitude, as used in this report, refers to distance above the vertical datum.
*Transmissivity: The standard unit for transmissivity is cubic foot per day per square foot times
foot of aquifer thickness [(ft3
/d)/ft2
]ft. In this report, the mathematically reduced form, foot
squared per day (ft2
/d), is used for convenience.
Specific conductance is given in microsiemens per centimeter at 25 degrees Celsius (µS/cm
at 25°C).
Concentrations of chemical constituents in water are given either in milligrams per liter (mg/L)
or micrograms per liter (µg/L).
NOTE TO USGS USERS: Use of hectare (ha) as an alternative name for square hectometer (hm2
)
is restricted to the measurement of small land or water areas. Use of liter (L) as a special name
for cubic decimeter (dm3
) is restricted to the measurement of liquids and gases. No prefix other
than milli should be used with liter. Metric ton (t) as a name for megagram (Mg) should be
restricted to commercial usage, and no prefixes should be used with it.](https://image.slidesharecdn.com/sir2010-5070bporphyry-130509115606-phpapp01/85/Porphyry-Copper-Deposit-Model-14-320.jpg)
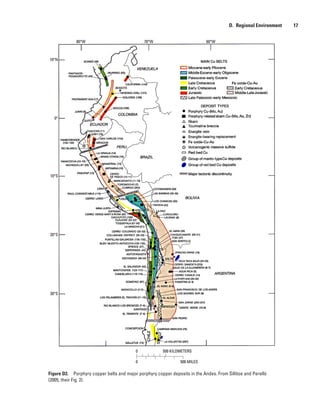
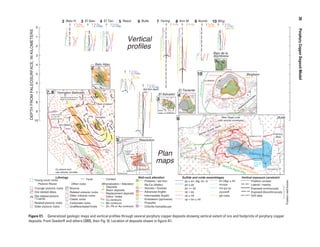
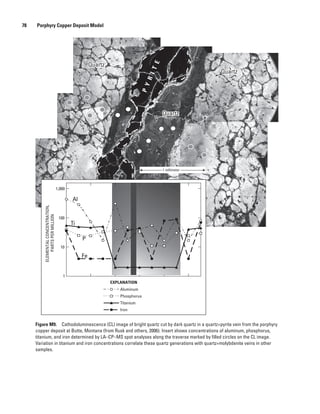
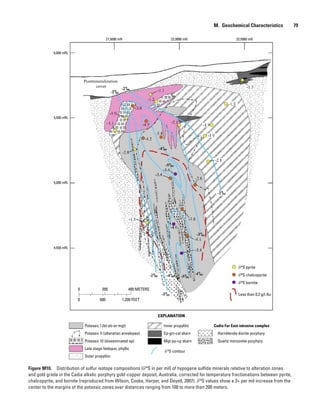
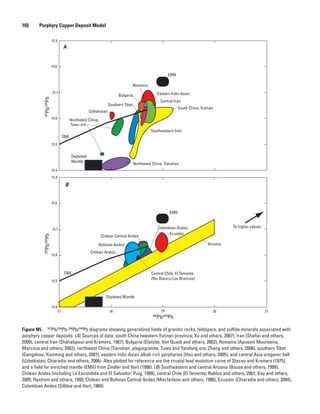
![24 Porphyry Copper Deposit Model
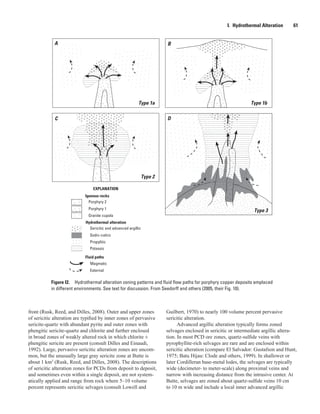
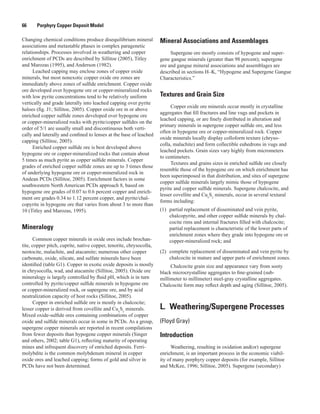
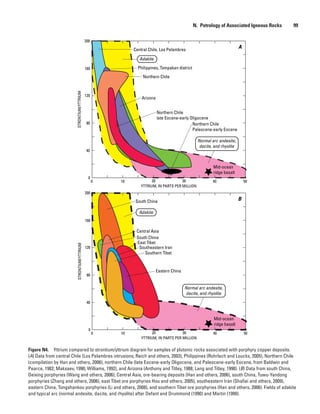
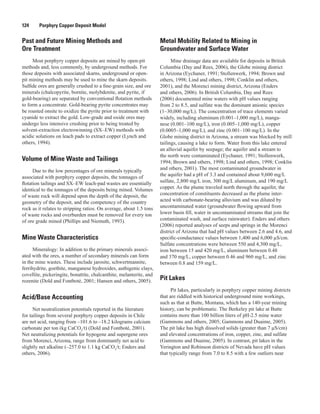
others, 2008). Structural and geological reconstructions of
normal-faulted terranes present enormous research challenges
but also can provide greatly improved targeting for the many
undiscovered Laramide porphyry deposits that likely remain
in the Southwestern United States (consult Seedorff and
others, 2008).
Although strike-slip faults less commonly cut older
porphyry copper deposits, the West Fissure and other Miocene
faults of northern Chile have offset several large deposits.
The West Fissure sinistrally offsets the Eocene El Abra-
Fortuna granodiorite complex by 35 km (Dilles and others,
1997; Tomlinson and Blanco, 1997) and truncates the western
margin of the enormous Chuquicamata deposit (Ossandón
and others, 2001). The MM deposit possibly represents an
economic part of Chuquicamata displaced in fault slivers
about 10 km southward (consult Sillitoe and others, 1996).
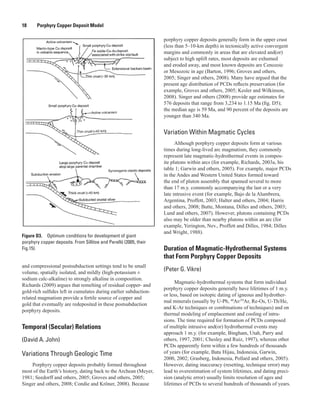
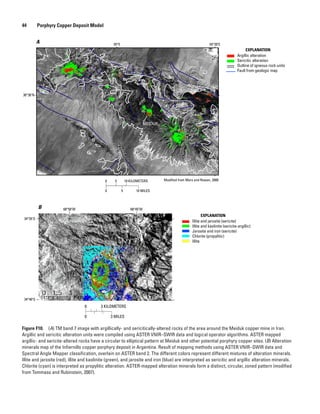
Relations to Igneous Rocks
(David A. John)
Porphyry copper deposits are centered in high-level
intrusive complexes that commonly include stocks, dikes,
and breccia pipes. Many deposits are focused on swarms of
porphyry dikes that may form apotheses on larger intrusions
or batholiths (for example, El Salvador, Chile, Gustafson
and Hunt, 1975; Yerington and Ann-Mason, Nev., Dilles and
Proffett, 1995; Proffett, 2009). The deposits are formed at
shallow (mostly 6 km or less) depth by fluids exsolved from
crystallizing magmas emplaced at about 3.5–10-km depth in
the upper crust (for example, Burnham, 1979; Sillitoe and
Hedenquist, 2003; Richards, 2003a). Most known deposits
are genetically related to intermediate to felsic calc-alkaline
magmas in volcano-plutonic arcs above active subduction
zones (fig. D1A; see summary in “Geotectonic Environment”
section). These shallow, subvolcanic complexes typically are
composed of multiple intrusions of varying composition, as
summarized in section N, “Petrology of Associated Igneous
Rocks.” Porphyry copper mineralization commonly forms
near the end of the evolution of intrusive centers, and mineral-
ized volcanic wall rocks may be significantly older than the
ages of the intrusive rocks and ore formation (see “Temporal
(Secular) Relations”).
Relations to Sedimentary Rocks
(David A. John)
Sedimentary rocks are common in many districts and
may host other important mineral deposits genetically related
to porphyry copper systems, including skarn, manto, replace-
ment, and vein deposits mined principally for copper, iron,
gold, silver, lead, and(or) zinc (for example, West Mountain
[Bingham] district in Utah, Babcock and others, 1995; Arizona
porphyry systems, Einaudi, 1982a,b).
Sedimentary wall rocks can also influence the char-
acteristics of porphyry copper deposits, such as shape and
grade. They can be sources of external fluids, salts, and other
components that result in variations in types of alteration, for
example sodic-calcic and some propylitic alteration (Dilles
and Einaudi, 1992; Dilles and others, 1992). External fluids
in porphyry copper deposits vary from dilute meteoric waters
to hypersaline brines; the latter generally are present at depth
although they may impinge on some deposits from near-
surface evaporitic/playa lake environments.
Relations to Metamorphic Rocks
(David A. John)
Metamorphic rocks locally host ore in porphyry copper
deposits, but regional metamorphism does not contribute
to porphyry copper ore formation. Contact metamorphism
(thermal and metasomatic) is ubiquitous where unmeta-
morphosed wall rocks are present in porphyry districts (for
example, Barton and others, 1988; Barton, Staude, and others,
1991). Thermal metamorphism, resulting in hornfels and
marble, commonly precedes porphyry copper and skarn miner-
alization (for example, Einaudi and others, 1981). Metamor-
phism modifies the mechanical properties and permeability
of host rocks and thus can affect hydrology of the fluids. For
example, formation of massive marble can decrease perme-
ability and restrict flow into intrusive rocks. Sillitoe (1997)
noted that many gold-rich giant porphyry copper deposits
(those containing more than 200 metric tons gold) are hosted
by relatively impermeable marble or limestone or other meta-
morphic rocks (for example, Grasberg, Indonesia).
Porphyry ore formation and metasomatism are both
metamorphic processes and can have the same fluid sources
as metamorphic rocks. Thermally metamorphosed rocks and
other measures of thermal change (for example, conodont
alteration) can be indicators of nearby heat sources and of ore-
forming processes in nearby intrusive rocks.
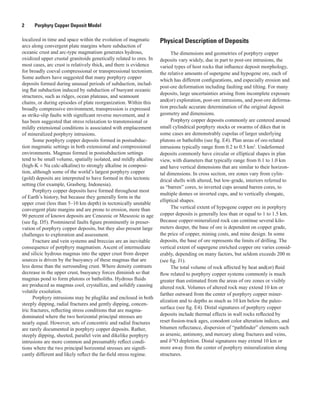
E. Physical Description of Deposits
(David A. John)
The dimensions and geometries of porphyry copper
deposits vary widely, due in part to post-ore intrusions, the
varied types of host rocks that influence deposit morphology,
the relative amounts of supergene and hypogene ore, each of
which has different configurations, and especially, erosion and
post-ore deformation including faulting and tilting. For many
deposits, large uncertainties arising from incomplete exposure
and(or) exploration, post-ore intrusions, and post-ore deforma-
tion preclude accurate determination of the original deposit
geometry and dimensions.](https://image.slidesharecdn.com/sir2010-5070bporphyry-130509115606-phpapp01/85/Porphyry-Copper-Deposit-Model-38-320.jpg)
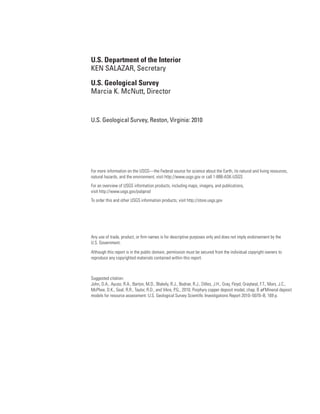
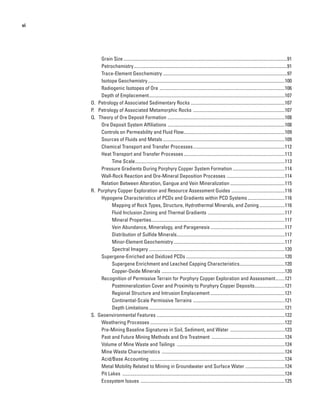
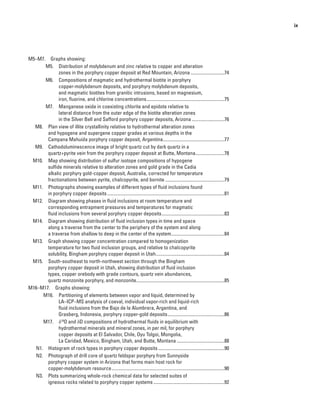
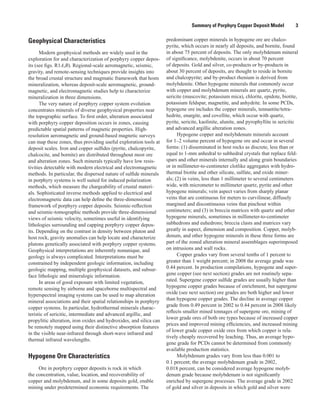
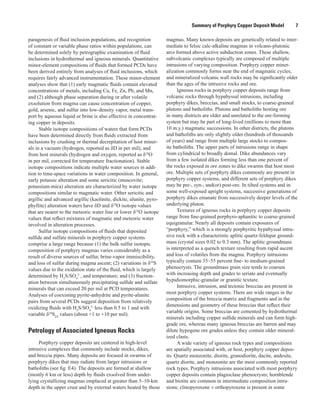
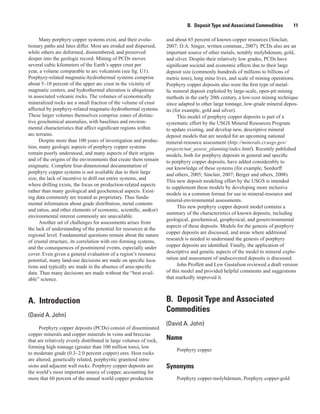
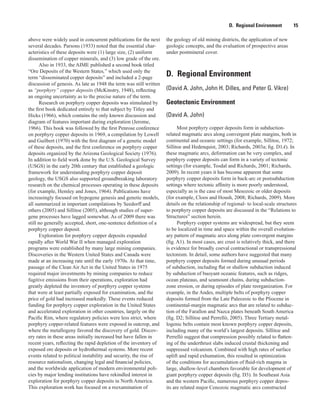
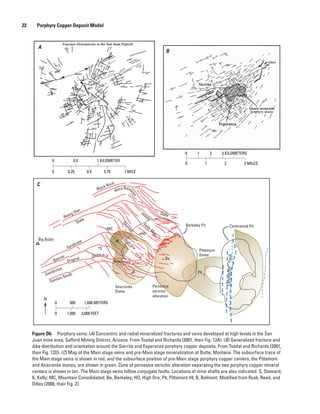
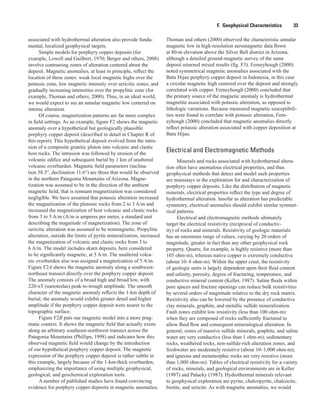
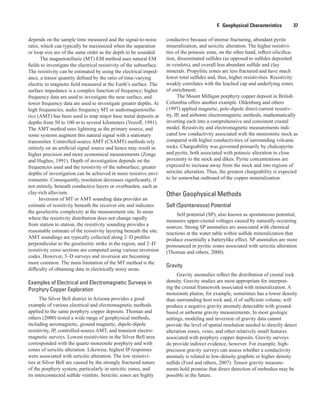
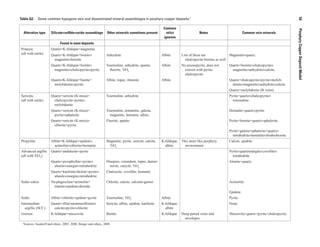
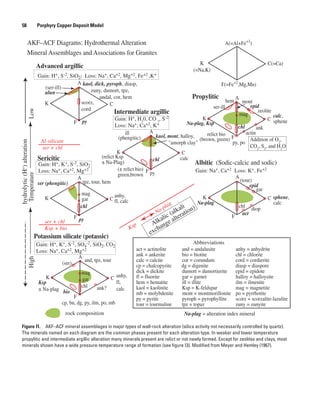
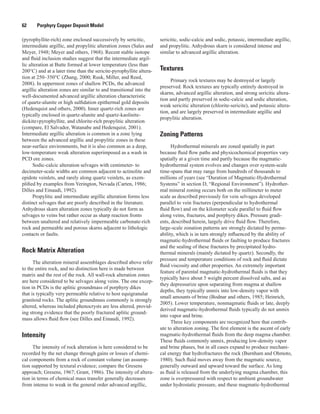
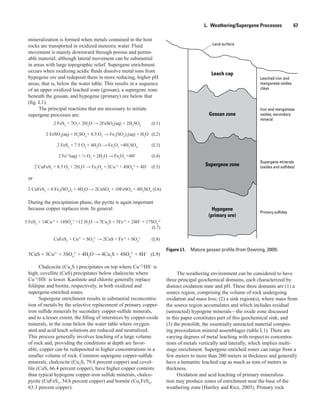
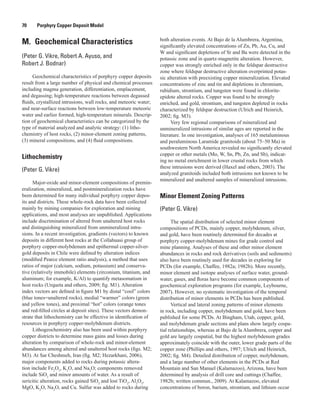
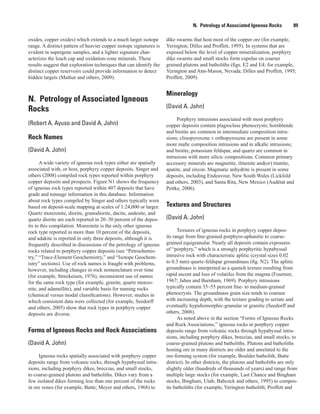
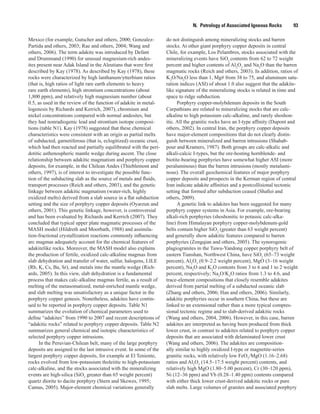
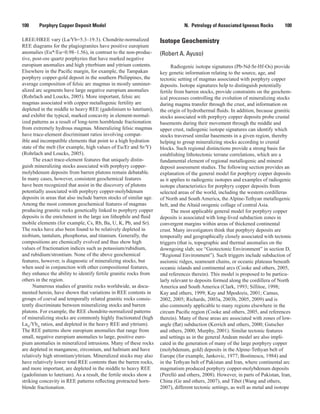
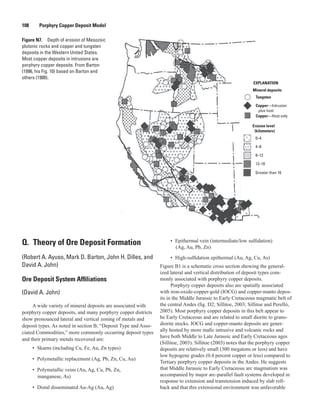
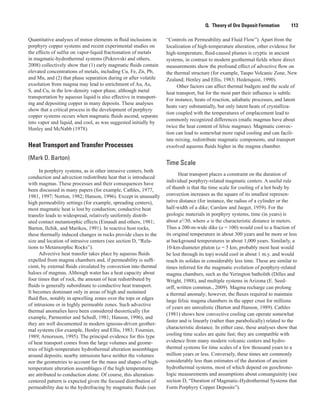
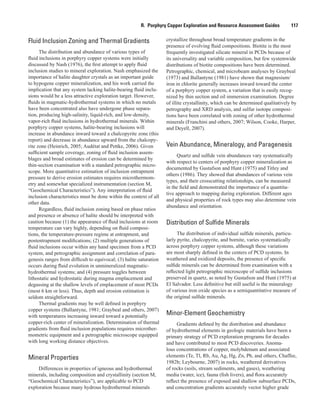
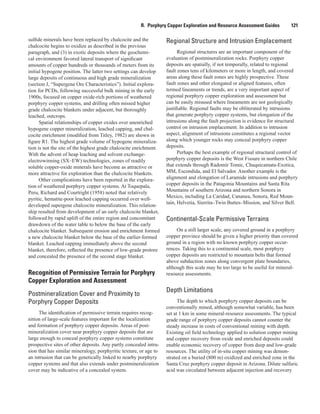
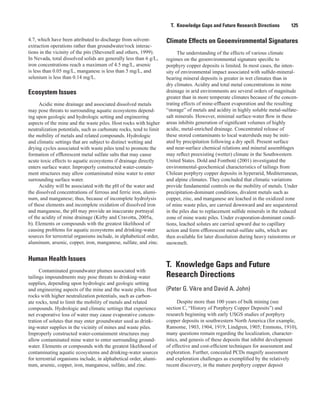
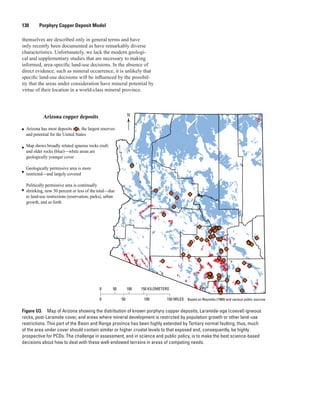
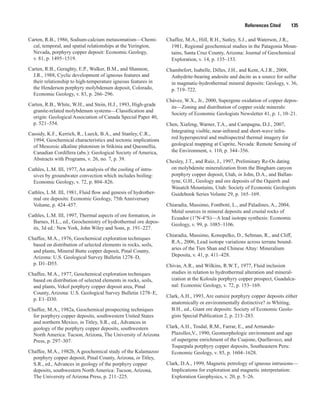
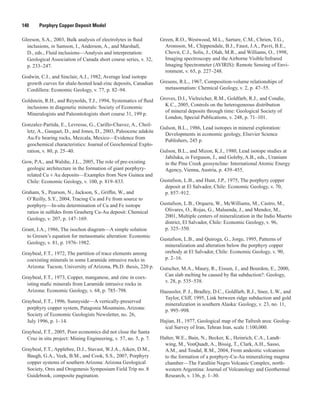
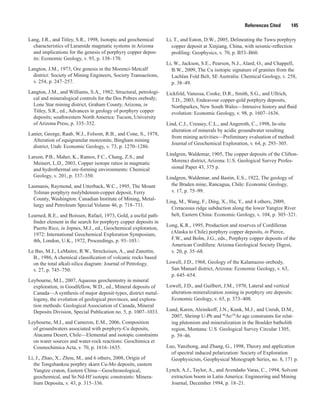
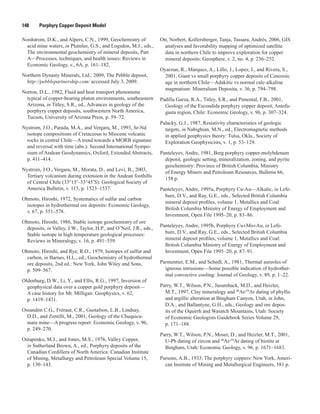
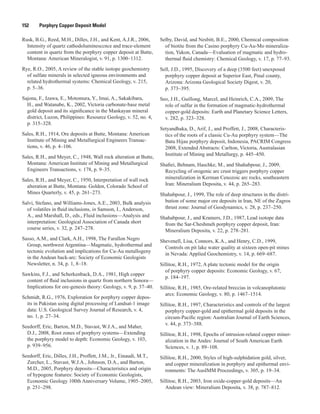
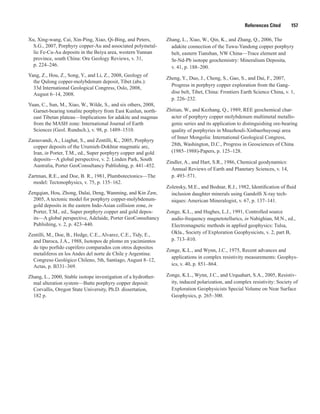
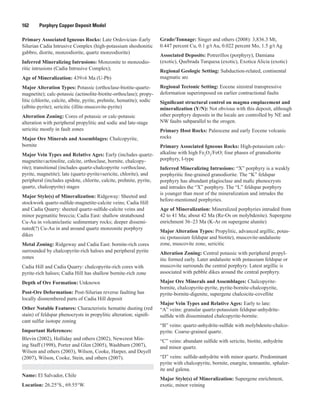
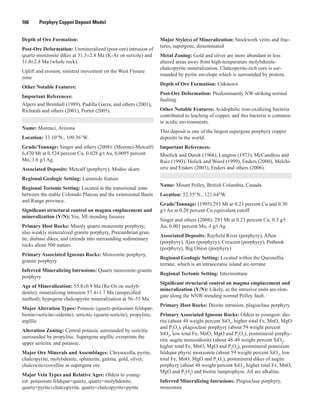
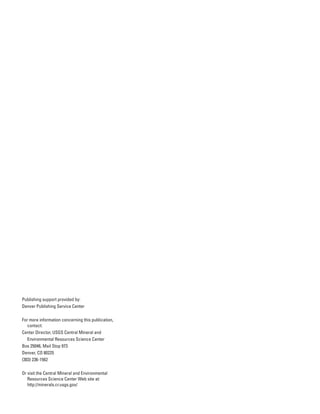
![Table E1. Summary statistics of areas of ore, sulfides, and
altered rock in porphyry copper deposits compiled in Singer and
others (2008).
[km2
, square kilometers]
Statistic
Area of
ore
Area of
sulfides
Area of
alteration
Mean (km2
) 1.25 7.4 8.9
Median (km2
) 0.6 3.7 5.1
Maximum (km2
) 28 89 82
Minimum (km2
) 0.02 0.18 0.24
Number of deposits 174 173 184
28 Porphyry Copper Deposit Model
of the hydrothermal system extended at least 10 km outward
from the center of porphyry copper mineralization and left
a “paleothermal anomaly” in the distant wall rocks of the
porphyry copper deposit (fig. E3).
In the Battle Mountain district of Nevada, Roberts and
Arnold (1965) and Kotylar and others (1998) described
geochemical zoning around the Copper Canyon porphyry
copper deposit. Metals were progressively enriched outward
from a copper-gold-silver zone centered on the porphyry
copper deposit, to a gold-silver zone in gold-rich skarn
deposits (Fortitude, Phoenix), to silver-lead-zinc zone in poly
metallic veins, and finally to antimony-rich veins over a lateral
distance of about 8 km from the porphyry copper center.
The vertical extent and variation of hydrothermal systems
related to porphyry copper deposits have been studied in tilted
crustal blocks containing porphyry copper deposits, notably
in the Yerington district of Nevada (Proffett, 1977; Dilles,
1987; Dilles and Proffett, 1995) and for several deposits in
southern Arizona (Seedorff and others, 2008; Stavast and
others, 2008). These studies show that hydrothermal alteration,
especially sodic-calcic and greisen types, may extend as much
as 10 km below the paleosurface, 5 km or more below the top
of the porphyry system, and 3 km or more below the base of
economic copper mineralization. The vertical variations in
hydrothermal alteration are discussed in detail in section I,
“Hydrothermal Alteration.”
Host Rocks
Porphyry copper deposits may be hosted by almost any
type of rock, although most deposits are associated with shal-
lowly emplaced, intermediate to silicic composition, intrusive
complexes composed of small stocks, dikes, and breccias that
in some cases are shown to be cupolas on larger plutons and
batholiths (fig. E4). Ore deposition commonly is temporally
and spatially associated with emplacement of sets of porphyry
dikes (fig. E2; for example, Gustafson and Hunt, 1975; Prof-
fett, 2009). Most copper ore is hosted by the intrusive rocks,
although volcanic and sedimentary wall rocks of the intrusions
also host copper ore in some deposits, and significant copper,
gold, silver, lead, zinc, and iron deposits may be hosted by
nearby sedimentary and volcanic rocks (for example, Bingham
Canyon, Utah, Babcock and others, 1995; Copper Canyon,
Nevada, Theodore, 2000).
Structural Setting(s) and Controls
The structural settings of porphyry copper deposits are
diverse and complex, and there is no universal agreement on
favorability and control of particular structural settings on
localization of porphyry copper deposits (for example, Tosdal
and Richards, 2001; Richards, 2003a; Drew, 2006). Tosdal
and Richards (2001, p. 174) note “A review of the structural
settings of porphyry copper deposits indicates that there are no
unique environments into which these deposits are emplaced.”
Most deposits form in magmatic arcs, commonly during
regional compression, although many porphyry copper related
magmas apparently are emplaced in transtensional zones. See
“Relations to Structure” in section D, Regional Environment,
for a more thorough discussion of regional, local, and deposit-
scale structures and porphyry copper deposits.
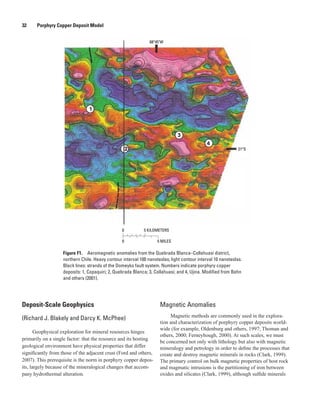
F. Geophysical Characteristics
(Richard J. Blakely, Darcy K. McPhee, and
John C. Mars)
Introduction
(Richard J. Blakely and Darcy K. McPhee)
Modern geophysical methods contribute at all scales in
the exploration for and characterization of porphyry copper
deposits. At regional scales, aeromagnetic, seismic, gravity,
and remote-sensing techniques provide insights into the
broad crustal structure and magmatic setting of mineralized
zones. Fault zones, sedimentary basins, and plutons can be
mapped and characterized with gravity and magnetic methods,
thereby illuminating crustal frameworks that host porphyry
copper deposits.
Geophysical techniques also contribute at deposit scales.
The very nature of porphyry copper evolution concentrates
minerals of diverse geophysical properties near the topo-
graphic surface. The distribution of magnetite content within
a porphyry copper deposit, for example, ranges from abundant
to nonexistent, depending on type and intensity of altera-
tion and parent lithology. To a first approximation, alteration
associated with porphyry copper deposition occurs in zones,
causing predictable spatial patterns of magnetic anomalies.
High-resolution airborne and ground-based magnetic surveys
can potentially map these zones, thus providing useful
exploration tools at deposit scales. Iron and copper sulfides](https://image.slidesharecdn.com/sir2010-5070bporphyry-130509115606-phpapp01/85/Porphyry-Copper-Deposit-Model-42-320.jpg)
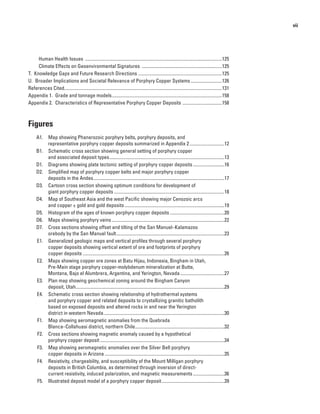
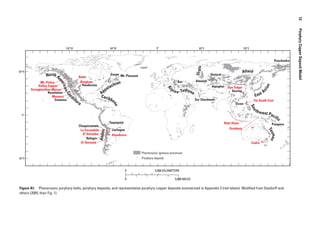
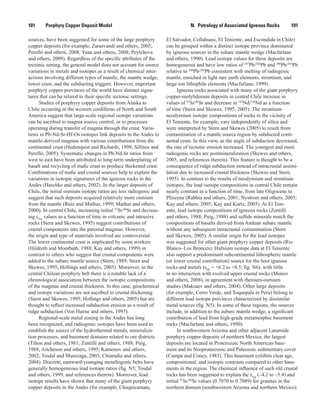
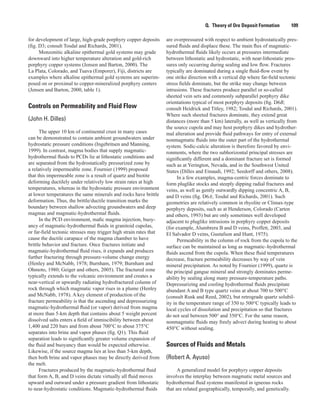
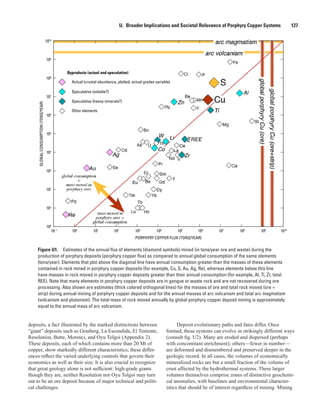
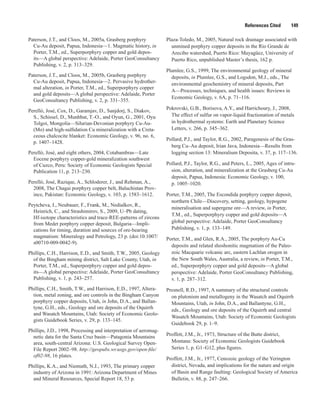
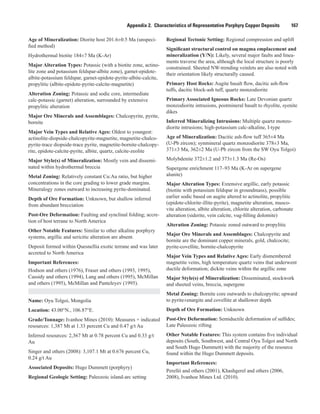
![A. Ore minerals
Percentage
of deposits
B. Sulfide and
telluride minerals
Percentage
of deposits
C. Silicate minerals
Percentage
of deposits
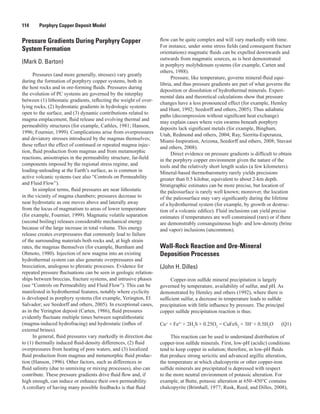
Chalcopyrite CuFeS2
98.2 H; O Pyrite FeS2
100 H Quartz/silica SiO2
100 H S
Bornite Cu5
FeS4
75.5 H; O Sphalerite ZnS 45.5 H
Muscovite/sericite
KAl2
(Si3
Al)O10
(OH,F)2
86.4 H
Chalcocite/digenite/djurleite
~Cu2
S
55.5 S; H; O Galena PbS 41.8 H
Chlorite
(Ca,Na,K)(Mg,Fe,Al)9
(Si,Al)8
O20
(OH)10
·n(H2
O)
80.9 H
Tetrahedrite/tennantite
(Cu,Fe)12
(Sb,As)4S13
32.7 H; O Pyrrhotite FeS 19.1 H Epidote Ca2
(Fe,Al)Al2
(SiO4
)(Si2
O7
)O(OH) 69.1 H
Enargite/luzonite/ famatinite
Cu3
(As,Sb)S4
22.7 H; O Marcasite FeS2
12.7 H
Biotite/phlogopite
K(Mg,Fe2+
)3
[AlSi3
O10
(OH,F)2
65.5 H
Molybdenite MoS2
70.9 H; O Arsenopyrite FeAsS 8.2 H K-feldspar KAlSi3
O8
H
Gold Au 61.8 H; O
Tellurides 8.2 H Kaolinite/illite/dickite Al2
Si2
O5
(OH)4
50 H SSilver Ag 8.1 H; O
Electrum (Au,Ag) 11.6 H; O
Covellite CuS 51.8 S; H; O
Others: cobaltite (CoAsS), bravoite
(Fe,Ni,Co)S2
, arsenosylvanite
(Cu3
(As,V)S4
)
H Actinolite Ca2
(Mg,Fe2+
)5
Si8
O22
(OH)2
29.1 H
Azurite Cu3
(CO3
)2
(OH)2
45.5 S; O Pyrophyllite Al2
Si4
O10
(OH)2
20.9 H
Cuprite Cu2
O 25.5 S; O Montmorillonite/smectite
(Na,Ca)0,3
(Al,Mg)2
Si4
O10
(OH)2
·n(H2
O)
19.1 H S
Tenorite CuO S; O
Chrysocolla
(Cu,Al)2
H2
Si2
O5
(OH)4
·n(H2
O)
22.7 S; O Garnet Fe3
Al2
(SiO4
)3
15.5 H
Copper Cu 20 S; O Zeolite NaCa4
[Al8
Si28
O72
]·n(H2
O) 17.3 H
Brochantite Cu4
(SO4
)(OH)6
8.2
S; O
Tourmaline NaFe3
Al6
(BO3
)3
Si6
O18
(OH)4
14.6 HChalcanthite CuSO4
·5
(H2
O) S; O
Antlerite Cu3
(SO4
)(OH)4
S; O
Other Cu oxide minerals: neotocite, malachite,3
atacamite, plancheite, turquoise, libethenite,
olivenite, chalcophyllite, metatorvernite,
chenevixite, krohnkite, natrochalcite
S; O Albite NaAlSi3
O8
13.6 H
Diopside CaMgSi2
O6
7.3 H
Zunyite Al13
Si5
O20
(OH,F)18
Cl 5.5 H
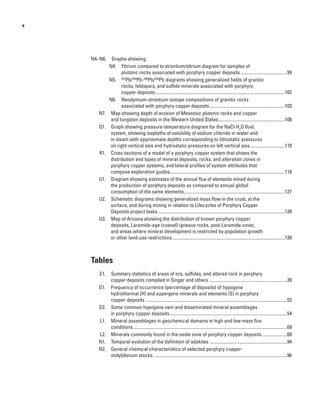
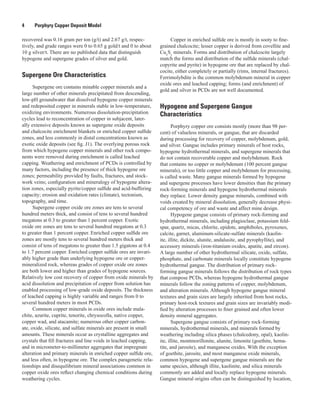
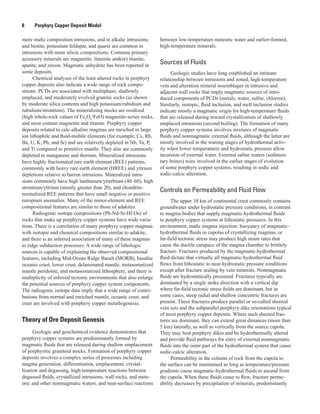
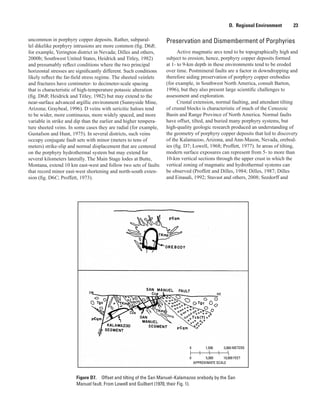
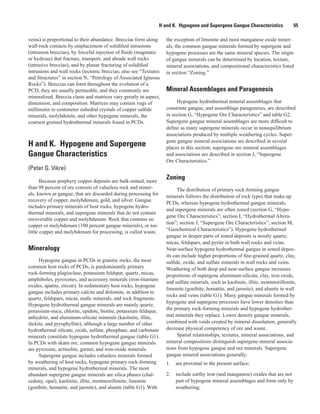
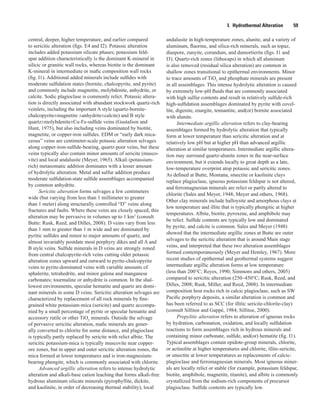
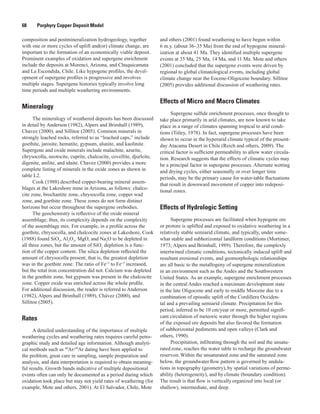
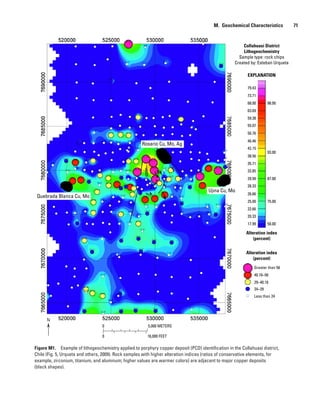
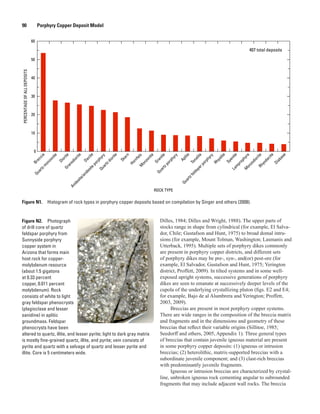
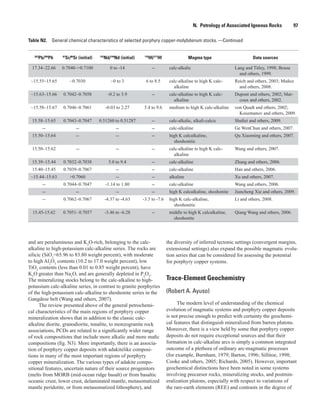
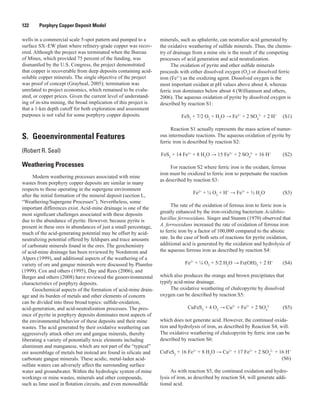
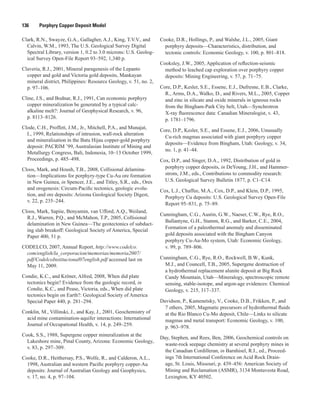
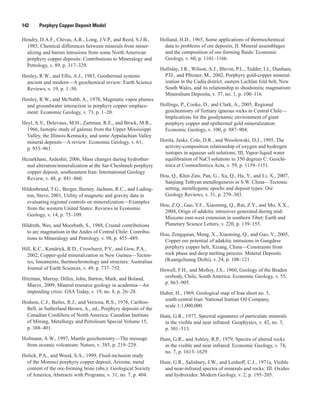
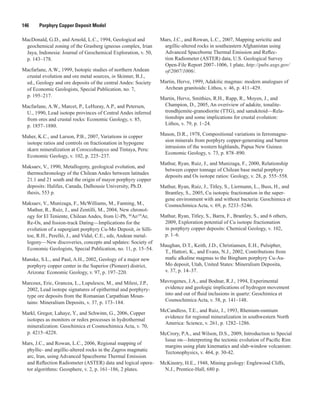
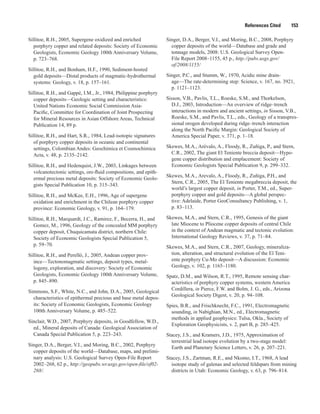
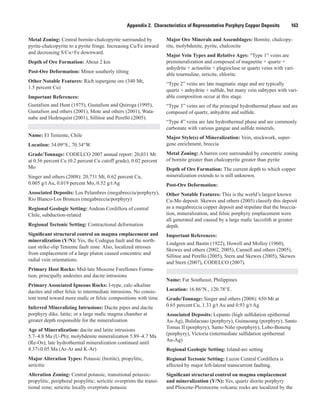
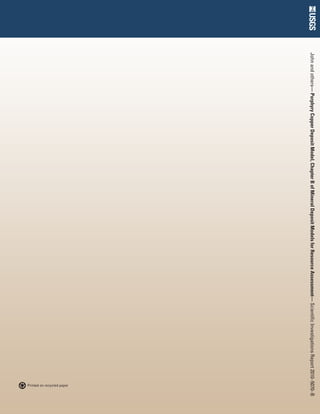
Table G1. Frequency of occurrence (percentage of deposits) of hypogene hydrothermal (H) and supergene minerals and elements (S) in porphyry copper deposits1, 2
. Group A
includes ore minerals and elements (O). Minerals in groups B (sulfide and telluride minerals), C (silicate minerals), D (oxide minerals), E (sulfate, phosphate, and fluoride
minerals), F (carbonate minerals), and G1 and G2 (other minerals) are seldom recovered and are considered gangue in most deposits. —Continued
52 PorphyryCopperDepositModel](https://image.slidesharecdn.com/sir2010-5070bporphyry-130509115606-phpapp01/85/Porphyry-Copper-Deposit-Model-66-320.jpg)
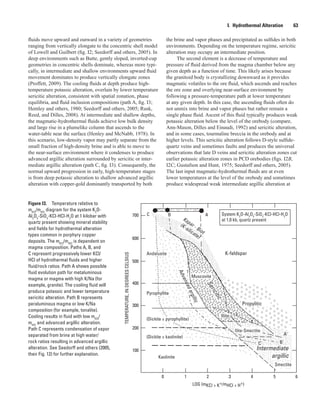
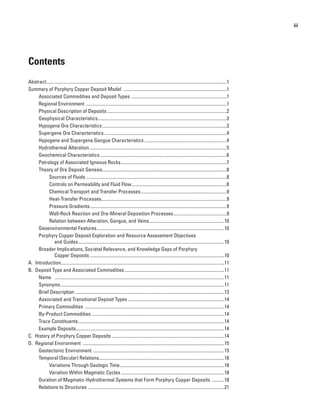
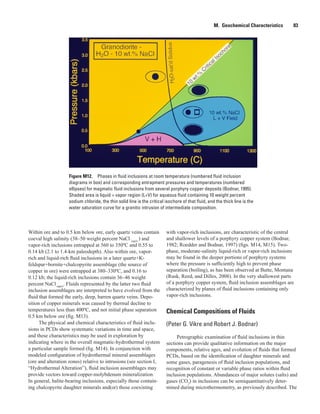
![Dominantly
magmatic
Magmatic + externalDominantly
external
Surface
derived
Recirculated
Basinal
m Sericitic/
advanced argillic
K-silicate
Greisen
Calcic
Na(Ca)
Na
Na(K/H)
K(Ca)
B Generalized distribution of hydrothermal
alteration
A Alternative fluid sources and paths
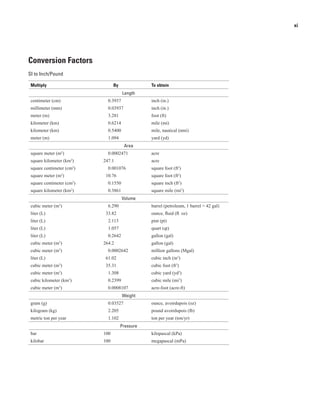
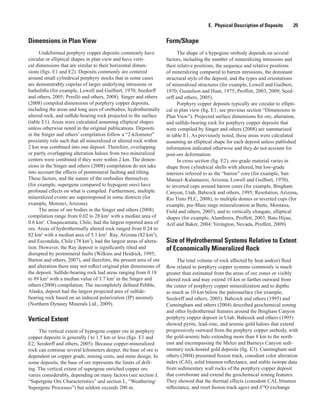
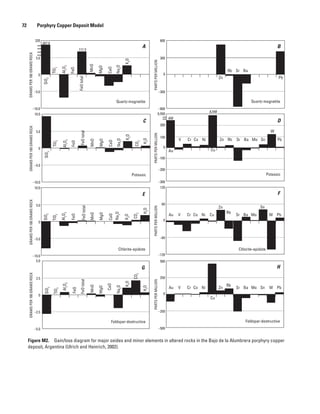
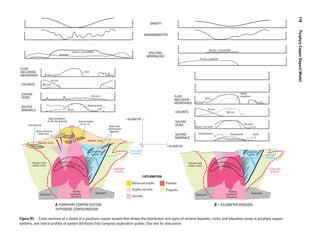
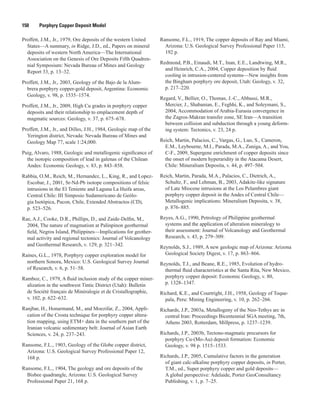
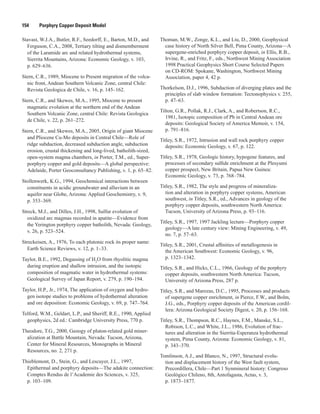
Figure I4. Model of fluid circulation and alteration in the root zone environment of porphyry copper deposits
(from Seedorff and others, 2008, their Fig. 5). (A) Schematic depiction of inferred circulation paths of selected
types of fluids. (B) Schematic depiction of one possible arrangement of alteration types observed in root zones.
Alteration types shown are calcic, sodic-calcic [Na(Ca)], sodic [Na], greisen [muscovite-rich greisen], potassic
[K-silicate], potassic transitional to calcic [K(Ca)], and sodic transitional to potassic and sericitic [Na(K/H)], and
sericitic and advanced argillic types. The inferred origin of the various alteration types is indicated by the arrows
labeled in part A.
64 Porphyry Copper Deposit Model
less than 200°C, in particular in late porphyry dikes, as at
Butte (consult Zhang, 2000).
The third element is the contribution of nonmagmatic
fluids ambient in the country rocks intruded by the porphyries
(fig. I4). These fluids may range from saline brines to dilute
meteoric waters. They advect in a hydrostatically pressur-
ized system driven by the hot magma chamber at depth and
hot porphyry intrusions and largely follow hydrofractures
produced by the magmatic-hydrothermal fluids. Saline forma-
tion waters produce large volumes of sodic-calcic alteration
flanking and lying below and to the side of the orebody along
the granite cupola contact in the Yerington district (Carten,
1986; Dilles and Einaudi, 1992). Propylitic alteration is
produced by the brines in the Yerington district at shallower
depths and lower temperatures (Dilles and Einaudi, 1992;
Dilles and Proffett, 1995) and is produced by low-salinity
fluids in the Bingham district (Bowman and others, 1987). If
magmatic-hydrothermal fluid input ceases, brines may pene-
trate the central parts of ore zones as at Yerington (fig. I2D;
Carten, 1986; Seedorff and others, 2005). When nonmagmatic
fluids are dilute meteoric waters (less than 3 weight percent
salinity), they cannot access the central part of the hydro-
thermal system where potassic and sericitic alteration form
at temperatures greater than 350°C, and these fluids typically
only penetrate at temperatures less than 300°C and contribute
to shallow advanced argillic and propylitic alteration and late,
low-temperature, intermediate argillic alteration.
The nature of fluids and zonation in the skarn environ-
ment is more complex and more poorly understood than the
PCD environment, but anhydrous garnet-pyroxene skarn
may correspond to potassic alteration and actinolite-sulfide
stages corresponds to potassic and sericitic alteration (consult
Einaudi, 1977, 2000; Atkinson and Einaudi, 1978; Einaudi and
others, 1981). Endoskarn in part likely represents alteration by
nonmagmatic fluids.
J. Supergene Ore Characteristics
(Peter G. Vikre)
Supergene ore contains minable copper minerals and
numerous other minerals precipitated from descending,
low-pH groundwater that dissolved hypogene copper minerals
and redeposited copper in minerals stable in low-temperature,
oxidizing environments. During the formation of supergene
ore, descending groundwater is acidified by dissolution of
pyrite, which simultaneously causes dissolution of hypogene
copper minerals. Numerous dissolution-precipitation cycles
lead to reconcentration of copper in subjacent, laterally exten-
sive deposits known as supergene oxide deposits and chalco
cite enrichment blankets or enriched copper sulfide zones and,
less commonly, in distal concentrations known as exotic oxide](https://image.slidesharecdn.com/sir2010-5070bporphyry-130509115606-phpapp01/85/Porphyry-Copper-Deposit-Model-78-320.jpg)
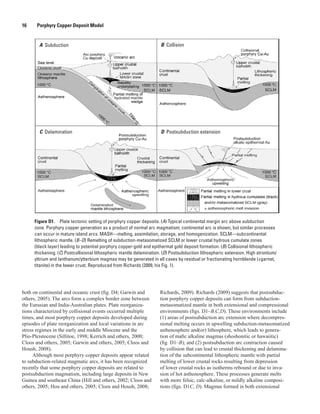
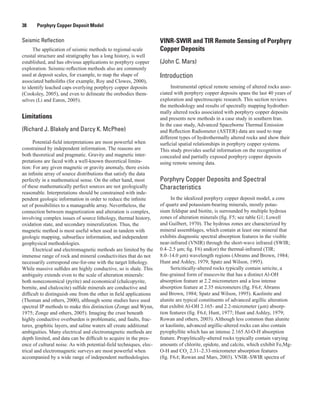
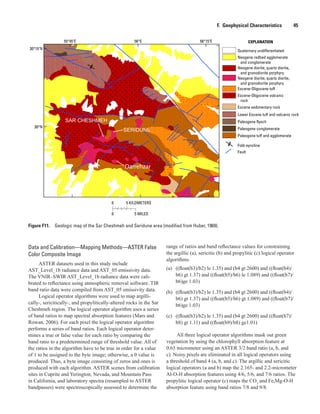
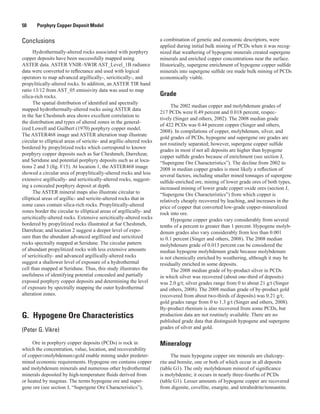
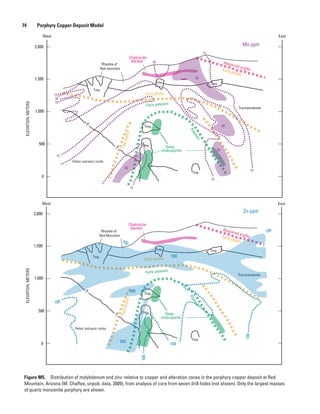
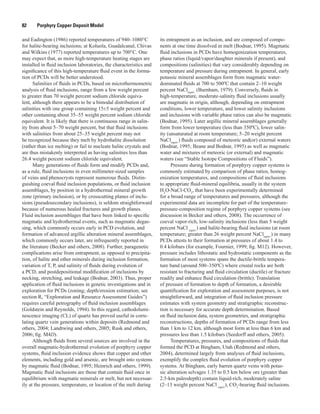
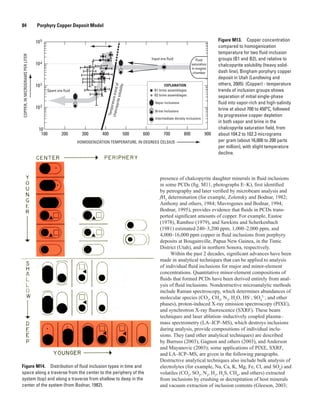
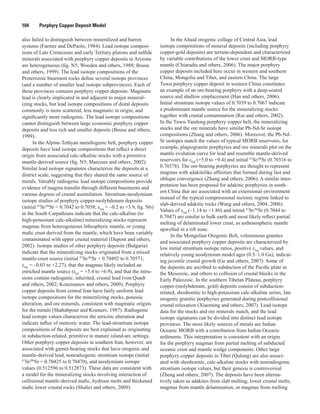
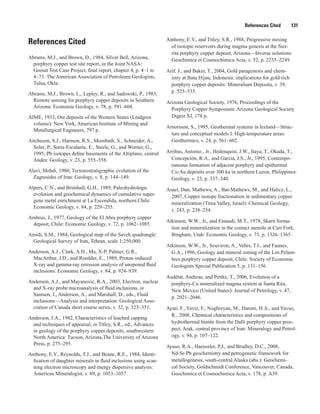
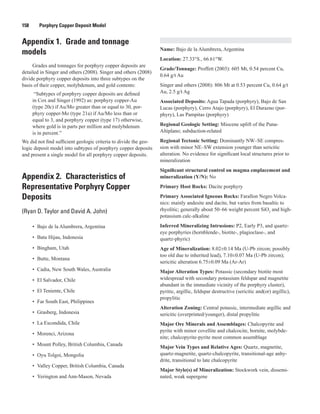
![Figure M4. Distribution of ore-grade copper (upper section) and
gold (lower section) in the porphyry copper-gold deposit at Bajo
de la Alumbrera, Argentina (Ulrich and Heinrich, 2002). Copper and
gold are largely cospatial, correlate with lithologies, and surround
a barren core.
Figure M3. Gain/loss diagram for major and minor elements in potassic
and phyllic alteration zones in the Sar Chesmeh porphyry copper deposit,
Iran, based on comparisons of least altered to potassically altered rocks,
and potassically altered to phyllically altered rocks (Hezarkhani, 2006).
MASSCHANGE,INPERCENT
–2
–1
0
1
2
3
4
0.1SiO2
TiO2
0.1Al2
O3
0.1MgO
Fe2
O3
Na2
O
H2
O+
H2
O–
S
Cu
P2
O5
K2
O
MnO
CaO
Potassic
Phyllic
Copper ore grade
Gold ore grade
A
B
M. Geochemical Characteristics 73
in the lower part of the ore zone and(or) in the potassi-
cally altered barren core; for barium and strontium, this
relationship is the opposite of that reported for Bajo de
la Alumbrera. Also at Kalamazoo, tellurium and potas-
sium (in addition to copper, molybdenum, and silver)
occur in the copper ore zone; and Co, V, Se, Fe, S, Rb,
gold, and Te occur above and lateral to the ore zone in
the sericitic and propylitic alteration zones. Elements
depleted in rocks above and lateral to the ore zone
include manganese, zinc, lead, and thallium, although
some depletion was attributed to weathering and not
hydrothermal processes. Concentration and depletion
of elements were detected tens to hundreds, but not
thousands, of meters above and lateral to ore zones. At
Red Mountain, the distribution of elevated concentra-
tions of Te, S, Tl, Rb, Cu, Au, Ag, Hg, Zn, Pb, Cs, As,
Sb, Mo, Co, Sr, and K is thought to reflect both spatial
and temporal zoning of sulfide-silicate assemblages
that comprise a deep potassic-phyllic (sericitic) altera-
tion zone with chalcopyrite and a shallow, advanced
argillic zone with enargite as the main copper mineral
(fig. M5). Redistribution of elements during weather-
ing and supergene enrichment are thought to have not
significantly modified hypogene zoning patterns.
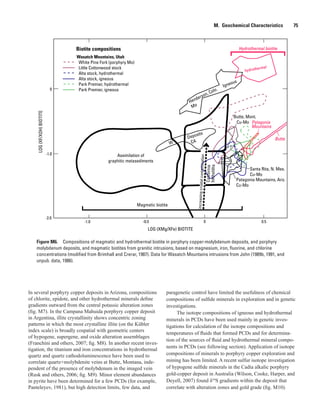
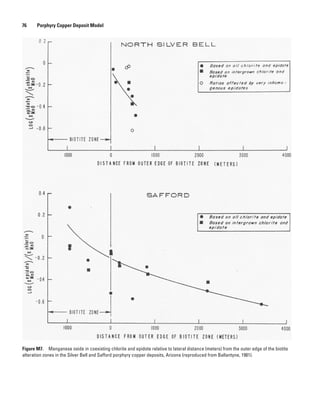
Mineral Compositions
(Peter G. Vikre)
The chemical compositions of hydrous igneous
and hydrothermal minerals in PCDs have been
evaluated for discrimination between mineralized
and unmineralized intrusions, and for quantification
of magmatic variables (temperature, oxidation state,
fugacities of H2
O, HCl, HF, H2
). Biotite has been
the most frequently investigated “indicator” mineral
because (1) it is common in potassic alteration zones
of mineralized intrusions as both a primary and hydro-
thermal mineral, and (2) its composition is dependent
on the temperature, oxidation state, and composition of
magmas, magmatic volatiles and hydrothermal fluids
(for example, Wones and Eugster, 1965; Graybeal,
1973; Banks, 1973, 1982; Kesler and others, 1975;
Mason, 1978; Jacobs and Parry, 1979; Munoz, 1984;
Hendry and others, 1985; Brimhall and Crerar, 1987;
Selby and Nesbitt, 2000; Core and others, 2005; Ayati
and others, 2008). In several porphyry copper deposits,
igneous and hydrothermal biotites are considerably
more oxidized (higher log [XMg
/XFe
] than igneous
biotites from unmineralized granitic intrusions and
batholiths) (fig. M6). Compositions of other igneous
and hydrothermal minerals, including chlorite, epidote,
feldspar, amphibole and potassium-mica, have been
investigated to a lesser extent and most of these data
are unpublished (Graybeal, 1972; Ballantyne, 1981).](https://image.slidesharecdn.com/sir2010-5070bporphyry-130509115606-phpapp01/85/Porphyry-Copper-Deposit-Model-87-320.jpg)
![80 Porphyry Copper Deposit Model
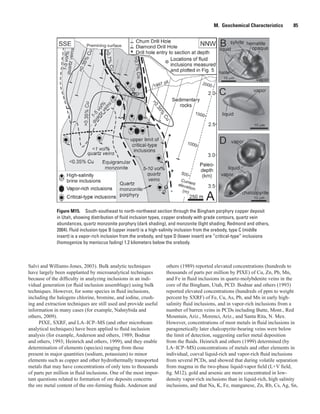
Fluid-Inclusion Thermometry and Geochemistry
(Peter G. Vikre and Robert J. Bodnar)
Fluids that form porphyry copper systems vary widely
in composition, from low-salinity vapor or dilute liquid to
high-salinity brine. Fluids are derived from magmas and from
external sources including groundwater (meteoric water),
seawater, formation water, and metamorphic water. Much of
our knowledge of the physical and chemical environment of
formation of PCDs comes from studies of fluid inclusions
trapped in ore and gangue minerals. Fluid inclusion techniques
that have been used to determine the physical properties
and compositions of hydrothermal fluids that formed PCDs
include petrography, microthermometry, and direct analysis
of fluid inclusions. Physical and chemical data derived from
these techniques, supplemented by thermodynamic model-
ing of equilibrium reactions between hydrous fluids and
igneous and hydrothermal mineral assemblages that make
up PCDs (section I, “Hydrothermal Alteration”), have been
used to interpret the genesis of PCDs. Physical properties and
compositions of hydrothermal fluids that can be obtained from
fluid inclusion petrography and microthermometry include
temperature, pressure (or depth), density, and major solute
concentrations (salts and gases). Edwin Roedder pioneered
the quantification of these parameters at conditions that are
pertinent to fluids in the magmatic-hydrothermal transition
and lower temperature hydrothermal environments. In addi-
tion to major solutes and gases in the fluids, recent advances
in instrumentation now make it possible to determine minor
and trace-element (including ore metals) concentrations and
isotopic compositions of fluids causing alteration and mineral-
ization in PCDs.
Much valuable information concerning the physical
state and composition of fluids associated with PCDs is easily
acquired by petrographic examination of thin sections. Indeed,
Lindgren (1905) observed halite-bearing fluid inclusions in
samples from the Morenci porphyry copper deposit and noted
that “They [halite-bearing inclusions] prove, I think conclu-
sively, that the acid porphyry magma [at Morenci] was accom-
panied by notable quantities of aqueous solutions containing a
large quantity of salt which probably was NaCl.” and that “It
is perhaps a significant fact that these inclusions are absent in
the diorite porphyries, which as a rule have no connection to
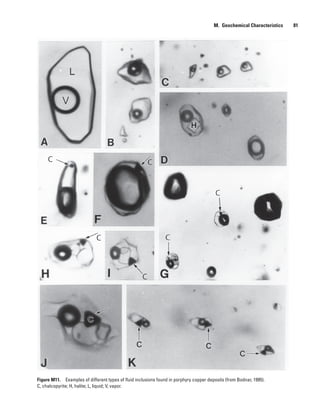
the copper deposits.” More recently, Nash (1976) described
the general petrographic characteristics of fluid inclusions in
PCDs and reported four types of inclusions that are commonly
observed in these deposits, including his Type III inclusions
that contain halite at room temperature (fig. M11; photo-
graph D). These high-salinity inclusions commonly also
contain sylvite and occasionally chalcopyrite that precipitated
in inclusions as fluids cooled (fig. M11; photographs E–K).
In addition to the Type III inclusions, Nash (1976) described
vapor-rich Type II inclusions (fig. M11; photograph F)
commonly coexisting with halite-bearing inclusions (fig. M11;
photographs D, G), the most common liquid-rich, low to
moderate salinity Type I (fig. M11; photographs A, B), and
the least common CO2
-rich Type IV inclusions. Coexist-
ing halite-bearing and vapor-rich fluid inclusions (fig. M11;
photographs D, G) are considered characteristic of porphyry
copper deposits (for example, Lindgren, 1905; Nash, 1976;
Bodnar, 1995). It should be noted that the types of fluid inclu-
sions observed in PCDs are not restricted to these ore deposits.
Rather, these inclusion types are characteristic of most shallow
silicic plutons (for example, John, 1989a) and are a reflection
of the PT conditions of pluton emplacement and crystallization
and the phase equilibrium properties of the H2
O-NaCl system
(Bodnar and others, 1985).
Current descriptive typing of fluid inclusions usually
is based on the phase assemblages in the inclusions at room
temperature, and(or) the mode of homogenization (tempera-
tures at which two inclusion phases, for example, liquid and
vapor, become one phase), to avoid confusion when using
the Type designation proposed by Nash (1976). Thus, Nash’s
Type III (halite-bearing) fluid inclusions would be described as
“halite-bearing inclusions that homogenize by halite disso-
lution,” or “halite-bearing inclusions that homogenize by
bubble disappearance,” and so forth. For two-phase (liquid +
vapor) inclusions, Rusk, Reed, and Dilles (2008) introduced a
terminology that reflects the volume percent of the inclusion
that is filled with vapor (bubble, or “B”) at room temperature;
thus, a “B30” inclusion contains about 30 volume percent
vapor (bubble) when observed at room temperature (fig. M11;
photograph E).
Microthermometry involves nondestructive (optical)
monitoring of the behavior of phases in fluid inclusions
(usually liquid, vapor, and salts) over a broad tempera-
ture range, commonly –190°C to more than 500°C, using
a microscope equipped with a stage that allows observa-
tion of the inclusions during controlled heating and cooling.
Microthermometry enables quantitative determination of the
minimum temperature of entrapment of an inclusion (which
in some cases is the precipitation temperature of the host
hydrothermal mineral), semiquantification of salinity, and
identification and semiquantification of some volatiles such
as carbon dioxide. Homogenization temperatures of fluid
inclusions in PCDs span a wide range, from about 150°C
to more than 1,000°C, although most investigations of fluid
inclusions in PCDs list maximum temperatures of 600°C
or less. However, this temperature limit is likely biased by
the unavailability of microscope heating stages for analyses
above 600°C, and many workers report that some inclu-
sions had not homogenized when heated to the maximum
temperature achievable with the heating stage. Those workers
who have had access to stages with higher maximum heating
limits often report homogenization temperatures in excess of
600°C. For example, in the Granisle and Bell PCDs in British
Columbia, Wilson and others (1980) reported homogenization
temperatures less than or equal to 1290°C or less and 800°C
or less, respectively. At Santa Rita, New Mexico, Reynolds
and Beane (1985) reported homogenization temperatures in
excess of 800°C; at Bougainville, Papua New Guinea, Eastoe](https://image.slidesharecdn.com/sir2010-5070bporphyry-130509115606-phpapp01/85/Porphyry-Copper-Deposit-Model-94-320.jpg)
![Table N1. Temporal evolution of the definition of adakites (modified from Richards and Kerrich, 2007). —Continued
[wt. %, weight percent; <, less than; >, greater than; ≤, equal to or less than; ≥, equal to or greater than; ppm, parts per million; ~, about; m.y., million years; --, no data]
Parameter
Chemical definition of adakites (1990–2005)
Defant and
Drummond (1990)
Drummond
and Defant
(1990)
Defant and
Drummond (1993)
Drummond and
others (1996)
Martin (1999)
Martin and others
(2005)
Richards and Kerrich
(2007)
SiO2
≥ 56 wt. % >56 wt. % >56 wt. % ≥ 56 wt. %
Al2
O3
≥ 15 wt. % >15 wt. % at 70% SiO2
>15 wt. % at 70% SiO2
≥ 15 wt. %
MgO Usually <3 w.t %;
rarely >6 wt. %
Normally <3 wt. %
Mg#1
~0.51 ~0.51 ~0.5
Na2
O 3.5–7.5 wt. % 3.5–7.5 wt. % ≥ 3.5 wt. %
K2
O ≤ 3 wt. % ≤ 3 wt. %
K2
O/Na2
O ~0.42 ~0.42 ~0.42
Rb <65 ppm ≤ 65 ppm
Sr ≥ 400 ppm -- -- -- 300–2,000 ppm -- ≥ 400 ppm
Y ≤ 18 ppm -- ≤ 18 ppm -- ≤ 18 ppm ≤ 18 ppm ≤ 18 ppm
Yb ≤ 1.9 ppm -- ≤ 1.9 ppm -- ≤ 1.8 ppm ≤ 1.8 ppm ≤ 1.9 ppm
Ni -- -- -- -- 20–40 ppm 24 ppm ≥ 20 ppm
Cr -- -- -- -- 30–50 ppm 36 ppm ≥ 30 ppm
Sr/Y -- -- ≥ 20 -- -- -- ≥ 20
La/Yb -- ≥~8 -- -- -- ≥~15 ≥ 20
87
Sr/86
Sr <0.7040 -- -- <0.7045 -- -- ≤ 0.7045
206
Pb/204
Pb -- -- -- -- -- -- --
207
Pb/204
Pb -- -- -- -- -- -- --
208
Pb/204
Pb -- -- -- -- -- -- --
εNd
-- -- -- -- -- -- --
Age of subducted
oceanic crust
≤ 25 m.y. -- -- ≤ 25 m.y. ≤ 20 m.y. -- ≤ 25 m.y.
94 PorphyryCopperDepositModel](https://image.slidesharecdn.com/sir2010-5070bporphyry-130509115606-phpapp01/85/Porphyry-Copper-Deposit-Model-108-320.jpg)
![Table N1. Temporal evolution of the definition of adakites (modified from Richards and Kerrich, 2007). —Continued
[wt. %, weight percent; <, less than; >, greater than; ≤, equal to or less than; ≥, equal to or greater than; ppm, parts per million; ~, about; m.y., million years; --, no data]
Parameter
Selected adakite-like rocks related to porphyry copper deposits (since 2007)
Wang and others (2007) Li and others (2008) Ling and others (2009) Shafiei and others (2009)
Eastern China Eastern China Eastern China Southeastern Iran
SiO2
~54–68 wt. % >56 wt.% >56 wt.% >56 wt.%
Al2
O3
~14.4–18.7 wt. % most are <15 wt. % ~14.45–16.49 wt.%
MgO ~1.5–6.0 wt. % <3 wt. % <3 wt. %
Mg#1 ~0.35 to 0.50
Na2
O 2.1–3.5 wt.% most are > 3.5 wt.% most are > ~3 wt.%
K2
O 3.3–5.8 wt.% most are > 3 wt.% < 3.5 wt.%
K2
O/Na2
O
Rb 61–186 ppm most are > 65 ppm
Sr 442–2,759 ppm 740–1,300 ppm > 400 ppm > 400 ppm
Y ~2.8–16.8 ppm ≤ 18 ppm < 18 ppm < 18 ppm
Yb 0.28–1.67 ppm <1.2 ppm < 1.8 ppm --
Ni ~10–75 ppm ≥ 20 ppm most are < 20 ppm --
Cr 34–254 ≥ 30 ppm most are < 30 ppm --
Sr/Y >>20 60–92 ≥ 20 >30
La/Yb ~17–23 26–75 most are ≥ 20 > 20
87
Sr/86
Sr 0.7044–0.7073 0.7062–0.7067 ~0.7051–0.7099 0.70425–0.70470
206
Pb/204
Pb -- -- 18.09–18.88 18.52–18.6
207
Pb/204
Pb -- -- 15.48–15.62 15.58–15.64
208
Pb/204
Pb -- -- 38.16–39.08 38.57–38.80
εNd
+1.8 to -9.6 -4.37 to -4.63 -3.47 to -13.60 0.512596–0.512873
Age of subducted
oceanic crust
-- -- -- --
1
Mg# = Mg/(Mg + Fe), where magnesium and iron are atomic proportions.
N. PetrologyofAssociatedIgneousRocks 95](https://image.slidesharecdn.com/sir2010-5070bporphyry-130509115606-phpapp01/85/Porphyry-Copper-Deposit-Model-109-320.jpg)
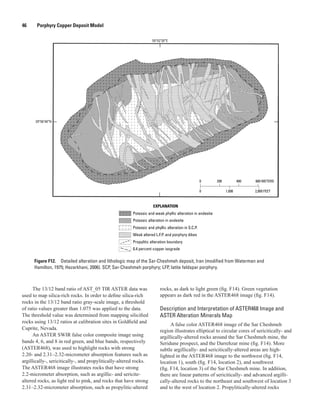
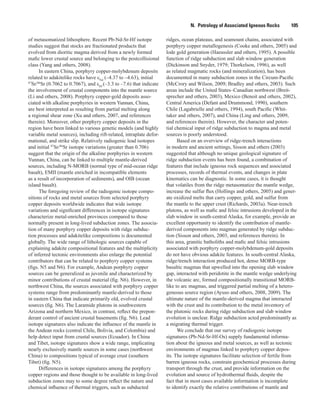
![Region Tectonic setting
Presence
of adakite
SiO2
weight percent
ASI La/Yb Sr/Y
Arizona subduction? -- 57–72 0.7–1.95 4–22 25–60?
Andes subduction adakite 62–72 ~1 25–60 100–300
Romania, South Carpathians subduction? -- 50–67 ~0.7? 10–20 45–65?
Bulgaria, Panagyurishte district subduction -- 70–76 -- 10–17 7–50
Central Iran syn- and postcollision adakite 59–66 ~0.94–1.32 >20 30–35
Xing’an-Mongolian Orogenic Belt subduction? syncollision? adakite 66–72 ~1.04–1.17 8–22 10–49?
Tibet, Gangdese subduction-collision adakite 61–72 ~1–1.2 19–40 30–80?
Tibet, Lhunzub basin continental collision -- 66–84 >1.19 4–14 3–31?
Northwest China, Tuwu-Yandong subduction adakite 65–73 >1.0 5–19 26–134?
West China, Tuwu subduction adakite 64–81 ~1.1–1.3 8–13 34–137
South China, western Yunnan collision? -- 67–70 -- 7–18 --
South China, Dexing extensional adakite 59–68 ~0.85–1.1 24–65 34–254
East-Central China, Yangtze subduction adakite 54–64 >1.0 8–17 17–78
East China, Tongshankou intracontinental extension? adakite 61–64 0.7–1.0 26–75 60–92
East China, Luzong extensional adakite 56–70 >1.1 8–23 22–60?
Table N2. General chemical characteristics of selected porphyry copper-molybdenum stocks. —Continued
96 Porphyry Copper Deposit Model
copper deposits in the Mongolian Orogenic Belt are character-
ized by SiO2
contents mostly about 70 weight percent, with
Na2
O less than K2
O, and ASI values between 1.04 and 1.17
(Ge and others, 2007). The major-element compositions of
the porphyry copper deposit-related granodiorites resemble
those of adakites. In this area, the barren monzogranites and
granodiorites represent an early episode of magmatism, and
the ore-bearing granodioritic porphyry formed relatively late.
Porphyry copper-molybdenum deposits in eastern China are
associated with adakitelike rocks related to partial melts of
metasomatized mantle peridotite in an extensional environ-
ment (Li and others, 2008). The major and trace elemental
abundances show 61–64 weight percent SiO2
, 2.1–3.5 weight
percent, Na2
O, and 3.3–5.8 weight percent K2
O, and are clas-
sified as high-potassium calc-alkaline or shoshonitic. MgO
and Mg# (molar 100×MgO/[MgO+FeOT
]) are 0.9–2.3 weight
percent and 32–49, respectively. Calculated A/CNK values
(molar Al2
O3
/[CaO+Na2
O+K2
O]) are 0.7–1.0, indicating a
metaluminous composition. Both a subduction-related origin
and a crustal-melting origin can be ruled out. The mineral-
izing adakitelike rocks reflect an enriched lithospheric mantle
metasomatized by slab-derived fluids and(or) melts related to
an ancient subduction processes.
In other parts of Asia, the genesis of porphyry copper
systems is ascribed to various collisional and postcollisional
tectonic settings. The alkali-rich porphyry belt in western
Yunnan is interpreted to be related to partial melting in a
disjointed region between upper mantle lithosphere of the
Yangtze Plate and Gondwana, and lies within a shear zone
between buried Palaeo-Tethyan oceanic lithosphere and
upper mantle lithosphere caused by the subduction and
collision of India and Asia. Quartz-albite porphyry, quartz-
potassium feldspar porphyry and biotite–potassium feldspar
porphyry in western Yunnan are characterized by high alkali
contents [(K2
O+Na2
O) greater than 10 weight percent], and
high silica (SiO2
greater than 65 weight percent) contents
(Xu and others, 2007). Ore-bearing porphyries in the Gang-
dese copper belt range in SiO2
from 60.9 to 72.4 weight
percent, are also enriched in K2
O from 2.34 to 7.43 weight
percent, and are classified as high-potassium calc-alkaline
and shoshonite (Xiaoming and others, 2007). The porphyries
are consistent with magmatism produced during relaxation
in the late stages of the progression from late orogenic to
postcollisional tectonic settings. The Paleocene collision-
related granite porphyries of the Lhunzhub Basin in Tibet
were emplaced during the Indo-Asian continental collision](https://image.slidesharecdn.com/sir2010-5070bporphyry-130509115606-phpapp01/85/Porphyry-Copper-Deposit-Model-110-320.jpg)
![Q. Theory of Ore Deposit Formation 111
Geologic studies have long established an intimate relation-
ship between high-temperature mineral assemblages, vein
abundances, and particular intrusions, demonstrating a close
connection in space and time to magma emplacement and,
by inference, magmatic sources of components (for example,
El Salvador [Gustafson and Hunt, 1975], Yerington [Proffett,
1979; Dilles and Einaudi, 1992; Dilles and Proffett, 1995],
Bajo de la Alumbrera [Proffett, 2003], Batu Hijau [Clode and
others, 1999]). Similarly, isotopic, fluid inclusion, and melt
inclusion studies indicate mostly a magmatic origin for high-
temperature fluids in porphyry systems (for example, David-
son and others, 2005; Harris and others, 2008), but there are
instances in which external fluids were likely involved during
ore formation (Frikken and others, 2005).
Magma-derived fluids in the classic orthomagmatic
model (Burnham 1967, 1979; Whitney, 1984) containing
water, salts, metals, and sulfur are extracted during second
boiling. Intrusions emplaced at high crustal levels crystallize
inward, resulting in volatile saturation and separation. The
locus of key phase separation is uncertain and might result
from deeper levels of crystallization (see summary in Sinclair,
2007). Many hydrothermal systems involve mixtures of
magmatic fluids and nonmagmatic fluids. While the latter are
best evidenced in the waning stages of hydrothermal activity,
at least a few systems show clear evidence of involvement
of cyclical alternation between magmatic and nonmagmatic
fluids (for example, Carten, 1986). Such fluids react with
cogenetic intrusions and overlying rocks and as a consequence
may modify the porphyry copper (molybdenum, gold) deposit
systems; but in most cases the fluids only redistribute and do
not introduce additional ore components. We highlight below
how the mantle and crustal sources associated with the general
model for porphyry copper deposits explain the characteristic
ore metal distributions by using selected global deposits.
The fundamental aspects of magma production in
continental margins point to multiple, multistage processes
summarized as the melting, assimilation, storage, and
homogenization (MASH) model (Hildreth and Moorbath,
1988). Processes associated with the MASH model account
for crustal contributions to Andean arc magmatism and are
particularly valuable to emphasize the fundamental control
of thick basement rocks in determining the non-mantle-
derived metal inventory in porphyry deposits. There is general
agreement that for the most part copper, gold, and the PGE
in porphyry deposits point to mafic melts and lower crustal
or mantle sources, and molybdenum, tungsten, and tin are
derived from crustal sources or possibly from the subducting
slab (for example, Seedorff and others, 2005). The nature of
the upper crust is thought to have little influence on the fertil-
ity of arc magmas, but it may exert some control on ore metal
ratios (Kesler, 1973).
At El Teniente and other deposits in central and north-
ern Chile, copper and molybdenum were derived from the
mineralizing stocks, which had been ultimately formed from
sub-Andean mantle contaminated by subduction of a small
amount of pelagic and terrigenous sediment and continental
crust tectonically eroded off the continental margin (Stern
and Skewes, 1995, 2005; Mathur and others, 2000). Copper,
molybdenum, gold, platinum-group elements, and osmium
were introduced into the crust from the mantle wedge
and(or) subducted material (Sillitoe, 1972; Hedenquist and
Richards, 1998; Ruiz and Mathur, 1999). At Los Pelambres
porphyry copper deposit, the scale of the mineralization can
be explained by recycling of metals associated with both the
magmatic activity of a subducted hotspot chain and crustal
material tectonically incorporated into the source region
(Reich and others, 2003).
The source of the igneous rocks and ore metals in
southwestern Arizona and northern Mexico likely includes
basement rocks, older igneous rocks, and the lower crust.
Hybridized lower continental sources are favored for lead
and other metals in the mineralizing stocks and porphyry
copper deposits (Bouse and others, 1999), although a continu-
ous process of progressive assimilation involving mafic
magmas invading and reacting with continental crust has also
been suggested (Anthony and Titley, 1988). In southeastern
Arizona, metal contents and ore/metal ratios in porphyry
copper deposits may reflect the nature of the basement terranes
(Titley, 2001). Similarly, in the case of the Laramide magmas
from northern Mexico, interaction of magmas with base-
ment rocks is thought to have had fundamental control on the
metallogenesis of the large porphyry copper-molybdenum
systems (Valencia-Moreno and others, 2001, 2007). In this
case, Mexican porphyry systems underlain by North American
crust are associated with copper, molybdenum, and tungsten
deposits, whereas other, younger basement terranes are associ-
ated with copper-gold deposits.
Porphyry copper deposits in southern Iran suggest that
much of the metals and a significant proportion of sulfur were
supplied from mafic melts derived from a mixed reservoir
at the mantle/lowermost crust boundary and then recycled
into intermediate-composition hybrid magmas produced by
MASH-type processes (Shafiei and others, 2009).
Porphyry copper-gold deposits in the southern Altaids are
distributed among several terranes characterized by various
contributions of the lower crust and MORB-type mantle
(Chiaradia and others, 2006). There is no unique basement or
crustal reservoir supplying the huge amount of gold in these
deposits. The Tuwu porphyry copper deposit in western China
sulfur (and ore metals?) was derived from the deep crust or
upper mantle (Han and others, 2006). In the Tuwu-Yandong
porphyry copper belt, the ore-bearing plagiogranite porphyries
point to MORB (basaltic oceanic crust) as the dominant source
of copper, gold, water, and chlorine (Zhang and others, 2006).
In the Dexing area of southern China, a similar interpreta-
tion has been proposed for adakitic porphyries associated
with an extensional environment (Wang and others, 2006).
A mantle source is implicated for the chalcophile elements
of the copper mineralization. Moreover, adakitic magmas
derived by partial melting of delaminated lower crust are
suggested as highly prospective for the generation of porphyry
copper-gold deposits.](https://image.slidesharecdn.com/sir2010-5070bporphyry-130509115606-phpapp01/85/Porphyry-Copper-Deposit-Model-125-320.jpg)
![126 Porphyry Copper Deposit Model
province of southwestern North America, of the largely
concealed, yet giant Resolution porphyry copper system in
Arizona (Manske and Paul, 2002), and the numerous uncer-
tainties regarding the relationship to Resolution of tectonism,
weathering, and other deep copper mineralization in the area
(Sell, 1995). Seedorff and others (2005) outlined numer-
ous “challenges” that affect the understanding of porphyry
deposits and have both scientific and practical implications.
Similarly, this model of porphyry copper deposits has identi-
fied several knowledge gaps that affect our understanding of
the genesis of deposits and our ability to assess and explore for
undiscovered deposits.
Some remaining questions and research directions that
specifically address exploration and assessment needs are:
1. Detailed definition of PCD characteristics in time and
space to enhance recognition of poorly exposed, con-
cealed, and dismembered PC systems from limited data.
2. Determination of cryptic edges of PC systems (mineral-
ogy, trace elements), thereby enlarging system size and
improving exploration efficiency and assessment accu-
racy, especially for concealed deposits.
3. Improved definition of physical, chemical, and isotope
gradients in PC systems, especially in system extremities,
to enable efficient vectoring toward copper concentra-
tions, both hypogene and supergene.
4. Reconstruction of paleoterranes in PCD provinces that
have been dismembered by postmineralization tectonism
to account for all pieces of dismembered PCDs, thereby
providing explorationists with targets and assessors with
more accurate deposit inventories and densities.
5. Determination of characteristics of advanced argillic
alteration assemblages that are specific to PC systems.
6. Determination of characteristics of coeval volcanic rocks,
paleosurfaces, and paleodeposits that indicate the pres-
ence of PC systems.
7. Evaluation of favorable terranes for PCD enrichment by
number and length of erosion cycles, colluvium thickness,
tectonism, and basin history.
8. Improved modeling of transport-sink cycles of PCD
components near weathered or weathering PCDs for
geoenvironmental applications, as well as for exploration
and assessment, especially of concealed PC systems.
9. Improved understanding of the formation of exotic copper
occurrences and deposits to enable vectoring of hypogene
and supergene copper sources.
10. Evaluation of magmatic systems for specific characteris-
tics that lead to PCD formation, including sites and struc-
tural settings of magma genesis and emplacement, magma
compositions (including metals [copper, molybdenum,
gold] and volatiles [water, sulfur, chlorine]), relationships
among emplacement levels and cooling, crystallization
and degassing rates, and relationships between copper
grade, copper inventory, and multiple magmatic pulses.
11. Improved understanding of the function of regional struc-
tures (faults, rock contacts) at high crustal levels in the
control of igneous systems that develop PCD systems.
12. Improved understanding of fundamental controls on
major differences in characteristics of PCDs, for example,
controls on metal ratios, timing and distribution of molyb-
denum, and timing and association of most copper with
early potassic alteration or later sericitic alteration.
U. Broader Implications and Societal
Relevance of Porphyry Copper Systems
(Mark D. Barton)
Porphyry copper systems, their distribution and their
impacts, have broader implications for society. Beyond their
overwhelming importance as the principal source of critical
materials, the production of porphyry deposits constitutes a
major disturbance of the Earth’s surface and elicits diverse
reactions from communities affected by their occurrence and
production. Understanding deposit characteristics and distri-
bution can and should have a broader effect on many other
aspects of human activity.
Porphyry copper systems are numerous: where they
occur, they affect significant volumes in the upper crust, and
their production is one of the principal modern processes
affecting the Earth’s surface. Mining of porphyry deposits
moves several cubic kilometers of the Earth’s upper crust
per year—a volume comparable to arc volcanism (fig. U1;
Barton and others, 2005). Estimates of magma and fluid
fluxes in arcs suggest that porphyrylike features (magmatic-
hydrothermal systems) comprise a significant fraction
(perhaps 5–10 percent) of the upper arc crust in the vicinity of
magmatic centers (Johnson, 2000) and hydrothermal alteration
is ubiquitous in associated volcanic rocks (Barton and others,
1988). This is supported by the distribution of mineralized
systems in the geologic record, the ubiquity of geothermal
systems with central volcanic complexes and calderas, and
estimates based on the number of porphyry systems in the
geologic record (Kesler and Wilkinson, 2008). Thus, by them-
selves, alteration by magmatic hydrothermal systems creates
large mineralogical and geochemical anomalies that may
affect baselines for significant regions with arc terrains.
The natural and human-driven life cycles of porphyry
systems bear on all these factors (fig. U2). The geologic
components begin with the physical and chemical architec-
ture that hosts and contributes to formation of ore-forming
intrusive complexes. The hydrothermal systems themselves
are complex, varied entities with major differences between](https://image.slidesharecdn.com/sir2010-5070bporphyry-130509115606-phpapp01/85/Porphyry-Copper-Deposit-Model-140-320.jpg)
![132 Porphyry Copper Deposit Model
Ayuso, R.A., Haeussler, P.J., Bradley, D.C., Wandless,
G.A., Foley, N.K., and Farris, D., 2009, The role of ridge
subduction in determining the geochemistry and Nd–Sr–Pb
isotopic evolution of the Kodiak batholith in Southern
Alaska: Tectonophysics, v. 464, p. 137–163 doi:10.1016/j.
tecto.2008.09.029.
Babcock, R.C., Ballantyne, G.H., and Phillips, C.H., 1995,
Summary of the geology of the Bingham district, Utah, in
Pierce, F.W., and Bolm, J.G., eds., Porphyry copper deposits
of the American Cordillera: Arizona Geological Society
Digest, v. 20, p. 316–335.
Baldwin, J.A., and Pearce, J.A., 1982, Discrimination of
productive and nonproductive porphyritic intrusions in the
Chilean Andes: Economic Geology, v. 77, p. 664–674.
Baldwin, J.T., Swain, H.D., and Clark, G.H., 1978, Geology
and grade distribution of the Panguna porphyry copper
deposit, Bougainville, Papua New Guinea: Economic
Geology, v. 73, p. 690–702.
Ballantyne, G.H., 1981, Chemical and mineralogical varia-
tions in propylitic zones surrounding porphyry copper
deposits: Salt Lake City, University of Utah, Ph.D. thesis,
208 p.
Ballantyne, G.H., Smith, T.W., and Redmond, P.B., 1997,
Distribution and mineralogy of gold and silver in the
Bingham Canyon porphyry copper deposit, Utah, in John,
D.A., and Ballantyne, G.H., eds., Geology and ore deposits
of the Oquirrh and Wasatch Mountains, Utah: Society of
Economic Geologists Guidebook Series, v. 29, p. 147–153.
Banks, N.G., 1973, Biotite as a source of some of the sulfur
in porphyry copper deposits: Economic Geology, v. 68,
p. 697–703.
Banks, N.G., 1982, Sulfur and copper in magma and rocks,
in Titley, S.R., ed., Advances in geology of the porphyry
copper deposits, southwestern North America: Tucson,
Arizona, The University of Arizona Press, p. 227–257.
Barton, Mark, Brown, James, Haxel, Gordon, Hayes, Timothy,
Jensen, Eric, Johnson, David, Kamilli, Robert, Long, Keith,
Maher, David, and Seedorff, Eric, 2005, Center for Mineral
Resources—U.S. Geological Survey–University of Arizona,
Department of Geosciences Porphyry Copper Deposit Life
Cycles Field Conference, southeastern Arizona, May 21–22,
2002: U.S. Geological Survey, Scientific Investigations
Report 2005–5020, 50 p.
Barton, M.D., 1996, Granitic magmatism and metallogeny
of southwestern North America: Transactions of the Royal
Society of Edinburgh, Earth Sciences, v. 87, 261–280.
Barton, M.D., Battles, D.A., Bebout, G.E., Capo, R.C., Chris-
tensen, J.N., Davis, S.R., Hanson, R.B., Michelsen, C.J.,
and Trim, H.E., 1988, Mesozoic contact metamorphism in
the western United States, in Ernst,W.G., ed., Metamor-
phism and crustal evolution, western conterminous United
States: Englewood Cliffs, New Jersey, Prentice-Hall, Rubey
Volume VII, p. 110–178.
Barton, M.D., and Hanson, R.B., 1989, Magmatism and the
development of low-pressure metamorphic belts—Implica-
tions from the western United States and thermal modeling:
Geological Society of America Bulletin, v. 101,
p. 1051–1065.
Barton, M.D., Ilchik, R.P., and Marikos, M.A., 1991, Meta-
somatism, in Kerrick, D.M., ed., Contact metamorphism:
Reviews in Mineralogy 26, p. 321–350.
Barton, M.D., Staude, J.-M., Johnson, D.A., and Snow, E.A.,
1991, Aureole systematics, in Kerrick, D.M., ed., Contact
metamorphism: Reviews in Mineralogy, v. 26, p. 723–847.
Barton, M.D., Seedorff, E., Maher, D.J., Stavast, W.J.A.,
Kamilli, R.J., Hayes, T., Long, K., Haxel, G., and Cook, S.,
2007, Laramide porphyry copper systems and superimposed
Tertiary extension—A life cycle approach to the Globe-
Superior-Ray area—Guide Book No. 4 for Arizona Geolog-
ical Association Ores & Orogenesis Symposium, September
24–30, 2007: Tucson, Arizona Geological Society, 61 p.
Barton, M.D., and Young, S.E., 2002, Non-pegmatitic deposits
of beryllium—Mineralogy, geology, phase equilibria and
origin: Reviews in Mineralogy, v. 50, p. 591–691.
Bartos, P.J., 1987, Prograde and retrograde base metal lode
deposits and their relationship to underlying porphyry
copper deposits: Economic Geology, v. 84, p. 1671–1683.
Barzegar, Hassan, 2007, Geology, petrology and geochemi-
cal characteristics of alteration zones within the Seridune
prospect, Kerman, Iran, [unpublished Ph.D. thesis]: Geo
resources and material technology of the Rheinisch West-
fäli Technical University Aachen, Aachen, Germany,
180 p., http://darwin.bth.rwth-aachen.de/opus3/volltexte
/2007/2009/pdf/Barzegar_Hassan.pdf.
Baumgartner, Regina, Fontboté, L., and Vennemann, T., 2008,
Mineral zoning and geochemistry of epithermal polymetal-
lic Zn-Pb-Ag-Cu-Bi mineralization at Cerro de Pasco, Peru:
Economic Geology, v. 103, p. 493–537.
Beane, R.E., and Bodnar, R.J., 1995, Hydrothermal fluids and
hydrothermal alteration in porphyry copper deposits, in
Pierce, F.W., and Bohm, J.G., eds., Porphyry copper depos-
its of the American Cordillera: Arizona Geological Society
Digest, v. 20, p. 82–93.](https://image.slidesharecdn.com/sir2010-5070bporphyry-130509115606-phpapp01/85/Porphyry-Copper-Deposit-Model-146-320.jpg)
![References Cited 137
DeCelles, P.G., 2004, Late Jurassic to Eocene evolution of the
Cordilleran thrust belt and foreland basin system, western
U.S.A.: American Journal of Science; v. 304, issue 2,
p. 105–168.
Defant, M.J., and Drummond, M.S., 1990, Derivation of some
modern arc magmas by melting of the subducted lithosphere
in a volcanic arc: Geology, v. 21, p. 547–550.
Defant, M.J., and Drummond, M.S., 1993, Mount St Helens—
Potential example of the partial melting of the subducted
lithosphere in a volcanic arc: Geology, v. 21, p. 547–550.
Dickin, A.P., 2005, Radiogenic isotope geology, 2d ed.;
Cambridge University Press, 492 p.
Dickinson, W.R., and Snyder, W.S., 1979, Geometry of triple
junctions related to San Andreas transform: Journal of
Geophysical Research, v. 84, p. 561–572.
Dilles, J.H., 1987, Petrology of the Yerington batholith,
Nevada—Evidence for evolution of porphyry copper ore
fluids: Economic Geology, v. 82, p. 1750–1789.
Dilles, J.H., and Einaudi, M.T., 1992, Wall-rock alteration and
hydrothermal flow paths about the Ann-Mason porphyry
copper deposit, Nevada—A 6-km vertical reconstruction:
Economic Geology, v. 87, p. 1963–2001.
Dilles, J.H., Einaudi, M.T., Proffett, J., and Barton, M.D.,
2000, Overview of the Yerington porphyry copper district—
Magmatic to nonmagmatic sources of hydrothermal
fluids—Their flow paths and alteration effects on rocks and
Cu-Mo-Fe-Au ores: Society of Economic Geologists Guide-
book Series, v. 32, p. 55–66.
Dilles, J.H., and Gans, P.B., 1995, The chronology of Ceno-
zoic volcanism and deformation in the Yerington area,
western Basin and Range and Walker Lane: Geological
Society of America Bulletin, v. 107, p. 474–486.
Dilles, J.H., Martin, M.W., Stein, H., and Rusk, B., 2003,
Re-Os and U-Pb ages for the Butte copper district,
Montana—A short- or long-lived hydrothermal system?
[abs]: Geological Society of America Abstracts with
Programs, v. 35, no. 6, p. 400.
Dilles, J.H., and Proffett, J.M., 1995, Metallogenesis of the
Yerington batholith, Nevada, in Pierce, F.W., and Bolm,
J.G., eds., Porphyry copper deposits of the American
Cordillera: Arizona Geological Society Digest, v. 20,
p. 306–315.
Dilles, J.H., Proffett, John, and Einaudi, M.T., 2000b,
Magmatic and hydrothermal features of the Yerington
batholith with emphasis on the porphyry copper (Mo)
deposit in the Ann-Mason area: Society of Economic Geolo-
gists Guidebook Series, v. 32, p. 67–89.
Dilles, J.H., Soloman, G.C., Taylor, H.P., Jr., and Einaudi,
M.T., 1992, Oxygen and hydrogen isotope characteristics
of the Ann-Mason porphyry copper deposit, Yerington,
Nevada: Economic Geology, v. 87, p. 44–63.
Dilles, J.H., Tomlinson, A.J., Martin, M.W., and Blanco,
N., 1997, El Abra and Fortuna complexes—A porphyry
copper batholith sinistrally displaced by the Falla Oeste:
Congreso Geológico Chileano, Actas, 8th, Antofagasta, v. 3,
p. 1883–1887.
Dilles, J.H., and Wright, J.E., 1988, The chronology of
early Mesozoic arc magmatism in the Yerington district,
Nevada, and its regional implications: Geological Society of
America Bulletin, v. 100, p. 644–652.
Dimitrijevic, M.D., 1973, Geology of the Kerman Region:
Geological Survey of Iran, Tehran, Report Yu/52.
Doe, B.R., 1978, The application of lead isotopes to mineral
prospect evaluation of Cretaceous-Tertiary magmatothermal
ore deposits in the western United States, in Watterson, J.R.,
and Theobald, P.K., eds., Geochemical Exploration 1978,
Proceedings 7th International Geochemical Exploration
Symposium: Golden, Colorado, Association of Exploration
Geochemists, p. 227–232.
Doe, B.R., and Stacey, J.S., 1974, The application of lead
isotopes to the problems of ore genesis and ore pros-
pect evaluation—A review: Economic Geology, v. 69,
p. 757–776.
Dold, Bernhard, and Fontboté, Lluis, 2001, Element cycling
and secondary mineralogy in porphyry copper tailings as
a function of climate, primary mineralogy, and mineral
processing: Journal of Geochemical Exploration, v. 74,
p. 3–55.
Downing, B.W., 2009, Acid rock generation/drainage in
mineral deposits throughout time (Kemess case study),
http://technology.infomine.com/enviromine/ard/Case%20
Studies/kemess.html accessed last on March 10, 2010.
Drew, L.J., 2006, A tectonic model for the spatial occurrence
of porphyry copper and polymetallic vein deposits—Appli-
cations to Central Europe: U.S. Geological Survey Scien-
tific Investigations Report 2005–5272, 36 p.
Drummond, M.S., and Defant, M.J., 1990, Derivation of some
modern arc magmas by melting of young subducted litho-
sphere: Nature, v. 347, p. 662–665.
Drummond, M.S., Defant, M.J., and Kepezhinskas, P.K., 1996,
Petrogenesis of slab derived trondjhemite-tonalite-dacite/
adakite magmas: Geological society of America, Special
Paper 315, p. 205–215.
Dummett, H.T., 1978, Geology of the Moonmera porphyry
deposit, Queensland, Australia: Economic Geology, v. 73,
p. 922–944.](https://image.slidesharecdn.com/sir2010-5070bporphyry-130509115606-phpapp01/85/Porphyry-Copper-Deposit-Model-151-320.jpg)
![References Cited 141
Halter, W.E., Heinrich, C.A., and Tettke, Thomas, 2005,
Magma evolution and the formation of porphyry Cu-Au ore
fluids—Evidence from silicate and sulfide melt inclusions:
Mineralium Deposita, v. 39, p. 845–863.
Han, C., Xiao, W., Zhao, G., Mao, J., Yang, J., Wang, Z.,
Yan, Z., and Mao, Q., 2006, Geological characteristics
and genesis of the Tuwu porphyry copper deposits, Hami,
Xinjiang, central Asia: Ore Geology Reviews, v. 29,
p. 77–94.
Hansen, H.K., Yianatos, J.B., and Ottosen, L.M., 2005,
Speciation and leachability of copper in mine tailings
from porphyry copper mining—Influence of particle size:
Chemosphere, v. 60, p. 1497–1503.
Hanson, R.B., 1996, Hydrodynamics of magmatic and mete-
oric fluids in the vicinity of granitic intrusions: Transactions
of the Royal Society of Edinburgh, Earth Sciences, v. 87,
p. 251–259.
Harris, A.C., Bryan, S.E., and Holcombe, R.J., 2006, Volca-
nic setting of the Bajo de la Alumbrera porphyry Cu-Au
deposit, Farallón Negro volcanics, northwest Argentina:
Economic Geology, v. 101, p. 71–94.
Harris, A.C., Dunlap, W.J., Reiners, P.W., Allen, C.M., Cooke,
D.R., White, N.C., Campbell, I.H., and Golding, S.D., 2008,
Multimillion year thermal history of a porphyry copper
deposit—Application of U-Pb, 40
Ar/39
Ar and (U-Th)/He
chronometers, Bajo de la Alumbrera copper-gold deposit,
Argentina: Mineralium Deposita, v. 43, p. 295–314.
Hartley, A.J., and Rice, C.M., 2005, Controls on supergene
enrichment of porphyry copper deposits in the Central
Andes—A review and discussion: Mineralium Deposita,
v. 40, p. 515–525.
Haschke, M.R., Gunther, A., and Scheuber, E., 2002, Repeated
crustal thickening and recycling during the Andean orogeny
in north Chile (21°-26°S): Journal of Geophysical Research,
v. 107, ECV 6 1–18.
Hassanzadeh, Jamshid, 1993, Metallogenic and tectonomag-
matic events in the SE sector of the Cenozoic active conti-
nental margin of central Iran (Shahr e Babak area, Keman
Province): Los Angeles, University of California, Ph.D.
thesis, 204 p.
Haxel, G.B., Johnson, D.A., Briskey, J.A., and Tosdal, R.M.,
2003, Abundance and behavior of ore and other metals in
latest Cretaceous to early Tertiary (“Laramide”) metalumi-
nous and peraluminous granitoids, south-central Arizona
and north-central Sonora [abs.]: Geological Society of
America, Abstracts with Programs, v. 35, no. 6, p. 232.
Hedenquist, J.W., 1990, The thermal and geochemical struc-
ture of the Broadlands-Ohaaki geothermal system: Geother-
mics, v. 19, p. 151–185.
Hedenquist, J.W., Arribas, Antonio, Jr., and Gonzalez-Urien,
Eliseo, 2000, Exploration for epithermal gold deposits,
in Hagemann, S.G., and Brown, P.E., eds., Gold in 2000:
Reviews in Economic Geology, v. 13, p. 245–277.
Hedenquist, J.W., Arribas, A., Jr., and Reynolds, T.J., 1998,
Evolution of an intrusion-centered hydrothermal system—
Far Southeast-Lepanto porphyry and epithermal Cu-Au
deposits, Philippines: Economic Geology, v. 93, p. 373–404.
Hedenquist, J.W., and Richards, J.P., 1998, The influence of
geochemical techniques on the development of genetic
models for porphyry copper deposits: Reviews in Economic
Geology, v. 10, p. 235–256.
Heidrick, T.L., and Titley, S.R., 1982, Fracture and dike
patterns in Laramide plutons and their structural and
tectonic implications, in Titley, S.R., ed., Advances in
geology of the porphyry copper deposits, southwest-
ern United States: Tucson, University of Arizona Press,
p. 73–92.
Heinrich, C.A., 2005, The physical and chemical evolution of
low- to medium-salinity magmatic fluids at the porphyry to
epithermal transition—A thermodynamic study: Mineralium
Deposita, v. 39, p. 864–889.
Heinrich, C.A., 2007, Fluid-fluid interactions in magmatic-
hydrothermal ore formation: Reviews in Mineralogy and
Geochemistry, v. 65, p. 363–387.
Heinrich, C.A., Günter, D., Audétat, A., Ulrich, T., and Frisch-
knecht, R., 1999, Metal fractionation between magmatic
brine and vapor determined by microanalysis of fluid inclu-
sions: Geology, v. 27, p. 755–758.
Hemley, J.J., Cygan, G.L., Fein, J.B., Robinson, G.R.,
and d’Angelo, W.M., 1992, Hydrothermal ore-forming
processes in the light of studies in rock-buffered systems—
I. Iron-copper-zinc-lead sulfide solubility relations:
Economic Geology, v. 87, p. 1–22.
Hemley, J.J., and Hunt, J.P., 1992, Hydrothermal ore-forming
processes in the light of studies in rock-buffered systems:
II. Some general geologic applications: Economic Geology,
v. 87, p. 23–43.
Hemley, J.J., and Jones, W.R., 1964, Chemical aspects of
hydrothermal alteration with emphasis on hydrogen meta
somatism: Economic Geology, v. 59, p. 538–569.
Hemley, J.J., Montoya, J.W., Marinenko, J.W., and Luce,
R.W., 1980, Equilibria in the system Al2
O3
-SiO2
-H2
O and
some general implications for alteration/mineralization
processes: Economic Geology, v. 75, p. 210–228.](https://image.slidesharecdn.com/sir2010-5070bporphyry-130509115606-phpapp01/85/Porphyry-Copper-Deposit-Model-155-320.jpg)
![160 Porphyry Copper Deposit Model
Name: Bingham Canyon, Utah
Location: 40.53°N., 112.15°W.
Grade/Tonnage: Singer and others (2008): 3,230 Mt,
0.882 percent Cu, 0.38 g/t Au, 0.053 percent Mo, 3.3 g/t Ag
Associated Deposits: Cu-Au skarns in surrounding carbonate
beds (Carr Fork and North Ore Shoot deposits); polymetal-
lic vein and replacement deposits (Ag-Pb-Zn; Lark and U.S.
mines); distal sediment-hosted gold deposits (Barneys Canyon
and Melco)
Regional Geologic Setting: Late Paleozoic siliceous and
carbonate sedimentary rocks overlain and intruded by Eocene
intermediate composition volcanic and intrusive rocks
Regional Tectonic Setting: Located on the western end of the
Uinta axis, which is a suture between the Archean Wyoming
Province to the north and Proterozoic basement rocks to the
south. Area of thrusting and folding from the Late Cretaceous
Sevier Orogeny. Minor NNW–SSE-extension during mid-
Tertiary magmatism
Significant structural control on magma emplacement and
mineralization (Y/N): Yes, Eocene intrusions emplaced along
Unita axis and subparallel NE-striking extensional faults. Fold
axes and thrust faults related to the Sevier Orogeny were an
ore control.
Primary Host Rocks: Eocene equigranular to porphyry intru-
sions (Bingham stock and porphyry dikes)
Primary Associated Igneous Rocks: Monzonite, quartz
monzonite porphyry, latite porphyry, quartz latite porphyry,
biotite porphyry, quartz latite porphyry breccia, minette dikes
(57.5–59 weight percent SiO2
), melanonephelenite (sodic with
low Al2
O3
), shoshonite (52–59 weight percent SiO2
)
Inferred Mineralizing Intrusions: Bingham stock (quartz
monzonite porphyry)
Some contribution from latite porphyry, biotite porphyry,
quartz latite porphyry breccia, quartz latite porphyry
Age of Mineralization: 38.55±0.19 Ma (U-Pb zircon from
Bingham stock monzonite); 37.00±0.27 Ma (Re-Os on molyb-
denite); 37.57±0.11 to 37.07±0.21 Ma (Ar-Ar on hydrothermal
biotite)
Major Alteration Types: Potassic (quartz+potassium
feldspar+biotite), propylitic (epidote, chlorite, calcite, minor
potassium feldspar), sericitic, argillic
Alteration Zoning: Inner potassic and outer propylitic; late
argillic and sericitic
Major Ore Minerals and Assemblages: Barren core sur-
rounded outward and upward by assemblages that gradation-
ally change from molybdenite + magnetite ± pyrite; bornite
+ chalcopyrite ±molybdenite; chalcopyrite + pyrite; pyrite +
chalcopyrite; pyrite;
Highest copper grade of deposit coincides with the bornite +
chalcopyrite zone.
Major Vein Types and Relative Ages: Oldest to youngest:
brown-green veins of biotite and sericite with bornite, chalcoc-
ite and chalcopyrite; biotite veinlets; stockwork quartz veins
(5 types) with increasing sulfide content with time; quartz-
molybdenite veins; pyrite±quartz veins
Major Style(s) of Mineralization: Disseminated, stockwork
vein
Metal Zoning: Concentric with a low-grade core grading
upward and laterally to a molybdenite zone, copper shell,
pyrite halo, Pb-Zn-Ag zone, and an outer Au zone
Depth of Ore Formation: 2.5–3 km
Post-Ore Deformation: About 15° eastward tilting due to
Late Cenozoic Basin and Range extensional faulting
Other Notable Features: First porphyry copper deposit
mined by open pit methods
Important References:
Boutwell (1905), Hunt (1933), Lanier and others (1978),
Atkinson and Einaudi (1978), Bowman and others (1987),
Babcock and others (1995), Presnell (1997), Waite and others
(1997), Phillips and others (1997), Parry and others (2001),
Maughan and others (2002), Redmond and others (2004),
Cunningham and others (2004), Phillips and others (2005),
Landtwing and others (2005), Core and others (2006).
Name: Butte, Montana
Location: 46.017°N, 112.511°W.
Grade/Tonnage: Singer and others (2008): 5,220 Mt,
0.673 percent Cu, 0.042 g/t Au, 0.028 percent Mo, 8.6 g/t Ag
Associated Deposits: Main stage veins (“Cordilleran-style”
polymetallic [Cu, Pb, Zn, Ag, Au, Mn] veins)
Regional Geologic Setting: Late Cretaceous composite Boul-
der batholith emplaced into Proterozoic sedimentary rocks of
the Paleoproterozoic Belt Supergroup and Archean crystalline
basement that are juxtaposed by the Paleoproterozoic Great
Falls tectonic zone
Regional Tectonic Setting: Boulder batholith emplaced dur-
ing Late Cretaceous-early Tertiary (Laramide) Cordilleran
folding and thrusting. Boulder batholith emplaced along inter-
section of a northeast-trending Paleoproterozoic suture (Great
Falls tectonic zone) and a northwest-trending, multiply-reacti-
vated Mesoproterozoic fracture system (Lewis and Clark line)
Significant structural control on magma emplacement and
mineralization (Y/N): Yes, but varying interpretations. Butte
overlies an intersection of basement structures (Great Falls](https://image.slidesharecdn.com/sir2010-5070bporphyry-130509115606-phpapp01/85/Porphyry-Copper-Deposit-Model-174-320.jpg)


This document provides a summary of the porphyry copper deposit model. It describes porphyry copper deposits as large-scale hydrothermal systems centered on porphyritic intrusions. Key points include: - Porphyry copper deposits form in arc settings and are associated with porphyritic intrusions emplaced at depths between 1-4 km. - Deposits can extend laterally over 1-4 km and vertically over 1-2 km. They contain both hypogene copper-bearing sulfide minerals and supergene copper oxide and sulfate minerals. - Deposits display hydrothermal alteration assemblages including potassic, phyllic, argillic, and propylitic zones


