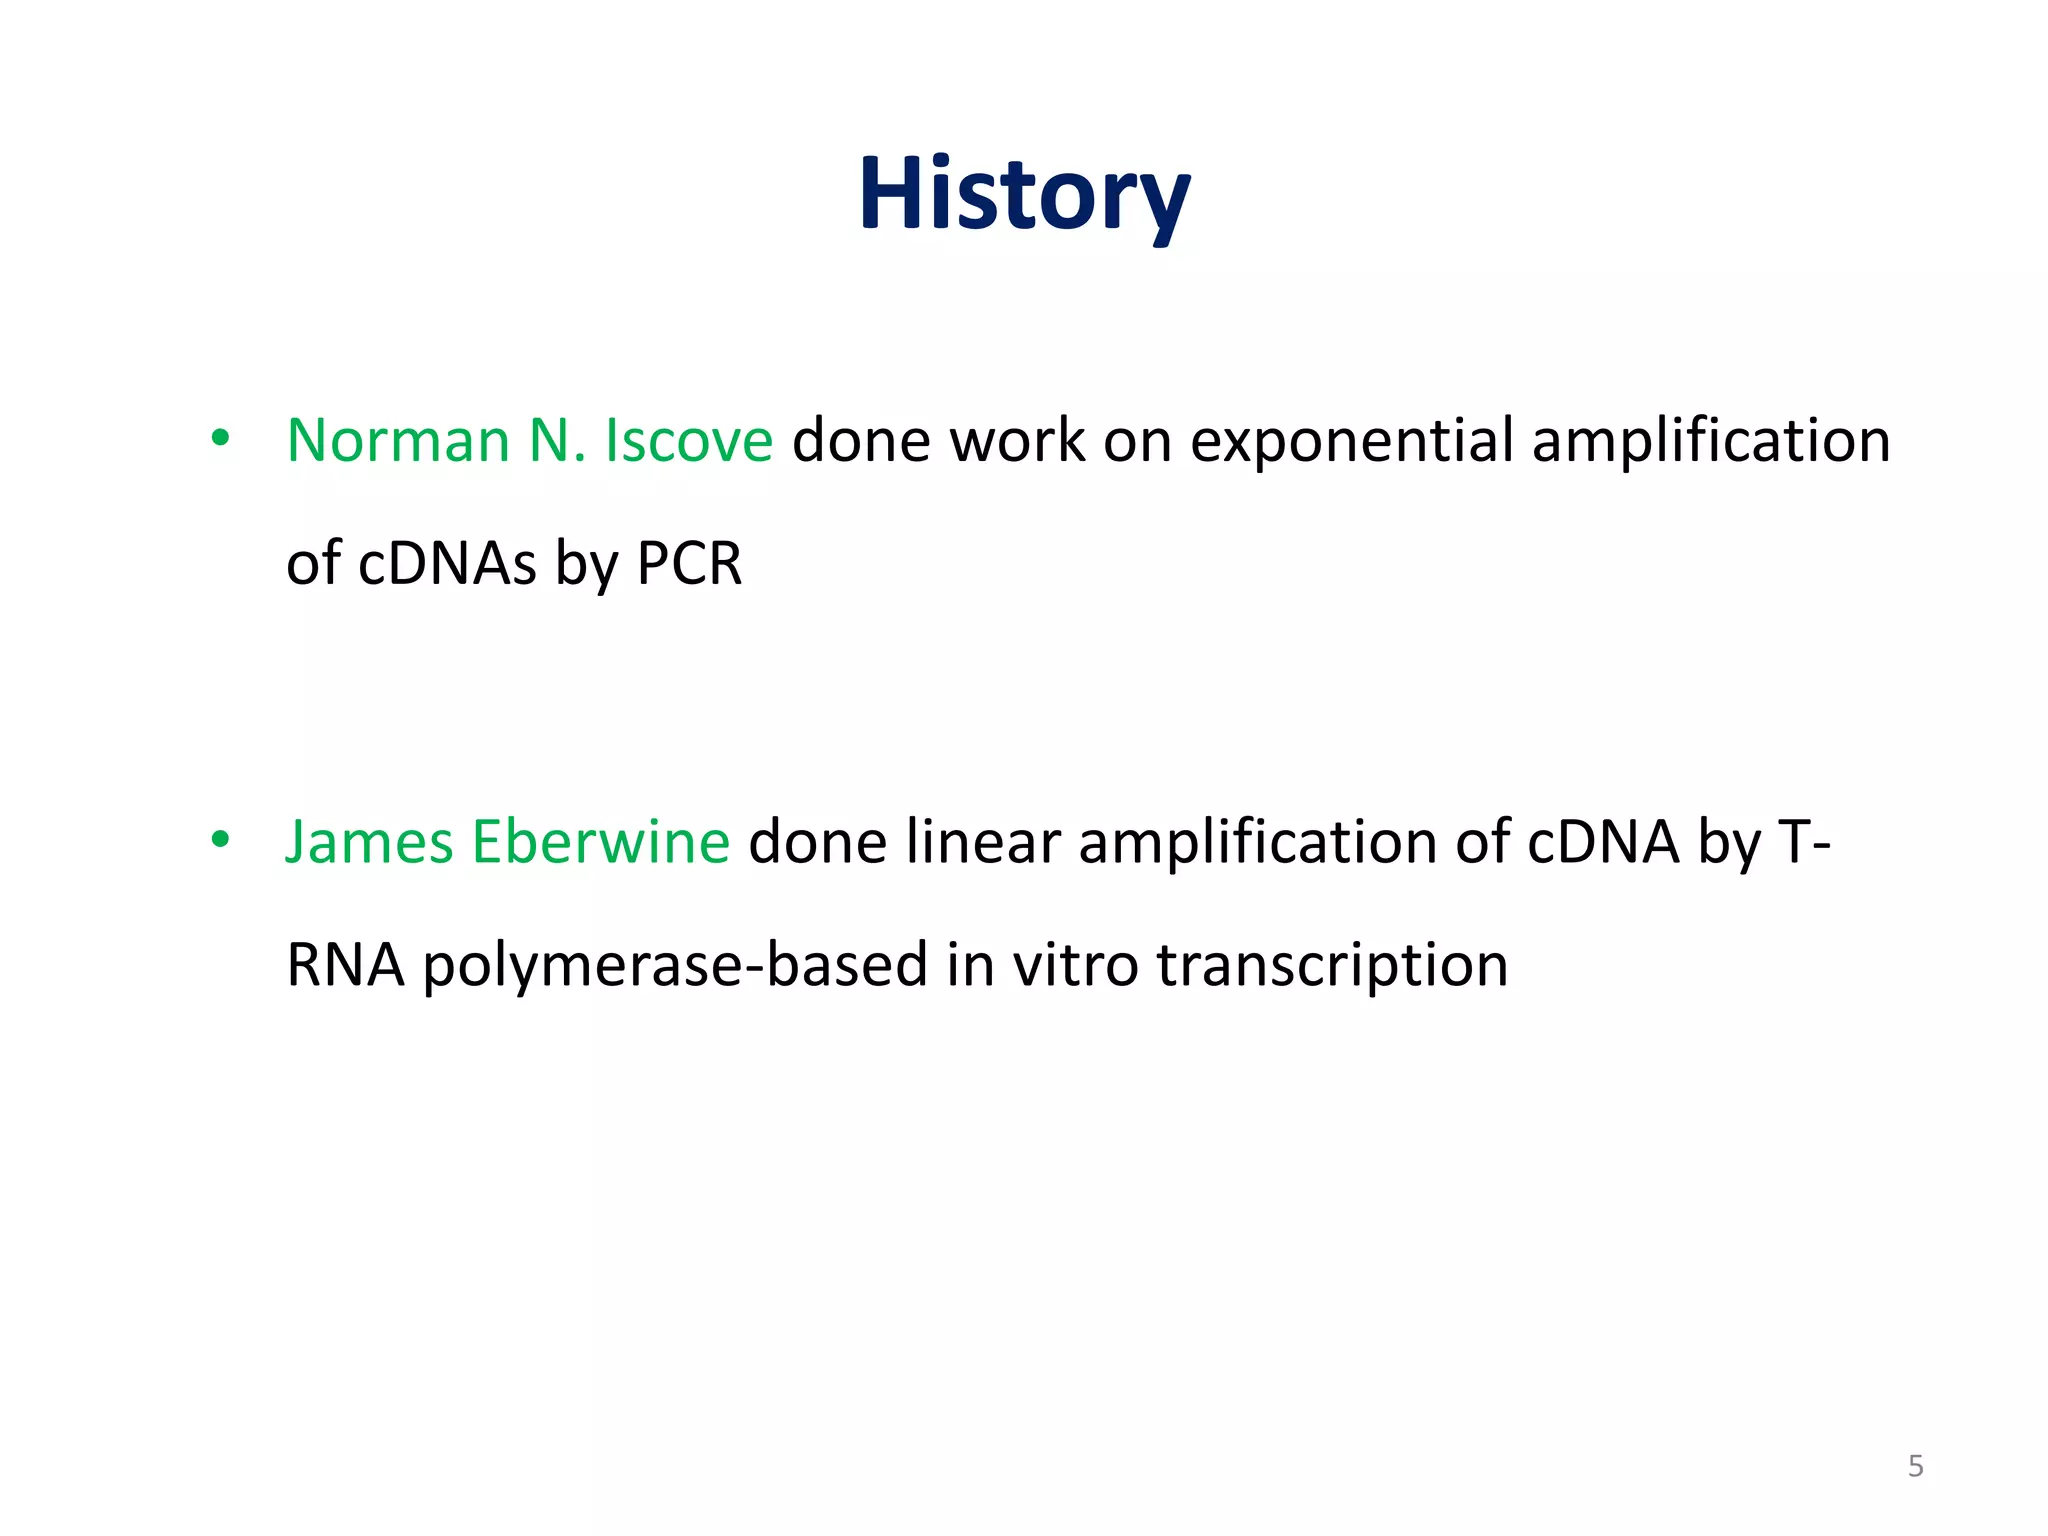
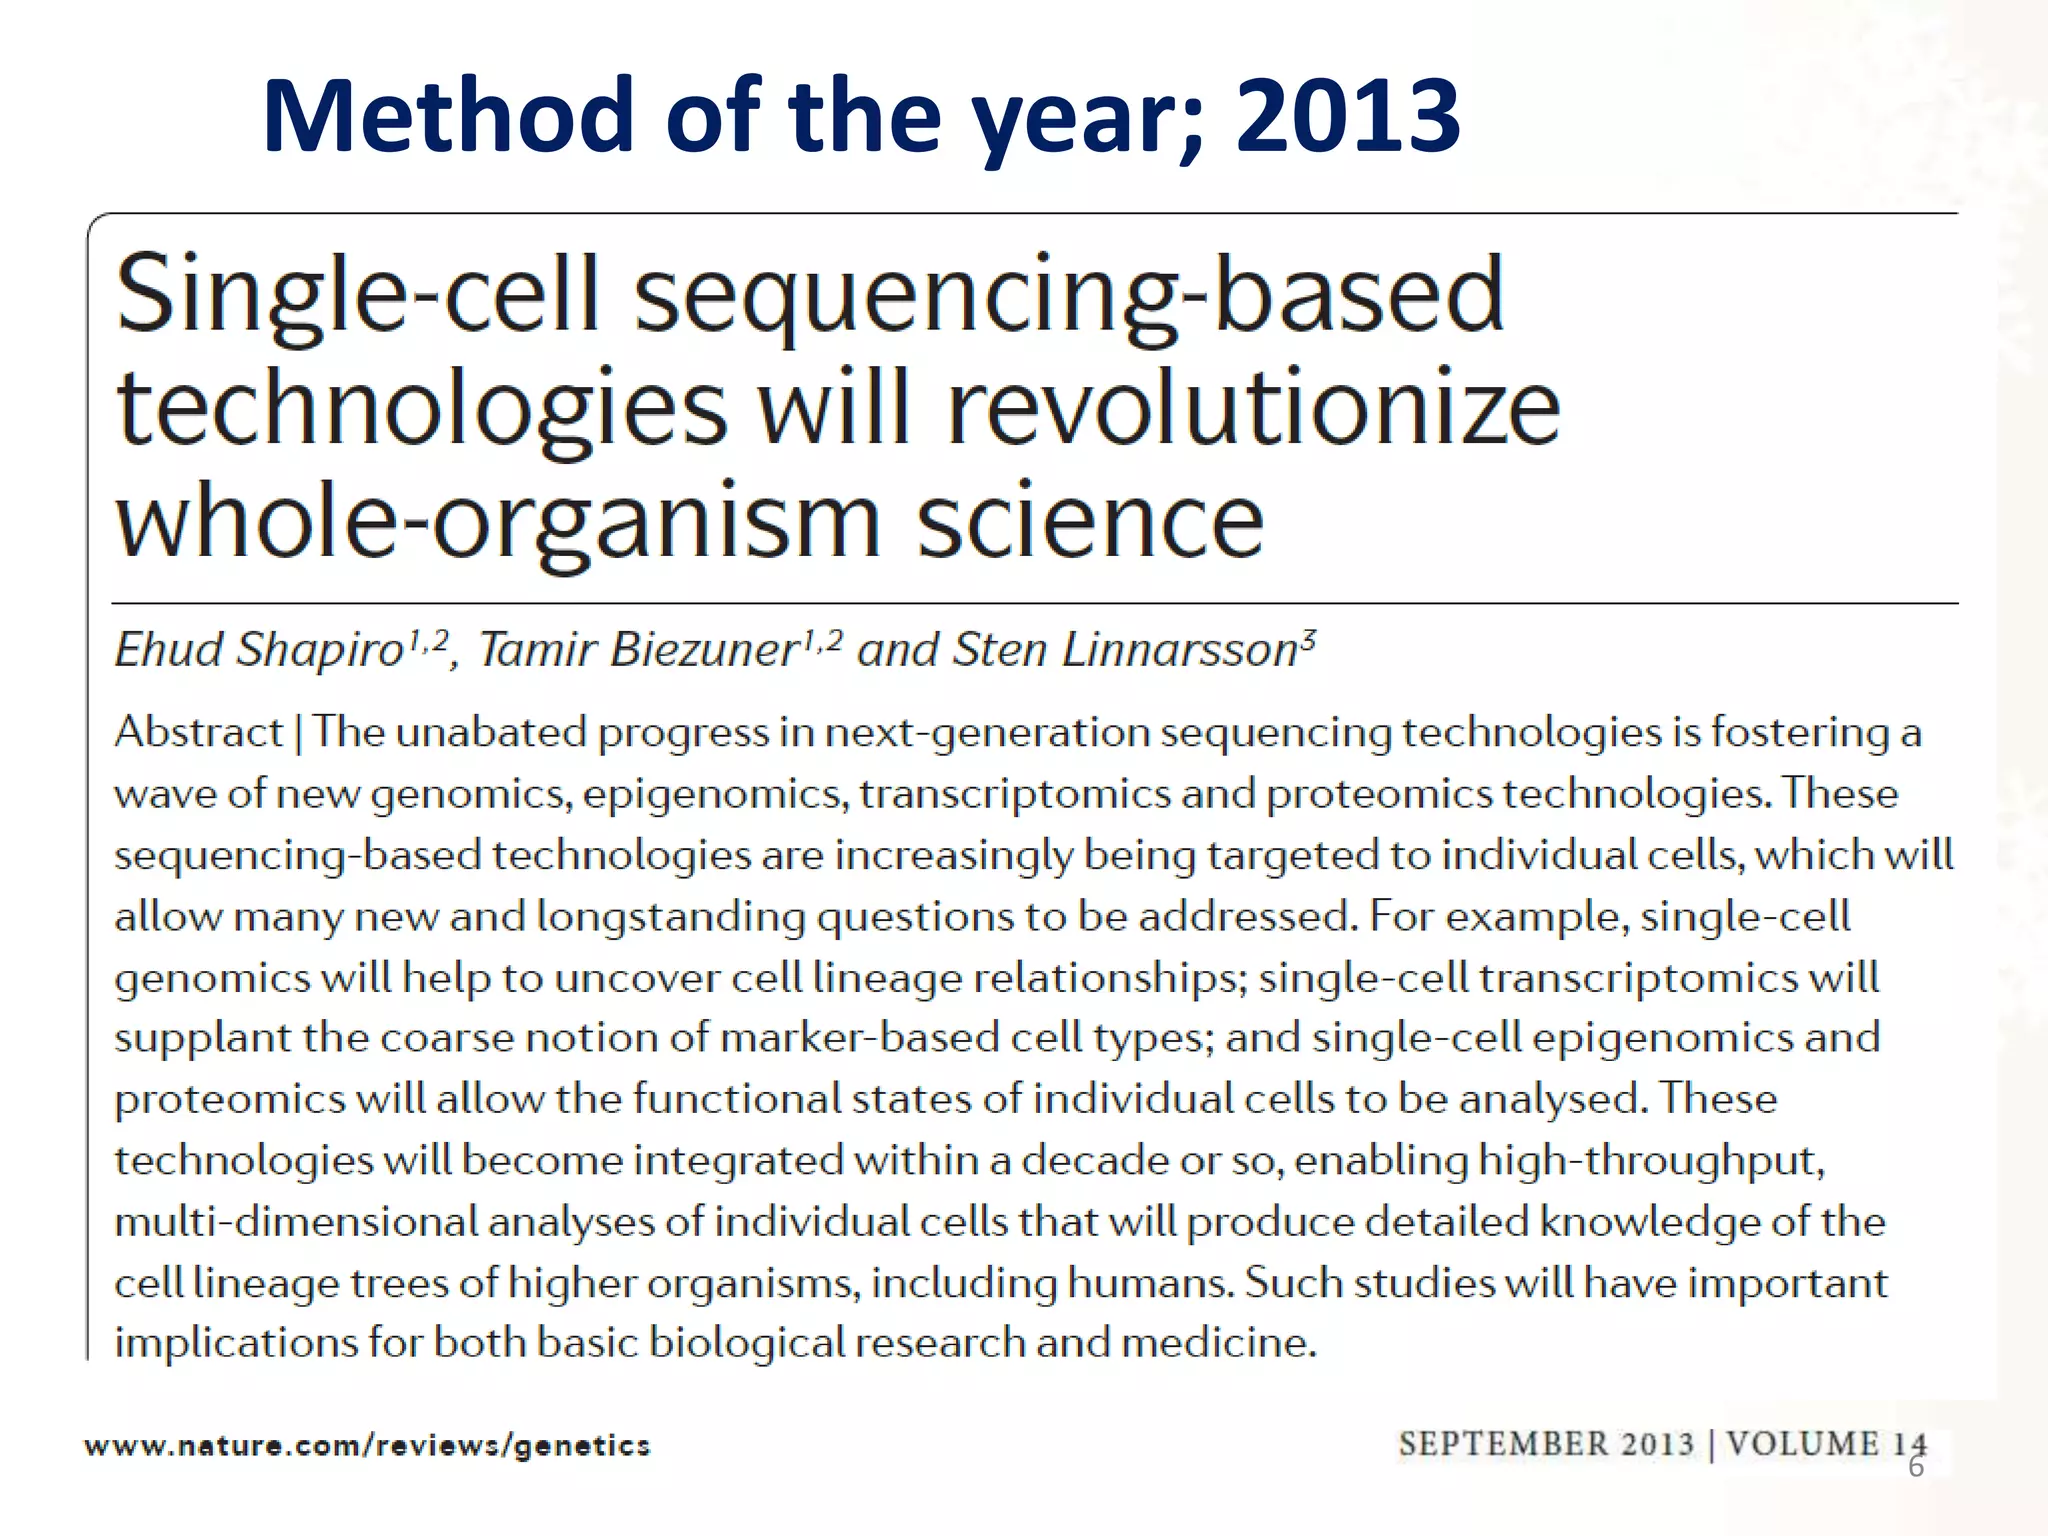
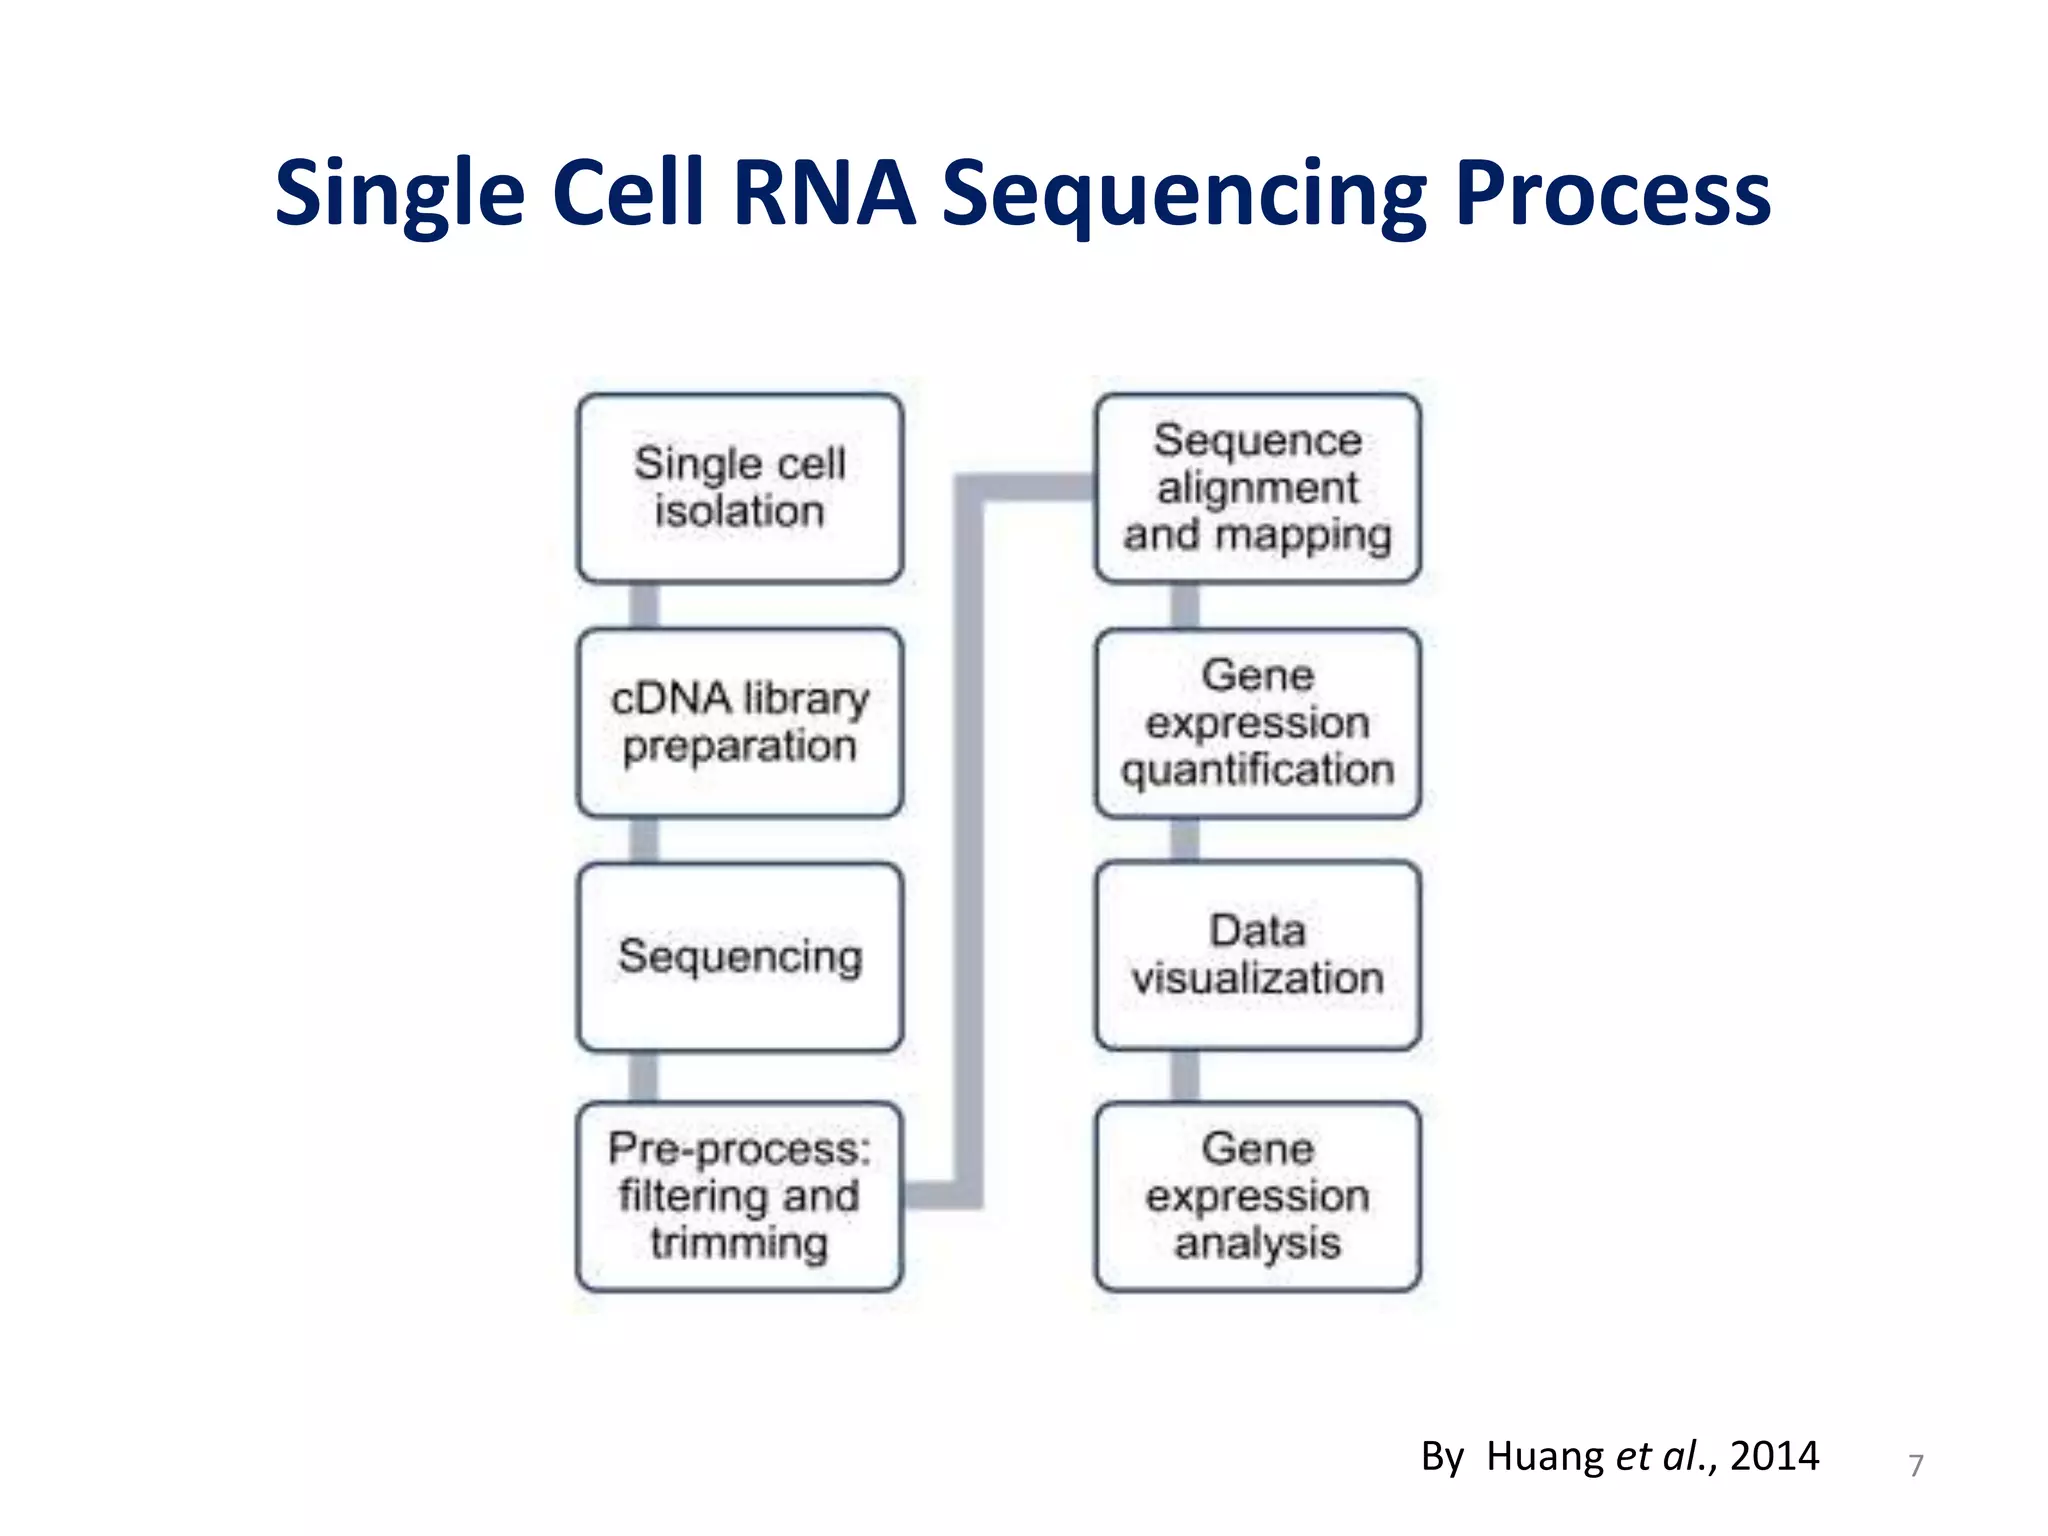
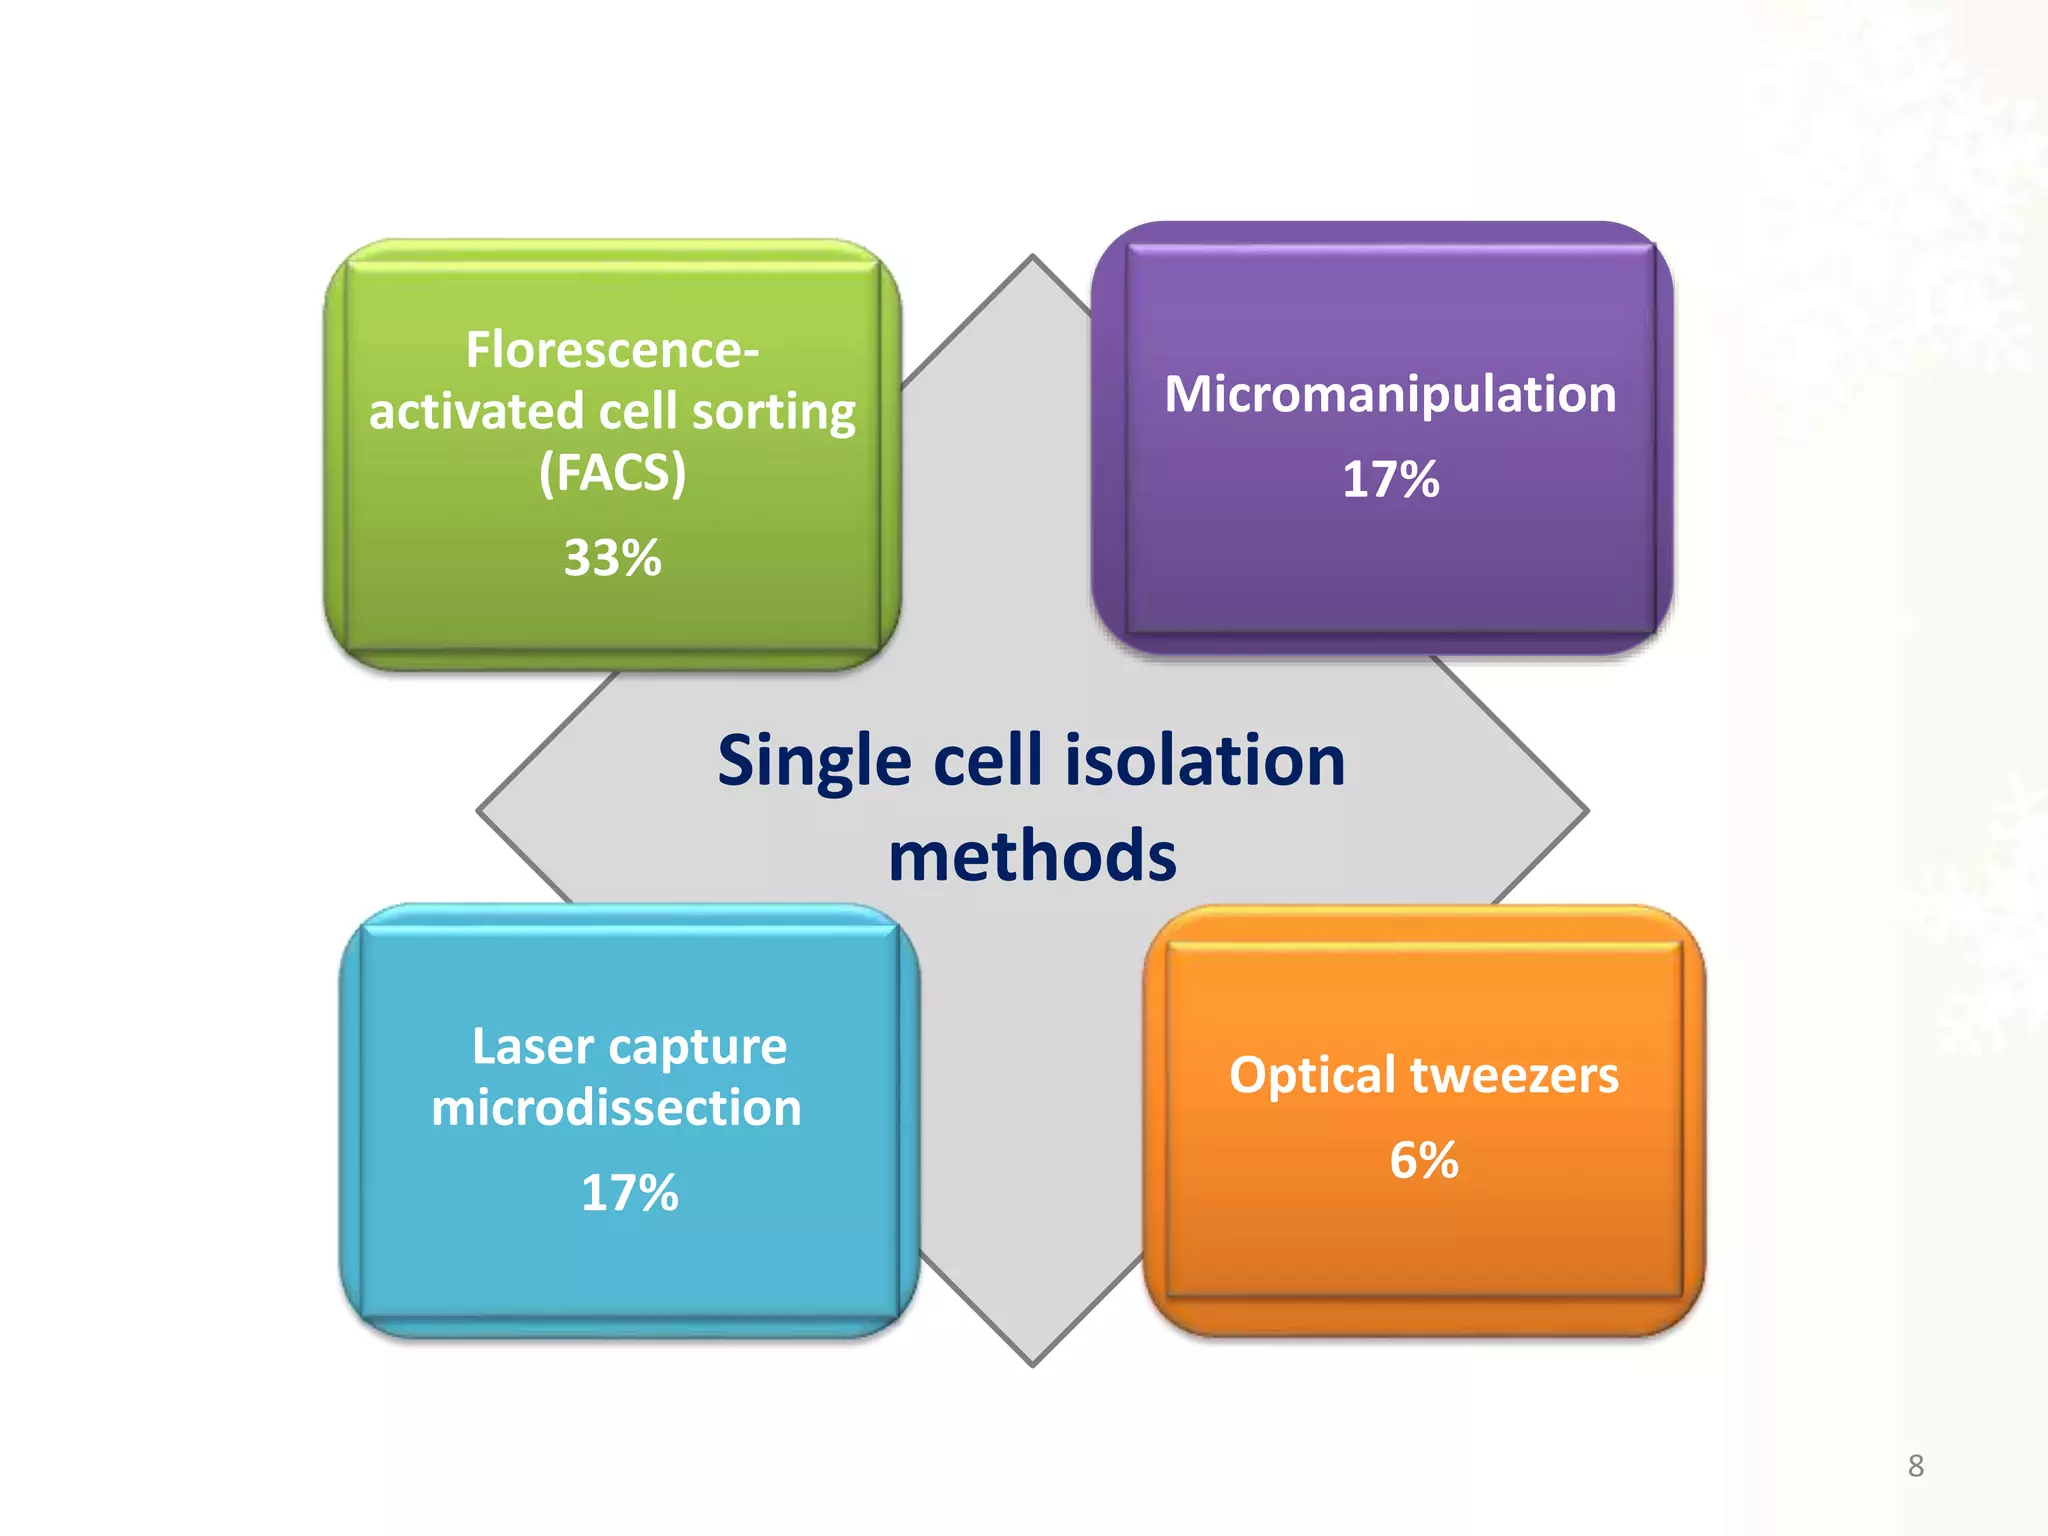
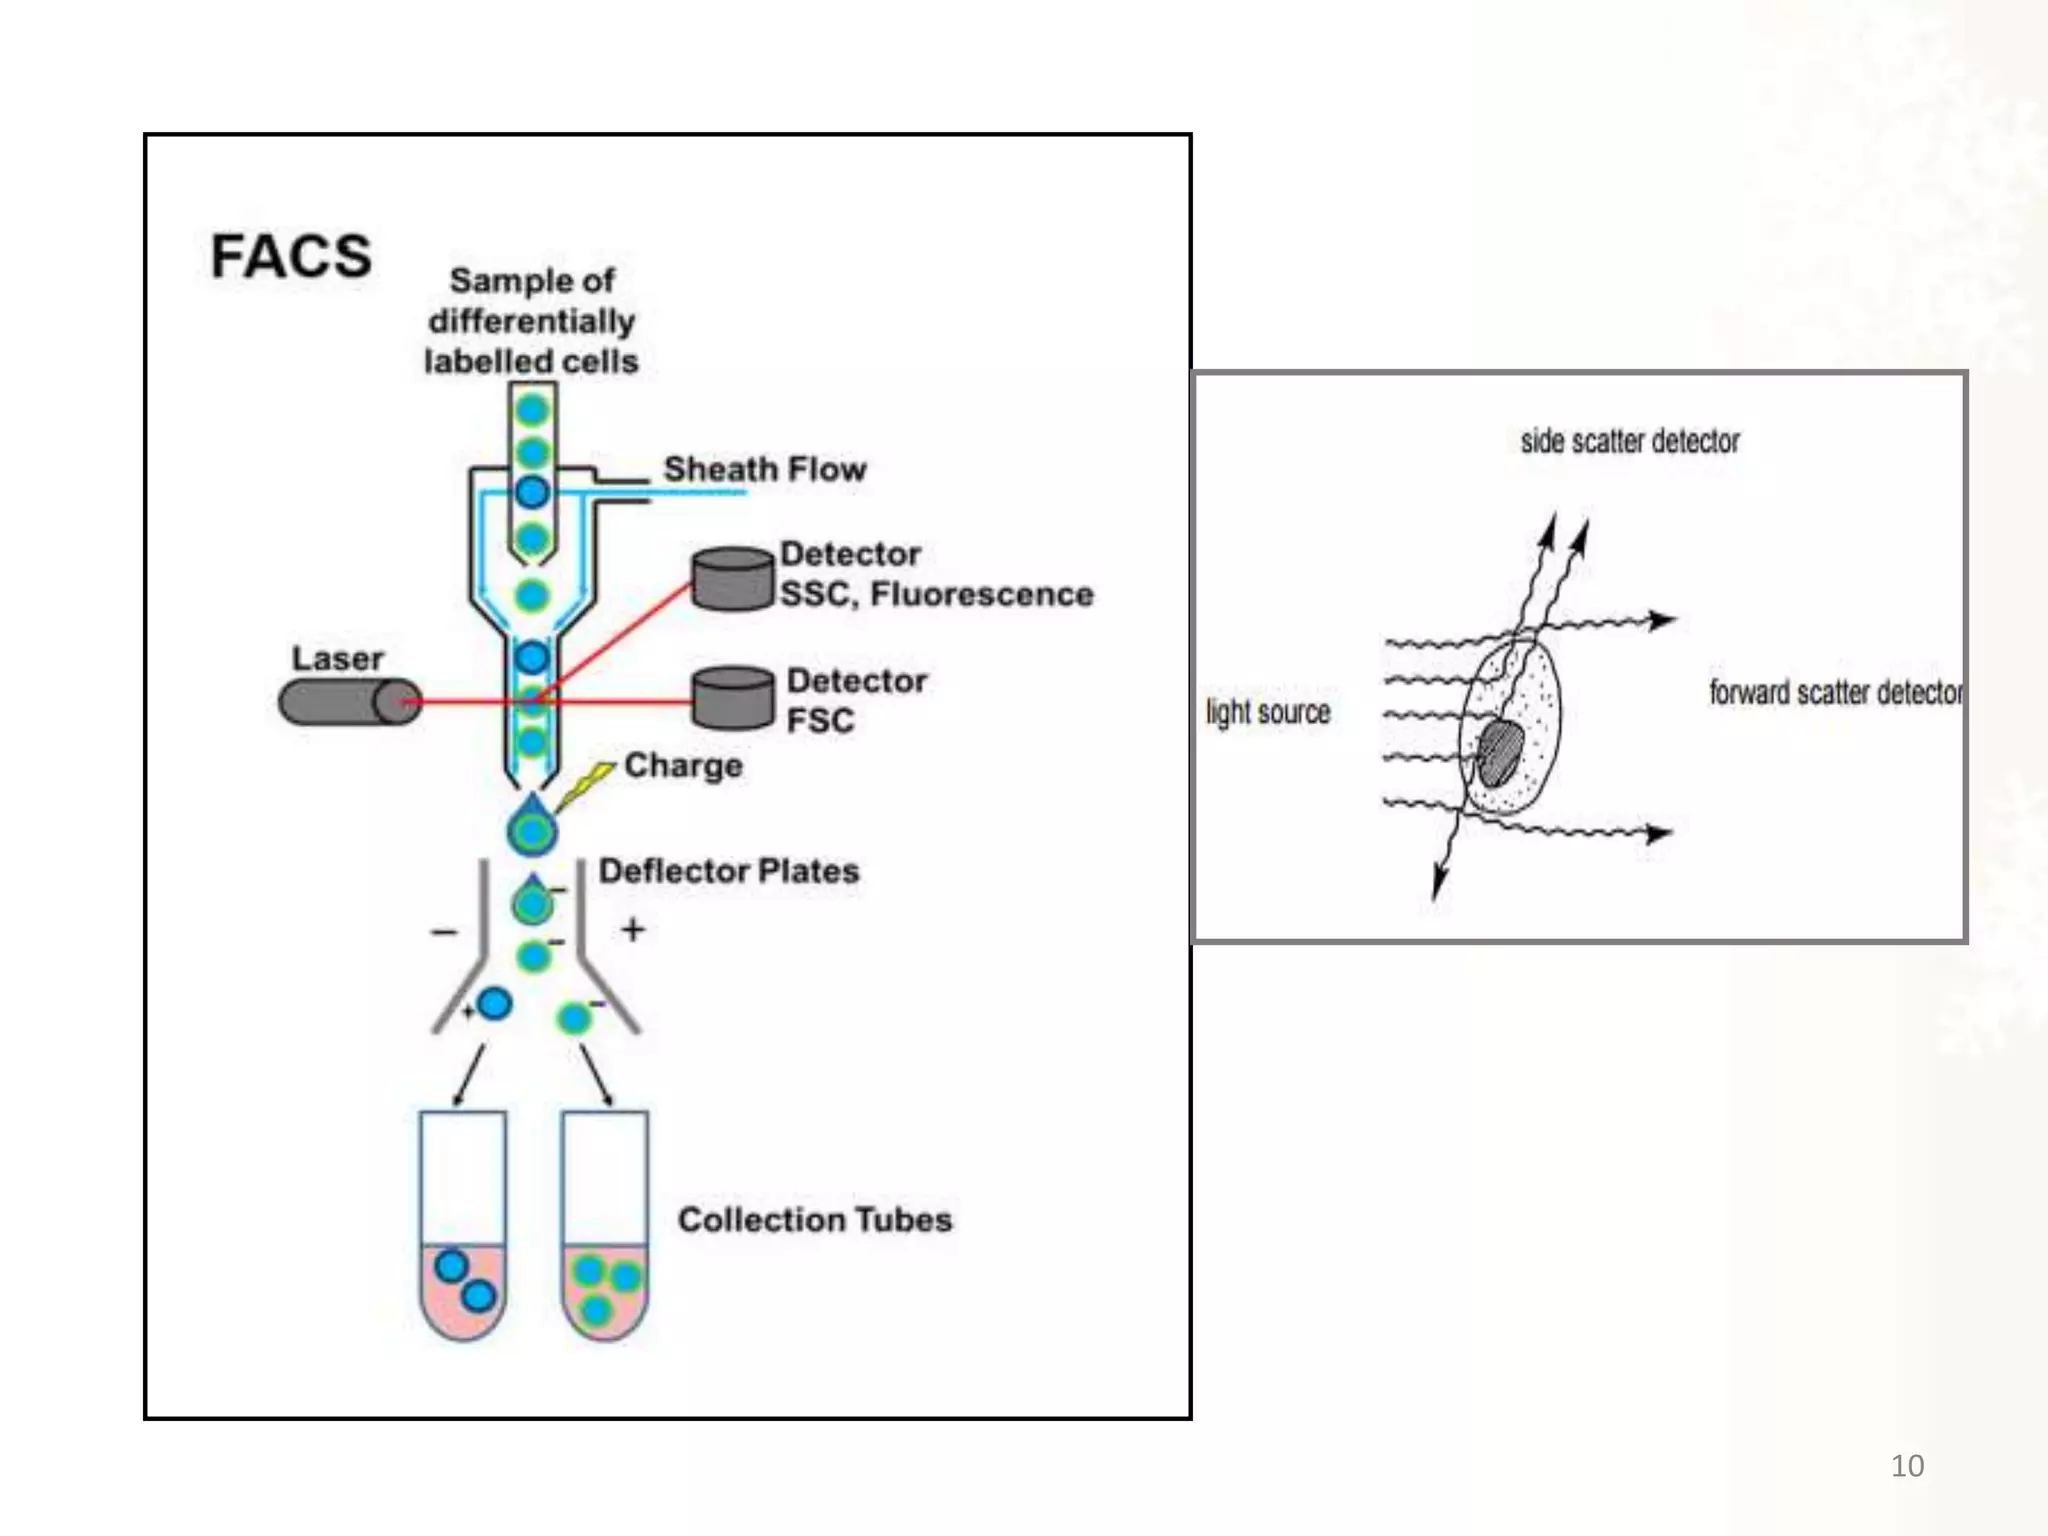
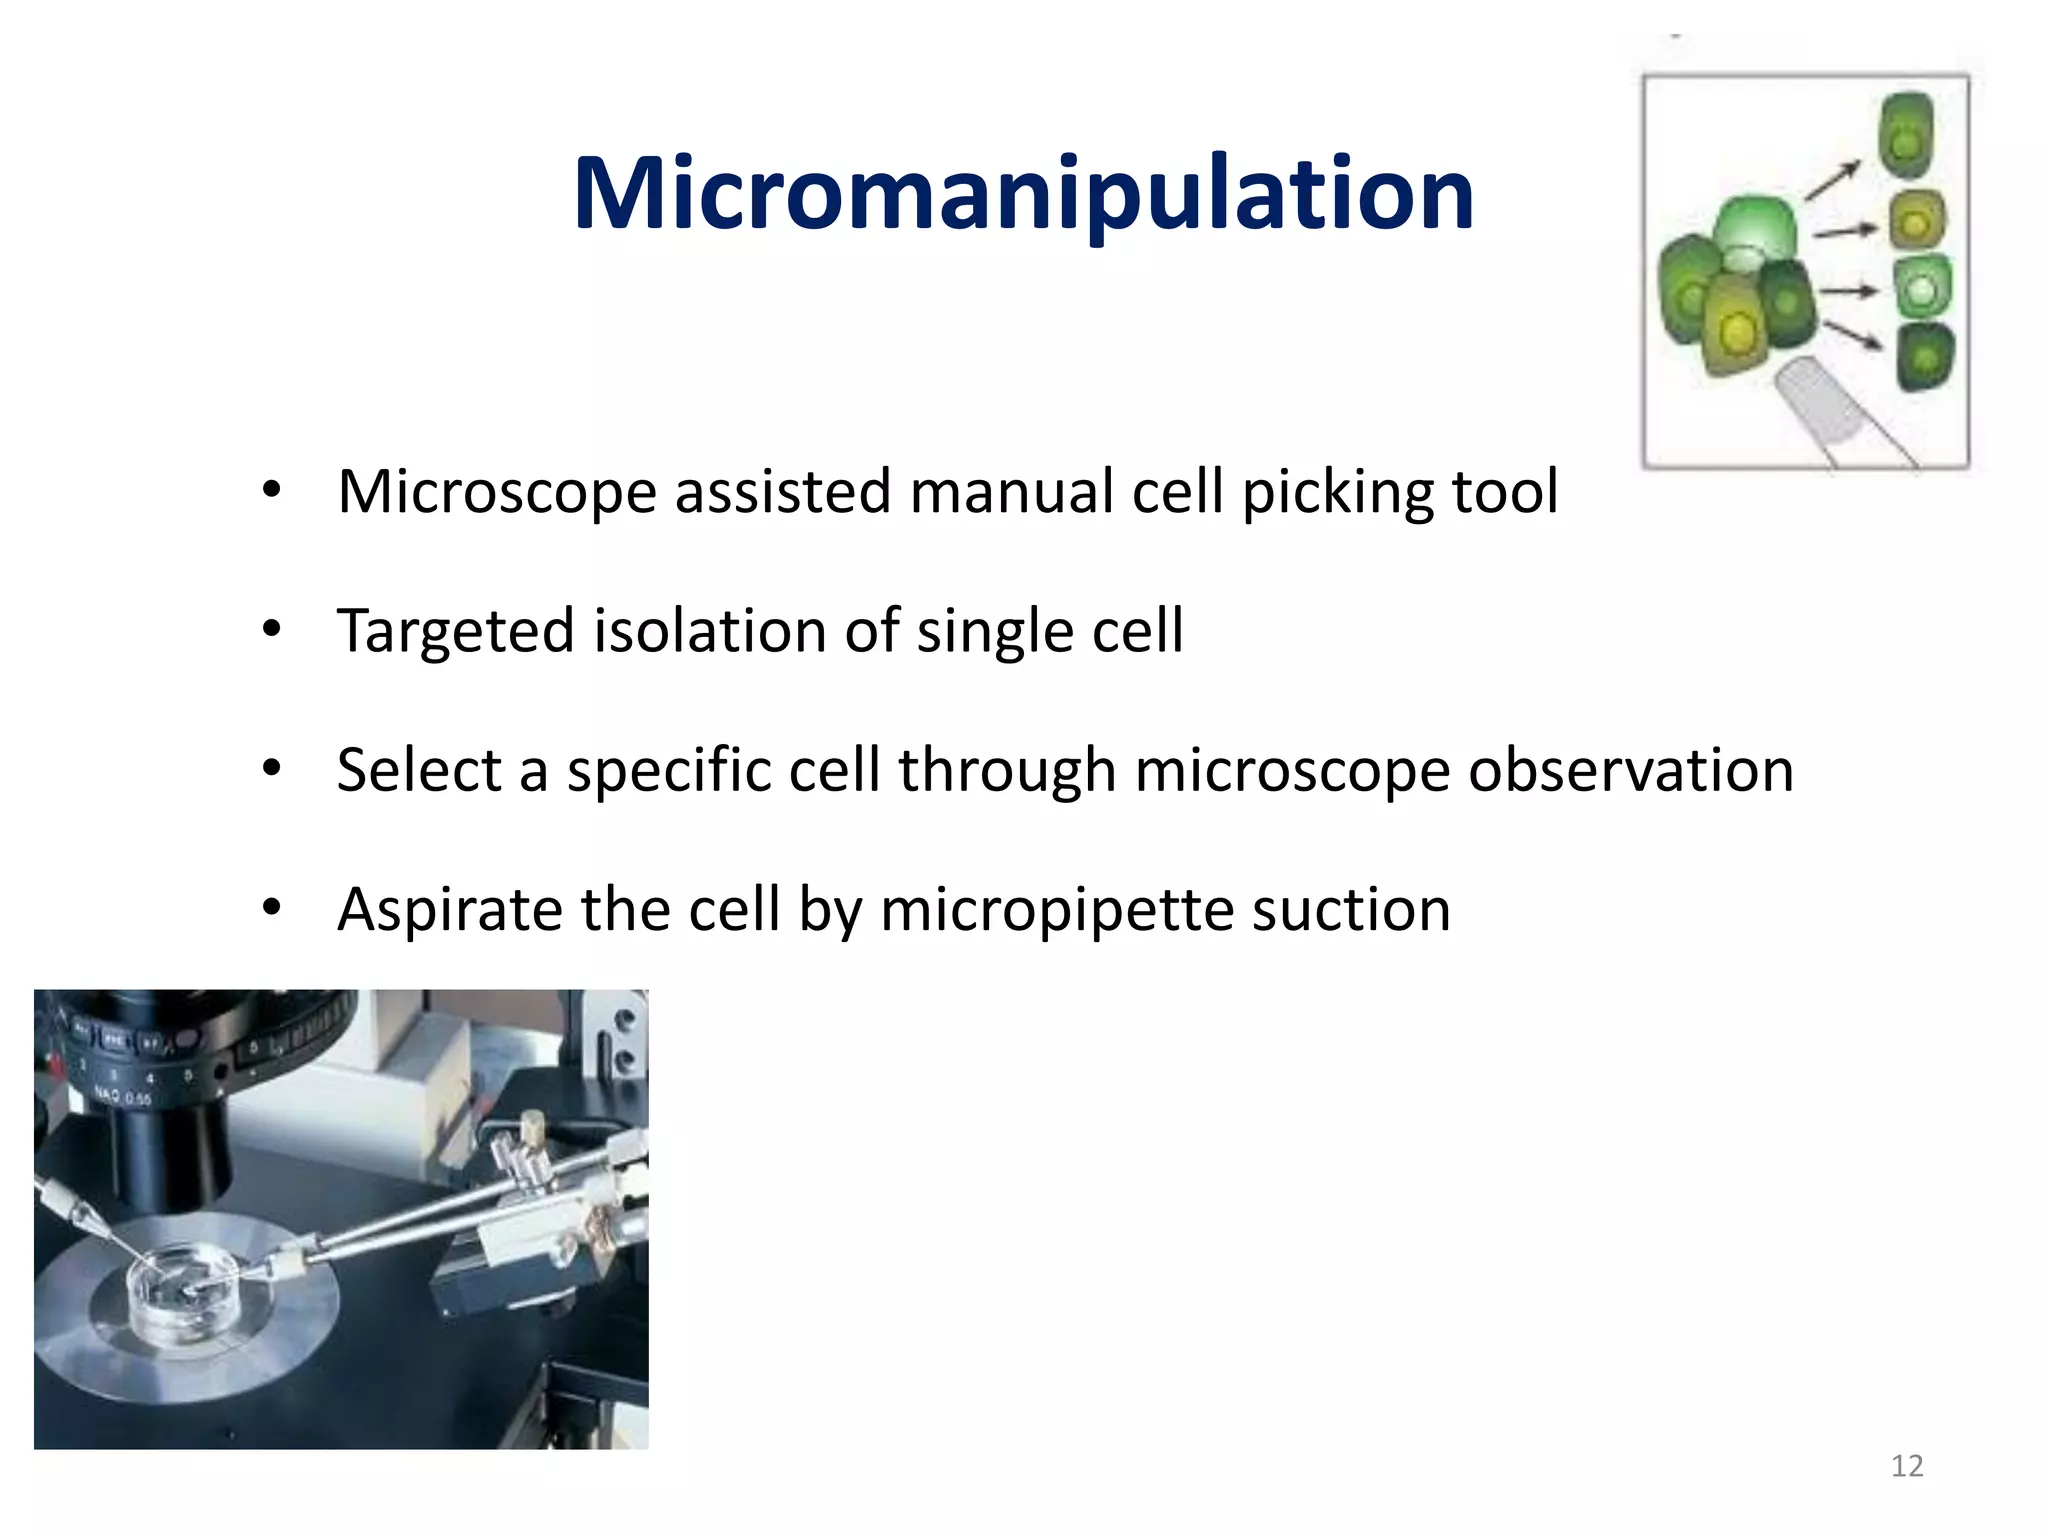
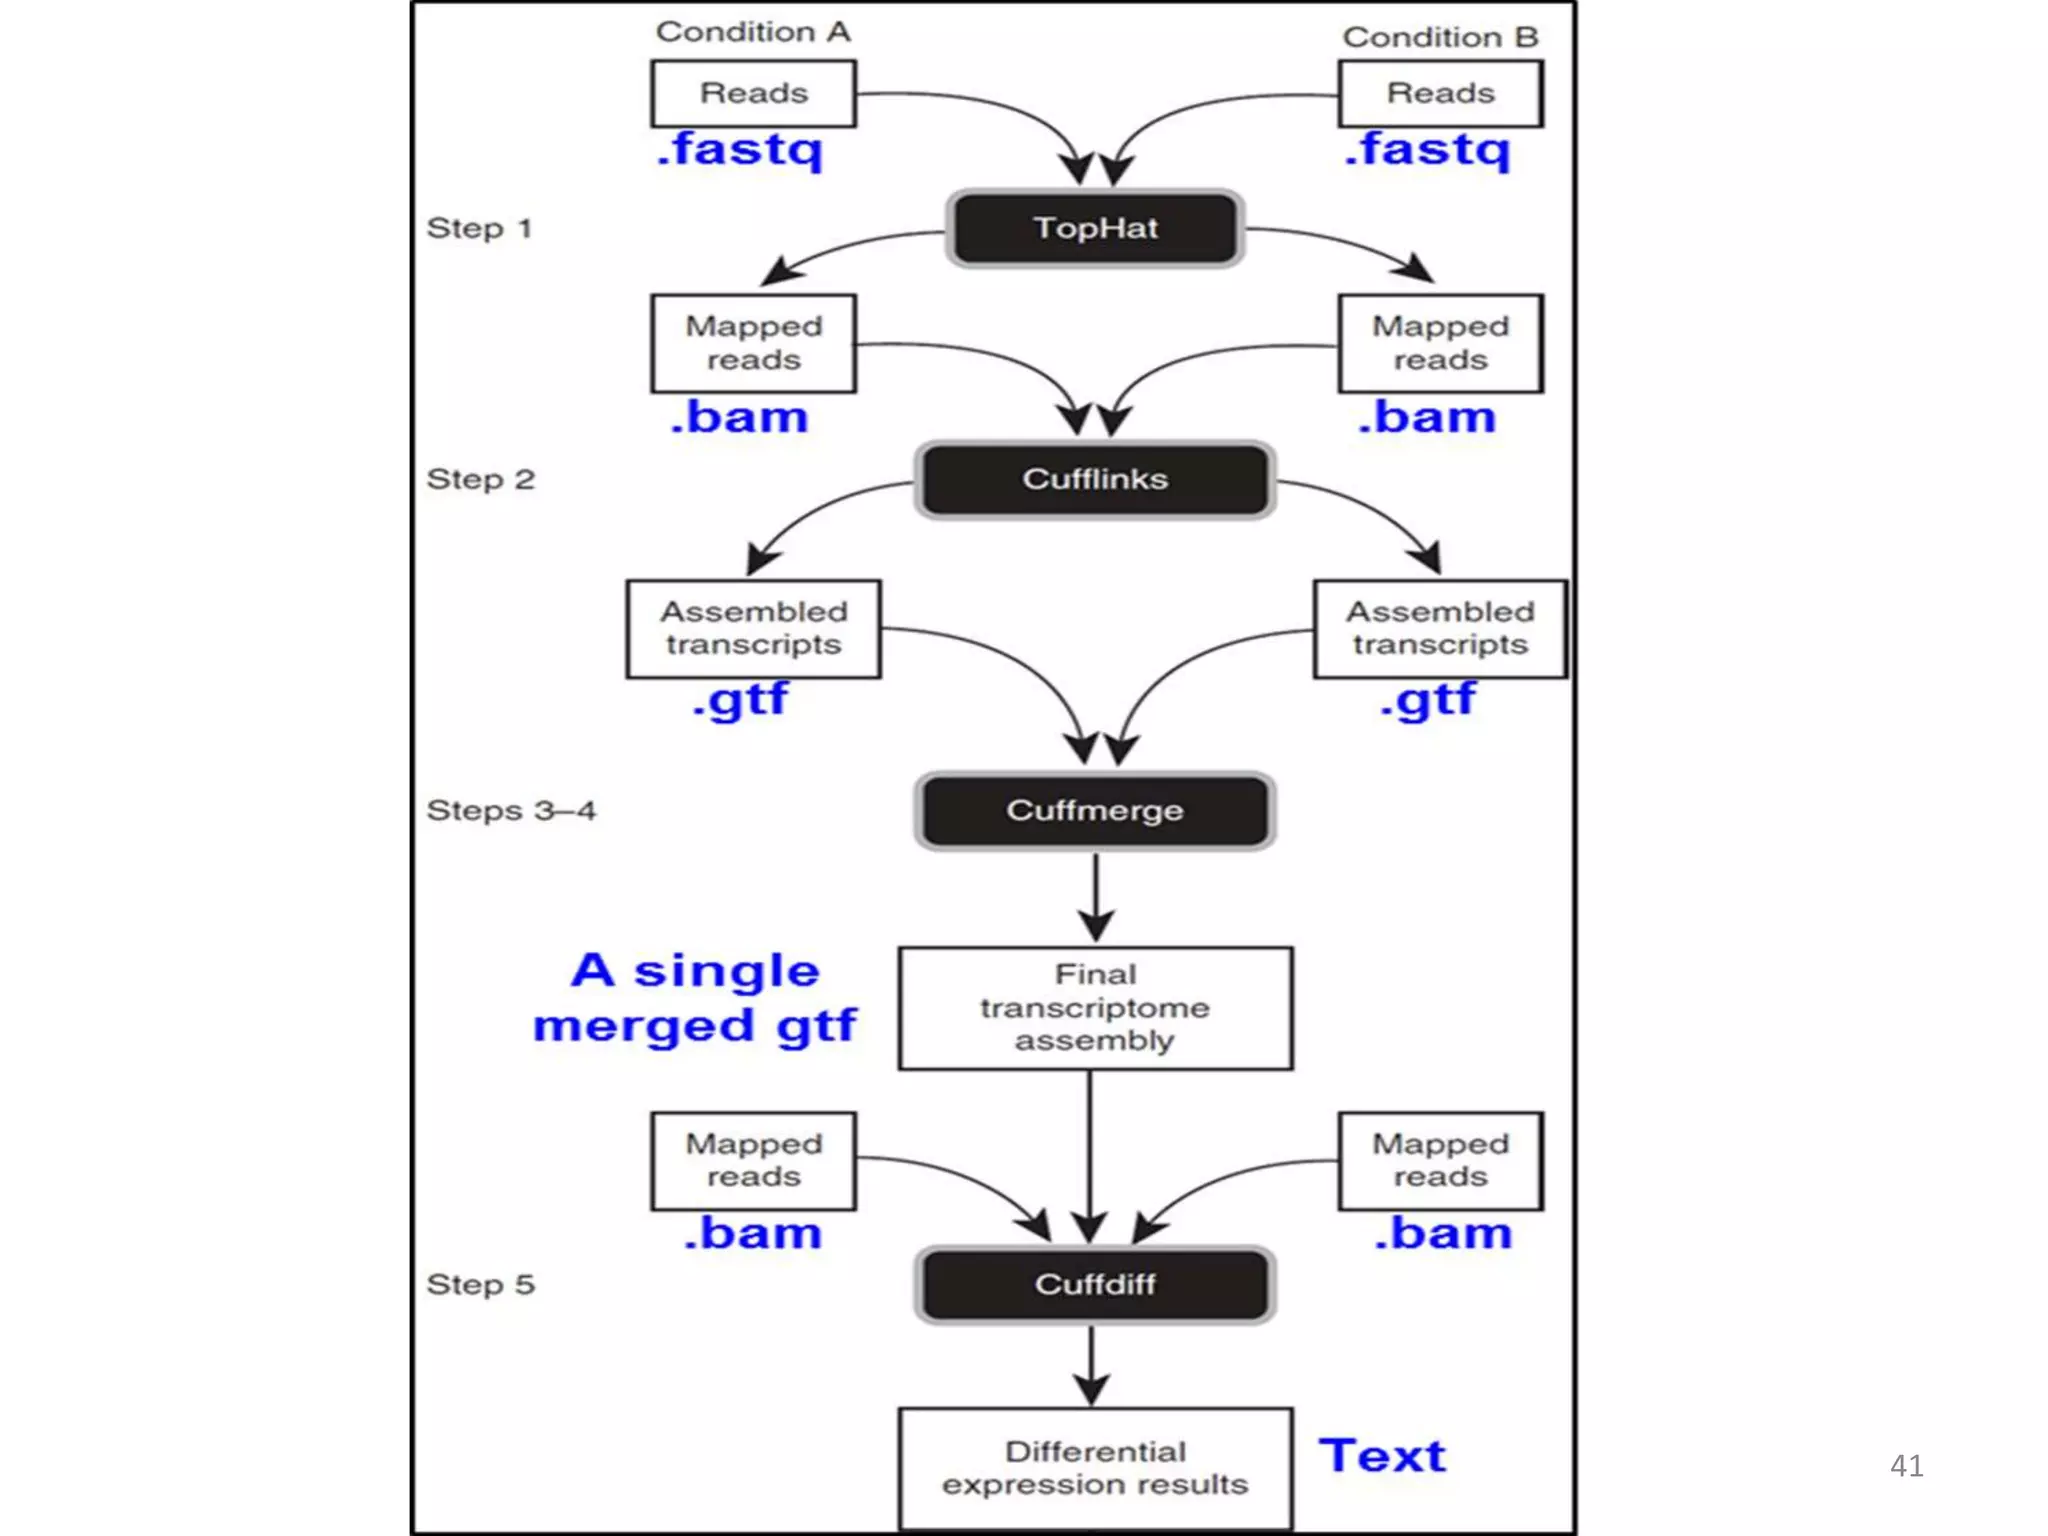
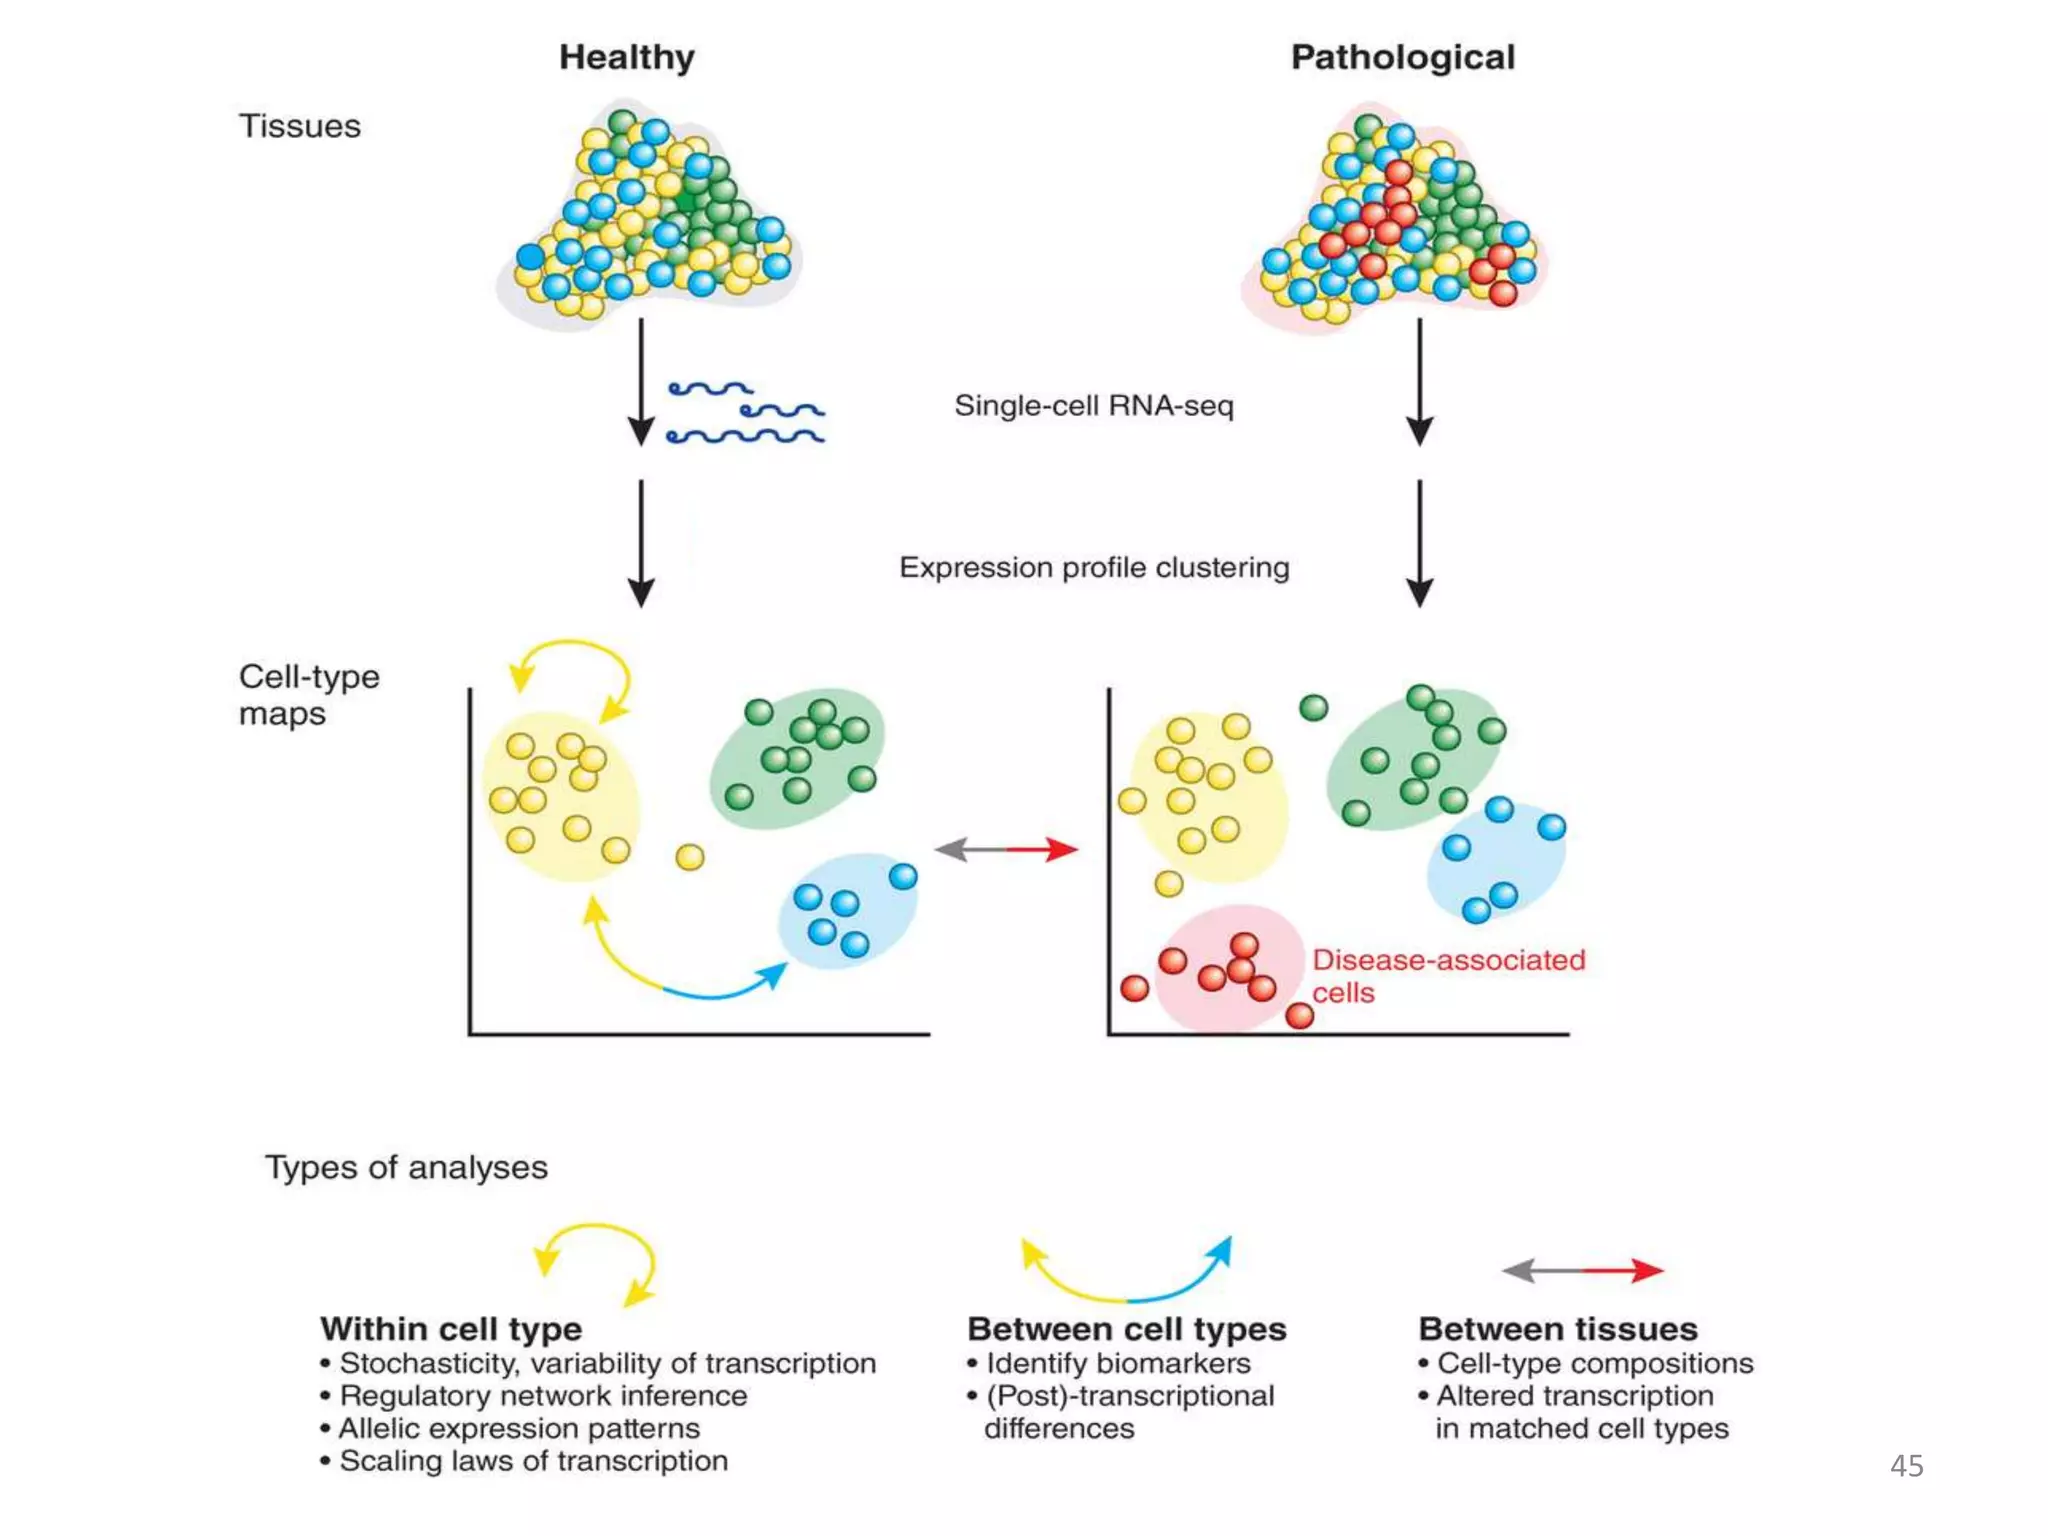
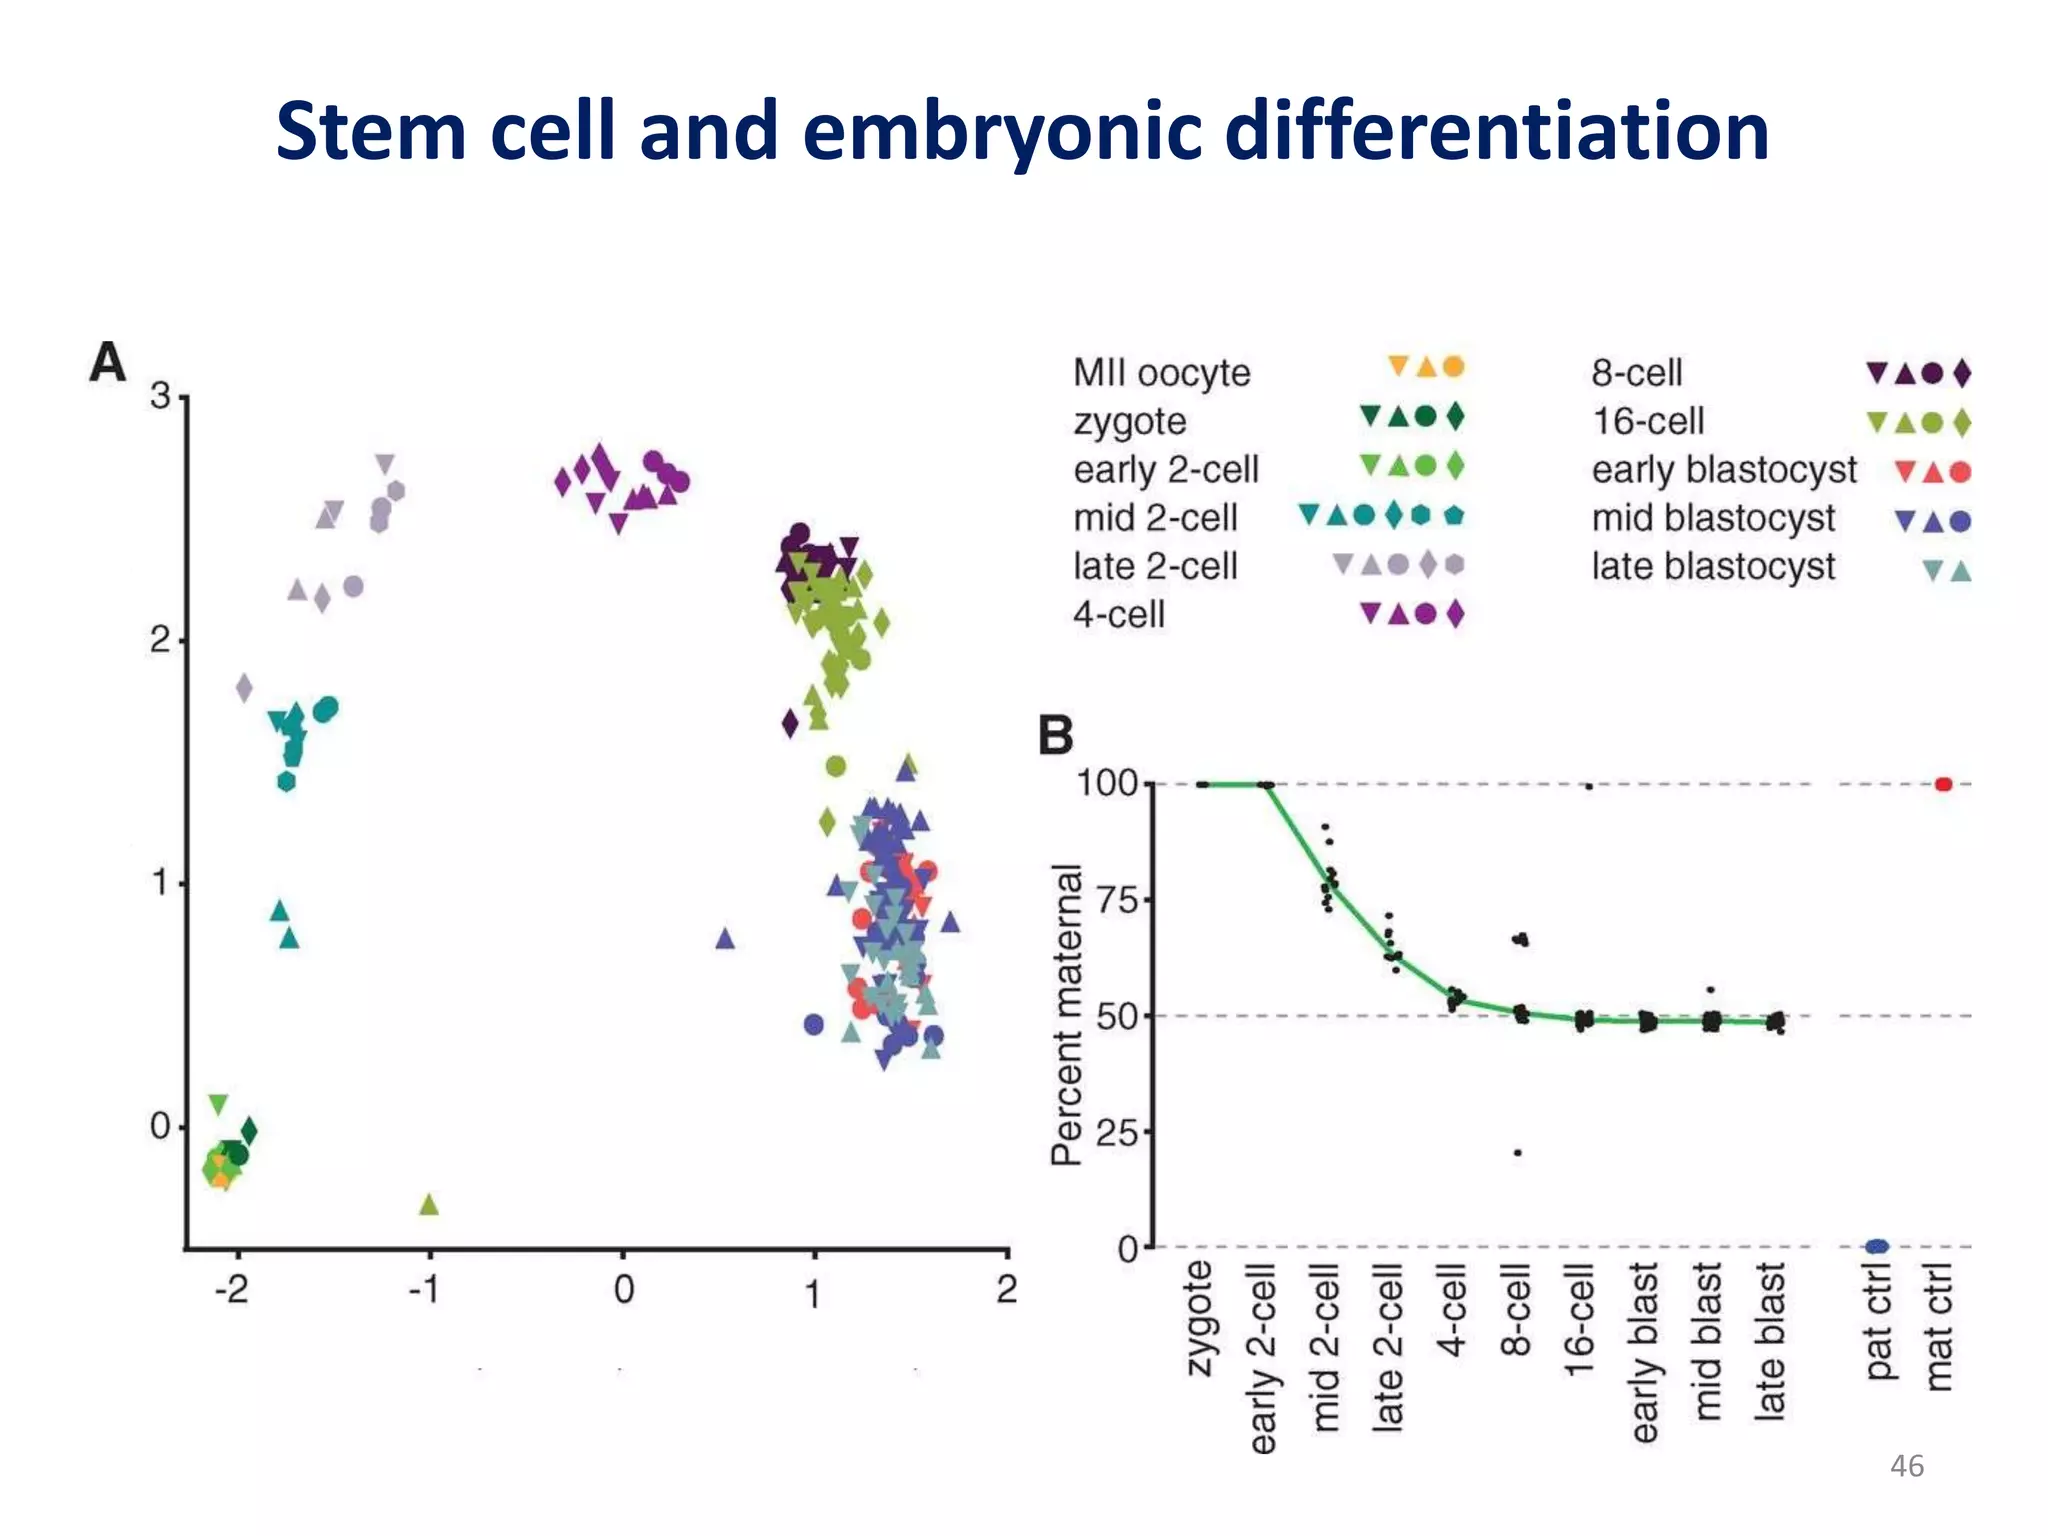
Single Cell RNA Sequencing
(Applications & Methods)
Presented by:
Bushra Arif (11)
Farah Arooj (4)
Institute of Biochemistry and Biotechnology
University of Punjab
Contents
 Introduction of scRNA sequencing
 Why we use single cell
 Methods of isolating single cell
 Methods of scRNA seq
 Data Analysis
 Applications
2
Introduction
• Genetically identical cells show variations
• Transcriptome: an essential piece of cell identity
• Reveal the state of a cell
• Mammalian cells contain 105–106 mRNA molecules
• Population studies averages the cells transcriptome
• Inappropriate for rare population studies
3
Why Single cell study?
Single-cell studies reveal
• Relationship between intrinsic cellular processes
and extrinsic stimuli
• Hidden variation in gene expression
• Unknown species or regulatory processes of
biotechnological or medical relevance
4
History
• Norman N. Iscove done work on exponential amplification
of cDNAs by PCR
• James Eberwine done linear amplification of cDNA by T-
RNA polymerase-based in vitro transcription
5
Method of the year; 2013
6
Single Cell RNA Sequencing Process
By Huang et al., 2014 7
Florescence-
activated cell sorting
(FACS)
33%
Micromanipulation
17%
Laser capture
microdissection
17%
Optical tweezers
6%
Single cell isolation
methods
8
Florescent Activated Cell Sorting(FACS)
• Technique for purification of cell and subcellular
populations
• High purity of the sorted population
• Sort as many as 300,000 cells per minute
• Machine can be set to ignore droplets containing dead
cells
9
10
Limitations
• Require large starting material
• Not well suited for the isolation of extremely rare
cells
• Needs antibodies to target specific proteins
11
Micromanipulation
• Microscope assisted manual cell picking tool
• Targeted isolation of single cell
• Select a specific cell through microscope observation
• Aspirate the cell by micropipette suction
12
Limitations
• Manual process confines the overall throughput
• Low microliter samples can’t be manipulated
• Not possible to visually control accurate transfer of
the single cell
13
Optical tweezers
• Optical tweezers use focused laser beam to trap,
manipulate and position micron sized objects.
Limitation:
• Optical set-up can damage
the cells
14
Laser capture microdissection (LCM)
• Advanced technique to isolate cells from solid tissue
samples
• Microscopically visualize target cell or compartment
• Mark the section to be cut on the display
• Cut the tissue and isolate cells
15
LCM
c c c
16
Methods of single cell
RNA sequencing
Basic steps
Cell lysis
Reverse transcription
Second strand synthesis
Library preparation
Sequencing
Data analysis
18
Cell lysis and mRNA isolation
• Eukaryotic cells are lysed in hypotonic buffer containing a
detergent e.g. guanidine thiocyanate and Nonidet P-40
• Using oligo-dT coated magnetic beads that will remove
proteins, metabolites, and the cell debris, from the mRNAs
• The lysate buffer then washed away isolating mRNAs with
poly(A) tails
19
Reverse transcription
• Total RNA is isolated which contain all types of RNA.
• To Capture only the mRNA, specific oligo dT primers are used
• Reverse transcriptase of MMLV having the low RNase H
activity, increased thermo stability and produces RNA-DNA
hybrid molecules with an average length of 1.5–2 kb.
• Superscript III
20
2nd strand Synthesis and Amplification
PCR based amplification
(Homopolymer tailing
OR Template switching)
In vitro transcription
Rolling circle
amplification
21
Methods
Tang et al. STRT
SMART-
Seq
CEL-Seq
22
Tang et al.
• Published in 2009
• Total RNA is isolated and fragmented.
• Converted to cDNA by using an oligodT primer with a specific anchor
sequence.
• The second strand is synthesized using a poly T primer with another
anchor sequence.
• PCR amplified from primers against the two anchor sequences.
23
24
Drawback
• Premature termination of RT reduces transcript coverage
at the 5’ end
• Introduction of a polyA tail in addition to its own poly A
sequence at the 3’ end of the input RNA causes a loss of
strand information in the resulting double-stranded
cDNA.
Single cell tagged reverse transcription (STRT)
• Based on template switching
• Done to pool different cell RNAs
• 5’ end of cDNA are tagged with unique barcodes
• Barcode is 4-5 bp random sequence or restriction site
• Biotin is introduced at both the 3’ and 5’ ends via the use of
biotinylated primers.
26
• Binding to streptavidin beads,
enzymatic cleavage leads to
the selection of only the 5’
fragments for library
construction.
• Subsequent sequencing and
analysis shows 5’ read bias
27
Drawback of template switching is:
• Lower sensitivity compared to homopolymer tailing which
may due to an imperfect efficiency of RT M-MuLV to add
3’cytosines
28
Cell expression by linear amplification and
sequencing (CEL-seq.)
• Highly multiplexed
• Based on in vitro transcription of mRNA to amplify only the 3’ end RNA
only
• OligodT primer containing the 5’ Illumina adaptor, a cell barcode, and a
T7promoter.
• cDNA samples are amplified by IVT from the T7 promoter
• RNA fragmentation & Illumina adaptor is ligated at 3’ end
• RNA is reverse transcribed, library is prepared then sequencing
• The first read recovers the barcode, whereas the second identifies the
mRNA transcript. 29
30
SMART-Seq
• Switch mechanism at 5’ end of RNA template
• Based on template switching mechanism
• Generate full transcript coverage.
• Anchor a 5’ universal seq. and 3’ Cs along with Locked nucleic
acid by RT
• cDNA is amplified and tagmentation is used to construct
libraries
31
32
Data Analysis
33
Quality check
• Software is fastaqc which checks for
 Presence and abundance of contaminating sequences.
 Average read length
 GC content
• Bad quality reads (score <20) are trimmed using
trimmomatric.
34
Good quality Poor quality
Data alignment
• Bowtie or TopHat
• Align large sets of short DNA sequence reads to large
genomes
• Softwares are splice aware and considers the genomic intron-
exon structure by splitting unmapped reads and aligning the
read fragments independently
35
Data Assembly
• Can be done by
 Reference based assembly (Cufflinks)
 De novo assembly (Without any ref. using Trinity
• Generates a large number of reads that are mapped to contigs
which are then clustered to genes using Corset.
• Cuffmerge is used for final assembly
36
De novo assembly
• Assemble the reads into unique transcript sequences
• Clusters related contigs that into coresponding portions of alternatively
spliced transcripts
• Constructs a de Bruijn graph for each cluster of related contigs showing the
overlapping between variants.
• Finally it reconstructs full-length, linear transcripts by integrating the
individual de Bruijn graphs with the original reads and paired ends.
37
38
Differential gene expression
• Statitsical difference between the set of genes of two populations or
conditions.
• Cuffdiff2 count the number of sequence reads in a window as
FPKM (fragments per kilobase of transcript per million mapped read)
• Moving window along the seq. generates an expression profile in
the form of scores.
• Score normalization help in determining DGE
• Long and highly expressed genes have more reads
39
When samples of yeast species were grown into two different medias. Some genes
are over expressed in one of sample.
40
41
Applications of single cell
RNA sequencing
42
Allele specific expression
• Different expression patterns of
cells
• Some genes are expressed high
in some while low in other.
43
• Determine the different cell stages, lineages and their
signaling pathways.
Study disease
• Non-invasive way to monitor the progress of
human disease
• Monitor rare or precious biological sample
• Knockout or knockdown gene studies
44
45
Stem cell and embryonic differentiation
46
• SNP discovery(only in exonic region)
• Genomic medicine
• Epigenetics & Cell lineage hierarchy
• Combined approaches
47
Thank you
48

Single cell RNA sequencing; Methods and applications

  • 1.
    Single Cell RNASequencing (Applications & Methods) Presented by: Bushra Arif (11) Farah Arooj (4) Institute of Biochemistry and Biotechnology University of Punjab
  • 2.
    Contents  Introduction ofscRNA sequencing  Why we use single cell  Methods of isolating single cell  Methods of scRNA seq  Data Analysis  Applications 2
  • 3.
    Introduction • Genetically identicalcells show variations • Transcriptome: an essential piece of cell identity • Reveal the state of a cell • Mammalian cells contain 105–106 mRNA molecules • Population studies averages the cells transcriptome • Inappropriate for rare population studies 3
  • 4.
    Why Single cellstudy? Single-cell studies reveal • Relationship between intrinsic cellular processes and extrinsic stimuli • Hidden variation in gene expression • Unknown species or regulatory processes of biotechnological or medical relevance 4
  • 5.
    History • Norman N.Iscove done work on exponential amplification of cDNAs by PCR • James Eberwine done linear amplification of cDNA by T- RNA polymerase-based in vitro transcription 5
  • 6.
    Method of theyear; 2013 6
  • 7.
    Single Cell RNASequencing Process By Huang et al., 2014 7
  • 8.
    Florescence- activated cell sorting (FACS) 33% Micromanipulation 17% Lasercapture microdissection 17% Optical tweezers 6% Single cell isolation methods 8
  • 9.
    Florescent Activated CellSorting(FACS) • Technique for purification of cell and subcellular populations • High purity of the sorted population • Sort as many as 300,000 cells per minute • Machine can be set to ignore droplets containing dead cells 9
  • 10.
  • 11.
    Limitations • Require largestarting material • Not well suited for the isolation of extremely rare cells • Needs antibodies to target specific proteins 11
  • 12.
    Micromanipulation • Microscope assistedmanual cell picking tool • Targeted isolation of single cell • Select a specific cell through microscope observation • Aspirate the cell by micropipette suction 12
  • 13.
    Limitations • Manual processconfines the overall throughput • Low microliter samples can’t be manipulated • Not possible to visually control accurate transfer of the single cell 13
  • 14.
    Optical tweezers • Opticaltweezers use focused laser beam to trap, manipulate and position micron sized objects. Limitation: • Optical set-up can damage the cells 14
  • 15.
    Laser capture microdissection(LCM) • Advanced technique to isolate cells from solid tissue samples • Microscopically visualize target cell or compartment • Mark the section to be cut on the display • Cut the tissue and isolate cells 15
  • 16.
  • 17.
    Methods of singlecell RNA sequencing
  • 18.
    Basic steps Cell lysis Reversetranscription Second strand synthesis Library preparation Sequencing Data analysis 18
  • 19.
    Cell lysis andmRNA isolation • Eukaryotic cells are lysed in hypotonic buffer containing a detergent e.g. guanidine thiocyanate and Nonidet P-40 • Using oligo-dT coated magnetic beads that will remove proteins, metabolites, and the cell debris, from the mRNAs • The lysate buffer then washed away isolating mRNAs with poly(A) tails 19
  • 20.
    Reverse transcription • TotalRNA is isolated which contain all types of RNA. • To Capture only the mRNA, specific oligo dT primers are used • Reverse transcriptase of MMLV having the low RNase H activity, increased thermo stability and produces RNA-DNA hybrid molecules with an average length of 1.5–2 kb. • Superscript III 20
  • 21.
    2nd strand Synthesisand Amplification PCR based amplification (Homopolymer tailing OR Template switching) In vitro transcription Rolling circle amplification 21
  • 22.
    Methods Tang et al.STRT SMART- Seq CEL-Seq 22
  • 23.
    Tang et al. •Published in 2009 • Total RNA is isolated and fragmented. • Converted to cDNA by using an oligodT primer with a specific anchor sequence. • The second strand is synthesized using a poly T primer with another anchor sequence. • PCR amplified from primers against the two anchor sequences. 23
  • 24.
  • 25.
    Drawback • Premature terminationof RT reduces transcript coverage at the 5’ end • Introduction of a polyA tail in addition to its own poly A sequence at the 3’ end of the input RNA causes a loss of strand information in the resulting double-stranded cDNA.
  • 26.
    Single cell taggedreverse transcription (STRT) • Based on template switching • Done to pool different cell RNAs • 5’ end of cDNA are tagged with unique barcodes • Barcode is 4-5 bp random sequence or restriction site • Biotin is introduced at both the 3’ and 5’ ends via the use of biotinylated primers. 26
  • 27.
    • Binding tostreptavidin beads, enzymatic cleavage leads to the selection of only the 5’ fragments for library construction. • Subsequent sequencing and analysis shows 5’ read bias 27
  • 28.
    Drawback of templateswitching is: • Lower sensitivity compared to homopolymer tailing which may due to an imperfect efficiency of RT M-MuLV to add 3’cytosines 28
  • 29.
    Cell expression bylinear amplification and sequencing (CEL-seq.) • Highly multiplexed • Based on in vitro transcription of mRNA to amplify only the 3’ end RNA only • OligodT primer containing the 5’ Illumina adaptor, a cell barcode, and a T7promoter. • cDNA samples are amplified by IVT from the T7 promoter • RNA fragmentation & Illumina adaptor is ligated at 3’ end • RNA is reverse transcribed, library is prepared then sequencing • The first read recovers the barcode, whereas the second identifies the mRNA transcript. 29
  • 30.
  • 31.
    SMART-Seq • Switch mechanismat 5’ end of RNA template • Based on template switching mechanism • Generate full transcript coverage. • Anchor a 5’ universal seq. and 3’ Cs along with Locked nucleic acid by RT • cDNA is amplified and tagmentation is used to construct libraries 31
  • 32.
  • 33.
  • 34.
    Quality check • Softwareis fastaqc which checks for  Presence and abundance of contaminating sequences.  Average read length  GC content • Bad quality reads (score <20) are trimmed using trimmomatric. 34 Good quality Poor quality
  • 35.
    Data alignment • Bowtieor TopHat • Align large sets of short DNA sequence reads to large genomes • Softwares are splice aware and considers the genomic intron- exon structure by splitting unmapped reads and aligning the read fragments independently 35
  • 36.
    Data Assembly • Canbe done by  Reference based assembly (Cufflinks)  De novo assembly (Without any ref. using Trinity • Generates a large number of reads that are mapped to contigs which are then clustered to genes using Corset. • Cuffmerge is used for final assembly 36
  • 37.
    De novo assembly •Assemble the reads into unique transcript sequences • Clusters related contigs that into coresponding portions of alternatively spliced transcripts • Constructs a de Bruijn graph for each cluster of related contigs showing the overlapping between variants. • Finally it reconstructs full-length, linear transcripts by integrating the individual de Bruijn graphs with the original reads and paired ends. 37
  • 38.
  • 39.
    Differential gene expression •Statitsical difference between the set of genes of two populations or conditions. • Cuffdiff2 count the number of sequence reads in a window as FPKM (fragments per kilobase of transcript per million mapped read) • Moving window along the seq. generates an expression profile in the form of scores. • Score normalization help in determining DGE • Long and highly expressed genes have more reads 39
  • 40.
    When samples ofyeast species were grown into two different medias. Some genes are over expressed in one of sample. 40
  • 41.
  • 42.
    Applications of singlecell RNA sequencing 42
  • 43.
    Allele specific expression •Different expression patterns of cells • Some genes are expressed high in some while low in other. 43 • Determine the different cell stages, lineages and their signaling pathways.
  • 44.
    Study disease • Non-invasiveway to monitor the progress of human disease • Monitor rare or precious biological sample • Knockout or knockdown gene studies 44
  • 45.
  • 46.
    Stem cell andembryonic differentiation 46
  • 47.
    • SNP discovery(onlyin exonic region) • Genomic medicine • Epigenetics & Cell lineage hierarchy • Combined approaches 47
  • 48.

Editor's Notes

  • #4 (1-5% of 1-50 pg total RNA, or 0.01-2.5 pg mRNA, per cell) 
  • #5 Sequencing of both genomic DNA and mRNA from the same cell allows direct comparison of genomic variation and transcriptome heterogeneity. we characterize several mRNAs from a single cell, some of which were previously undescribed, perhaps due to "rarity" when averaged over many cell types. Electrophysiological analysis coupled with molecular biology
  • #6 is estimated at 0.02% in these cells, shows that the technique is sensitive enough to detect moderate-to-low abundance messages even in single cells, again without any requirement for sequence-specific primers. i
  • #7 Supplant
  • #44 based on their functions and conditions due to allelic specific transcription
  • #45  of a gene scRNA seq reveal how it regulates the gene expression network in target cells.
  • #47  Panel A shows that single-cell transcriptomes cluster along developmental stages. Each shape is a particular embryo, and each color is a developmental stage. The single-cell RNA-seq data were analyzed by principal component analysis, which defines axes (principal components) that in descending order explain the maximum amount of variance in transcript levels as possible. Clusters generally contain cells from several embryos at the same stage, because regulated patterns of gene expression are fundamental to development. Panel B shows that by the 4-cell stage, maternal and paternal alleles are approximately equally represented in the transcriptome. In the zygote, all RNAs originate from maternal alleles. We can infer that the paternal pronucleus has not yet fused and become transcriptionally active. The figure also includes control cells from only the parental strains, without performing a cross between the two. They found that their SNP analysis correctly assigns >99% of transcripts to the correct parent strain of origin when testing the two controls. It was important that they demonstrate the accuracy of their SNP method before applying it to determine unknown patterns of gene expression.