Download to read offline

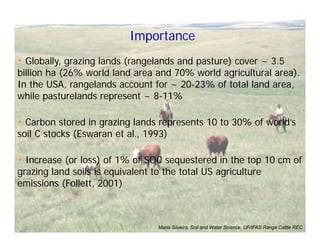
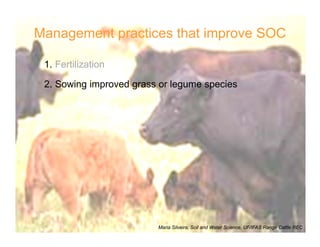
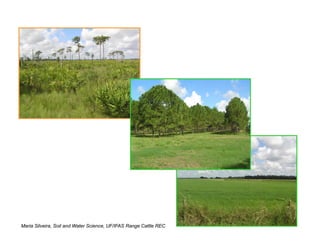

Globally, grazing lands cover over 3.5 billion hectares and represent a significant carbon sink. Grazing lands store 10-30% of the world's soil carbon. Increases or losses of just 1% of soil organic carbon in grazing land soils can be equivalent to total US agriculture emissions. Management practices like fertilization and sowing improved grasses can increase soil carbon levels. However, the impacts of grazing management on soil carbon are variable, with some studies finding increases under light grazing while others find decreases under heavy grazing. The direction and magnitude of soil carbon responses depend on the specific management practices, duration, intensity, and initial soil carbon levels.


