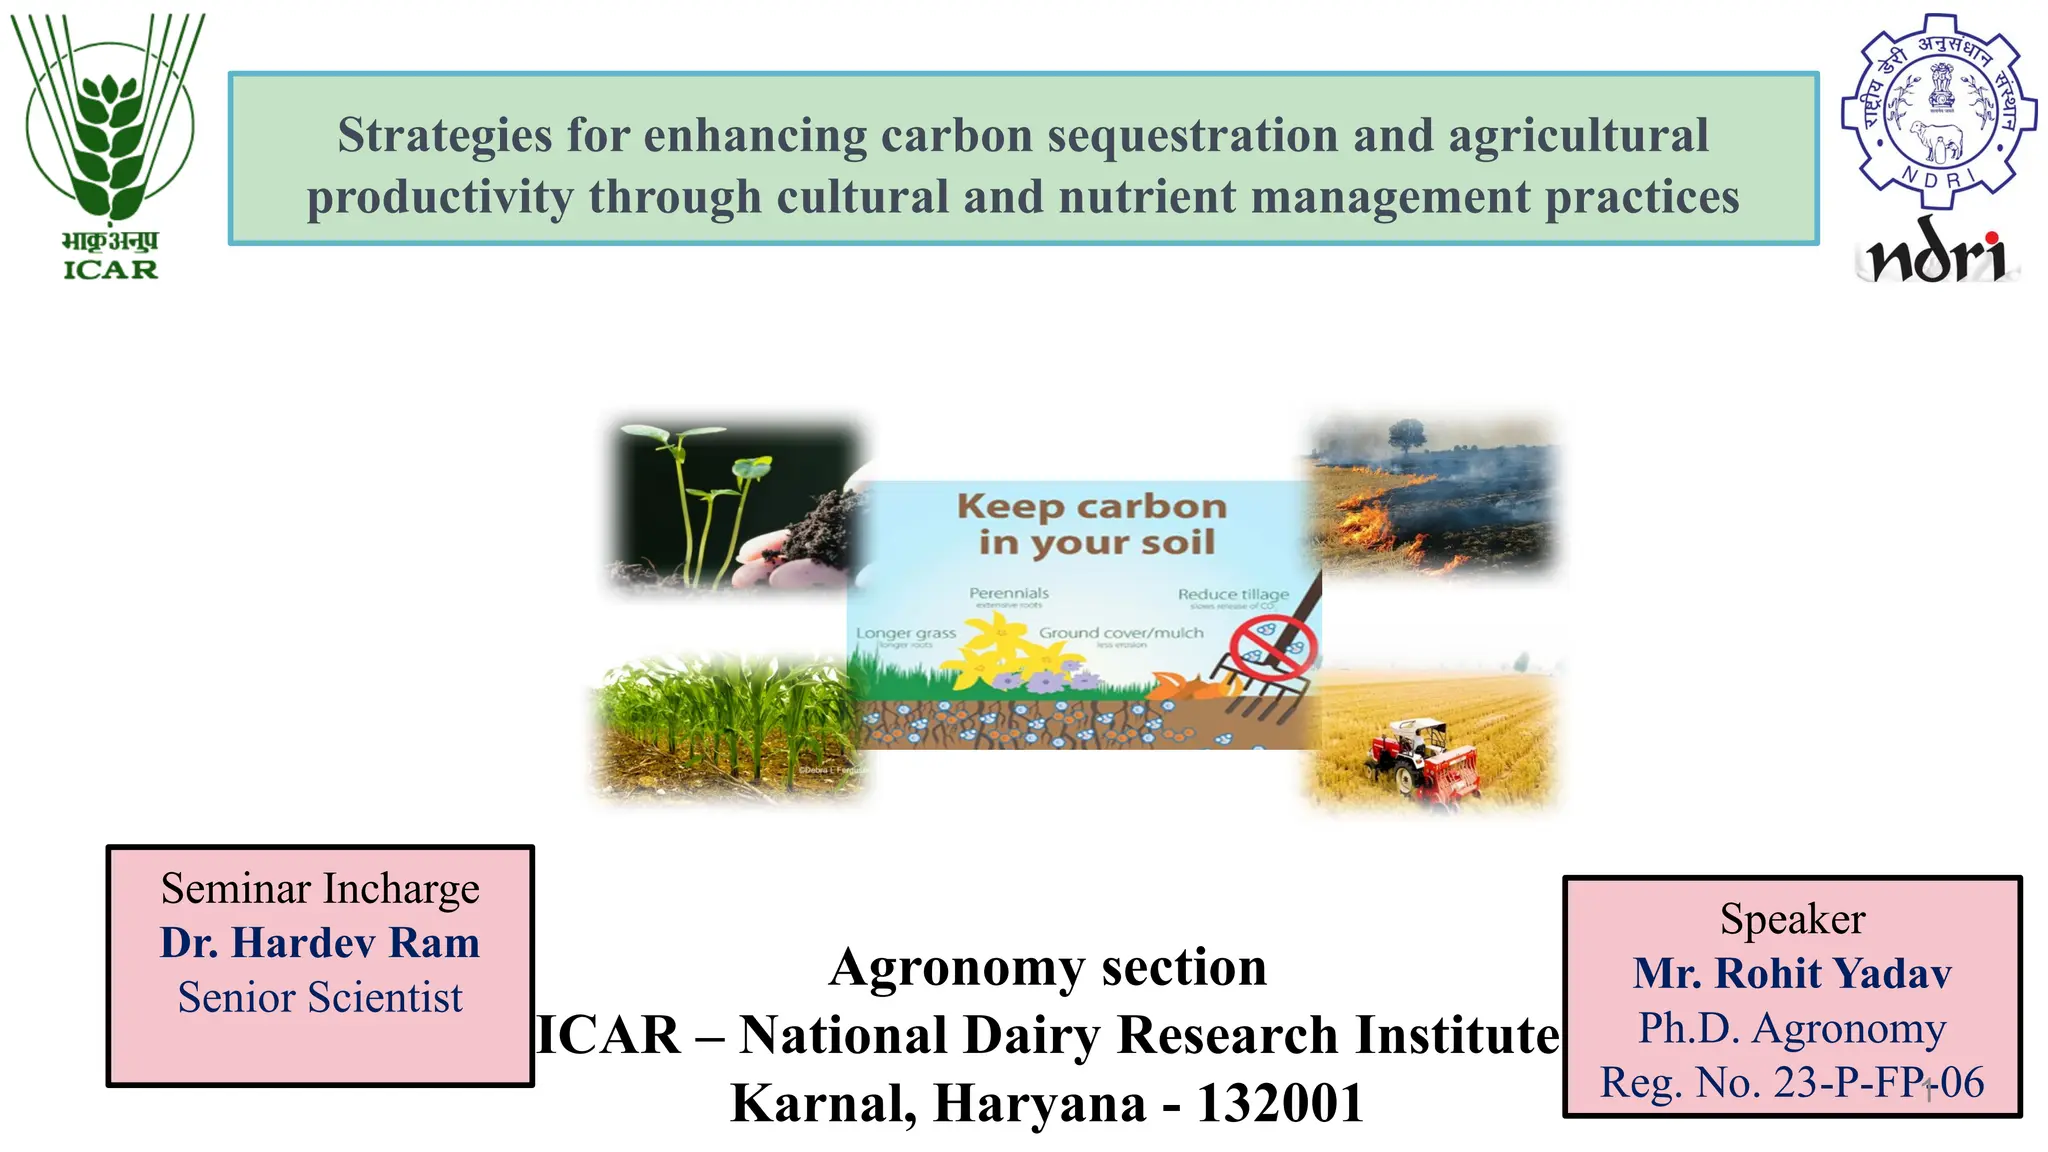
Strategies for enhancingcarbon sequestration and agricultural
productivity through cultural and nutrient management practices
Speaker
Mr. Rohit Yadav
Ph.D. Agronomy
Reg. No. 23-P-FP-06
Seminar Incharge
Dr. Hardev Ram
Senior Scientist
Agronomy section
ICAR – National Dairy Research Institute
Karnal, Haryana - 132001 1
2.
OUTLINES
Φ Introduction
Φ Carbonsequestration
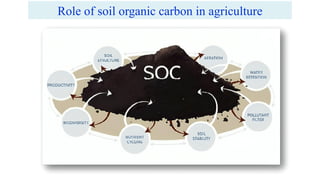
Φ Role of soil organic carbon in Agriculture
Φ Agro-techniques for improving SOC sequestration
Φ Case studies
Φ Conclusion
3.
3
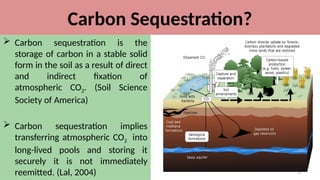
Carbon Sequestration?
Carbonsequestration is the
storage of carbon in a stable solid
form in the soil as a result of direct
and indirect fixation of
atmospheric CO2. (Soil Science
Society of America)
Carbon sequestration implies
transferring atmospheric CO2 into
long-lived pools and storing it
securely it is not immediately
reemitted. (Lal, 2004)
4.
4
CO2 isone of the main greenhouse gas that is causing global warming
About 30% of the total GHGs emission alone contributed by intensive agriculture
practices it self (IPCC, 2013)
Annual losses of 0.3–1.0 billions tons carbon through erosion of agricultural land
(Chappell et al., 2015)
1.4 billions metric tons C could be stored annually in agricultural soils, i.e.
equivalent to an annual storage rate of 0.4 % in top soil [IPCC, 2014]
80 % of this potential could be reached with an expenditure of 100 USD per ton of
CO2 (Smith et al., 2014)
SOIL CAROBON SEQUESTRATION: A MAJOR OPTION FOR TACKLING
CLIMATE CHANGE
5.
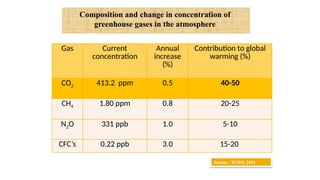
Gas Current
concentration
Annual
increase
(%)
Contribution toglobal
warming (%)
CO2 413.2 ppm 0.5 40-50
CH4 1.80 ppm 0.8 20-25
N2O 331 ppb 1.0 5-10
CFC’s 0.22 ppb 3.0 15-20
5
Source : WMO, 2021
Composition and change in concentration of
greenhouse gases in the atmosphere
6.
S
h
a
r
e
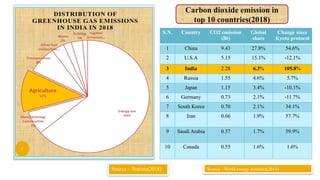
S.N. Country CO2emission
(Bt)
Global
share
Change since
Kyoto protocol
1 China 9.43 27.8% 54.6%
2 U.S.A 5.15 15.1% -12.1%
3 India 2.28 6.3% 105.8%
4 Russia 1.55 4.6% 5.7%
5 Japan 1.15 3.4% -10.1%
6 Germany 0.73 2.1% -11.7%
7 South Korea 0.70 2.1% 34.1%
8 Iran 0.66 1.9% 57.7%
9 Saudi Arabia 0.57 1.7% 59.9%
10 Canada 0.55 1.6% 1.6%
Carbon dioxide emission in
top 10 countries(2018)
Source – Statista(2018) Source - World energy statistics(2019)
7.
7
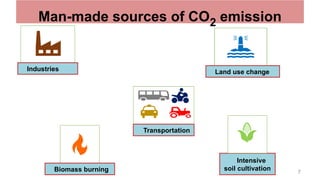
Man-made sources ofCO2 emission
Industries Land use change
Intensive
soil cultivation
Transportation
Biomass burning
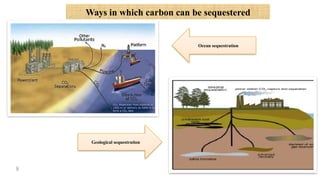
Ways in whichcarbon can be sequestered
9
Ocean sequestration
Geological sequestration
10.
10
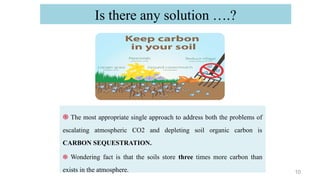
Is there anysolution ….?
֍ The most appropriate single approach to address both the problems of
escalating atmospheric CO2 and depleting soil organic carbon is
CARBON SEQUESTRATION.
֍ Wondering fact is that the soils store three times more carbon than
exists in the atmosphere.
11.
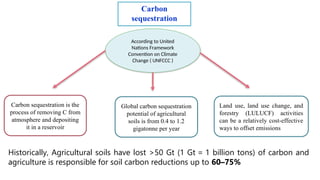
Historically, Agricultural soilshave lost >50 Gt (1 Gt = 1 billion tons) of carbon and
agriculture is responsible for soil carbon reductions up to 60–75%
According to United
Nations Framework
Convention on Climate
Change ( UNFCCC )
Carbon sequestration is the
process of removing C from
atmosphere and depositing
it in a reservoir
Global carbon sequestration
potential of agricultural
soils is from 0.4 to 1.2
gigatonne per year
Land use, land use change, and
forestry (LULUCF) activities
can be a relatively cost-effective
ways to offset emissions
Carbon
sequestration
12.
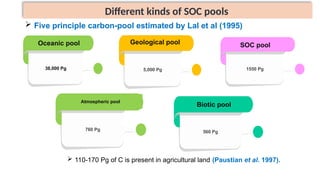
Different kinds ofSOC pools
38,000 Pg
Oceanic pool
5,000 Pg
Geological pool
1550 Pg
SOC pool
560 Pg
Biotic pool
Five principle carbon-pool estimated by Lal et al (1995)
110-170 Pg of C is present in agricultural land (Paustian et al. 1997).
760 Pg
Atmospheric pool
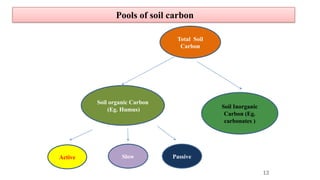
13.
Total Soil
Carbon
Soil organicCarbon
(Eg. Humus) Soil Inorganic
Carbon (Eg.
carbonates )
Active Slow Passive
Pools of soil carbon
13
14.
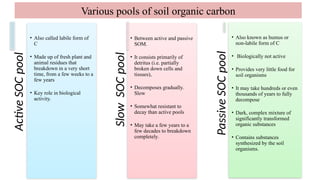
Active
SOC
pool
• Also calledlabile form of
C
• Made up of fresh plant and
animal residues that
breakdown in a very short
time, from a few weeks to a
few years
• Key role in biological
activity.
Slow
SOC
pool
• Between active and passive
SOM.
• It consists primarily of
detritus (i.e. partially
broken down cells and
tissues),
• Decomposes gradually.
Slow
• Somewhat resistant to
decay than active pools
• May take a few years to a
few decades to breakdown
completely.
Passive
SOC
pool
• Also known as humus or
non-labile form of C
• Biologically not active
• Provides very little food for
soil organisms
• It may take hundreds or even
thousands of years to fully
decompose
• Dark, complex mixture of
significantly transformed
organic substances
• Contains substances
synthesized by the soil
organisms.
Various pools of soil organic carbon
17
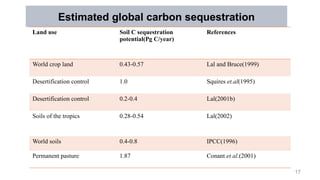
Estimated global carbonsequestration
Land use Soil C sequestration
potential(Pg C/year)
References
World crop land 0.43-0.57 Lal and Bruce(1999)
Desertification control 1.0 Squires et.al(1995)
Desertification control 0.2-0.4 Lal(2001b)
Soils of the tropics 0.28-0.54 Lal(2002)
World soils 0.4-0.8 IPCC(1996)
Permanent pasture 1.87 Conant et al.(2001)
18.
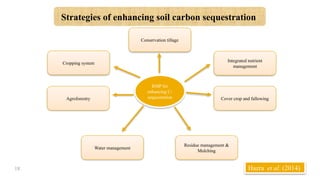
Strategies of enhancingsoil carbon sequestration
18 Hazra et al. (2014)
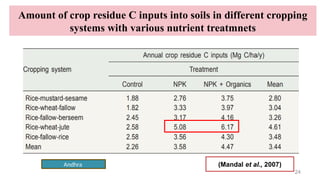
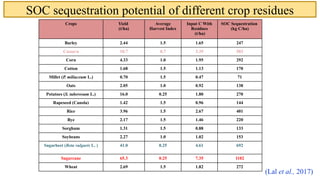
Cropping system
Agroforestry
Water management
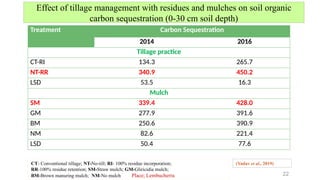
Residue management &
Mulching
Cover crop and fallowing
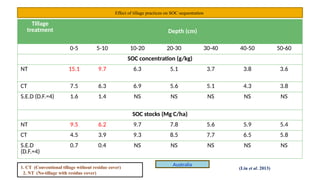
Conservation tillage
Integrated nutrient
management
RMP for
enhancing C-
sequestration
26
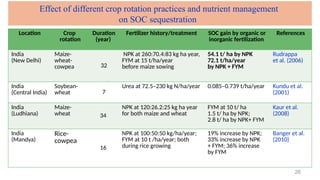
Location Crop
rotation
Duration
(year)
Fertilizer history/treatmentSOC gain by organic or
inorganic fertilization
References
India
(New Delhi)
Maize-
wheat-
cowpea 32
NPK at 260:70.4:83 kg ha year,
FYM at 15 t/ha/year
before maize sowing
54.1 t/ ha by NPK
72.1 t/ha/year
by NPK + FYM
Rudrappa
et al. (2006)
India
(Central India)
Soybean-
wheat 7
Urea at 72.5–230 kg N/ha/year 0.085–0.739 t/ha/year Kundu et al.
(2001)
India
(Ludhiana)
Maize-
wheat 34
NPK at 120:26.2:25 kg ha year
for both maize and wheat
FYM at 10 t/ ha
1.5 t/ ha by NPK;
2.8 t/ ha by NPK+ FYM
Kaur et al.
(2008)
India
(Mandya)
Rice-
cowpea
16
NPK at 100:50:50 kg/ha/year;
FYM at 10 t /ha/year; both
during rice growing
19% increase by NPK;
33% increase by NPK
+ FYM; 36% increase
by FYM
Banger et al.
(2010)
Effect of different crop rotation practices and nutrient management
on SOC sequestration
27.
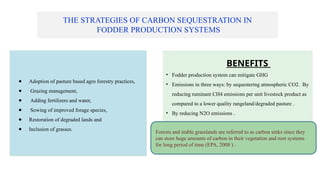
THE STRATEGIES OFCARBON SEQUESTRATION IN
FODDER PRODUCTION SYSTEMS
● Adoption of pasture based agro forestry practices,
● Grazing management,
● Adding fertilizers and water,
● Sowing of improved forage species,
● Restoration of degraded lands and
● Inclusion of grasses.
BENEFITS
• Fodder production system can mitigate GHG
• Emissions in three ways: by sequestering atmospheric CO2. By
reducing ruminant CH4 emissions per unit livestock product as
compared to a lower quality rangeland/degraded pasture .
• By reducing N2O emissions .
Forests and stable grasslands are referred to as carbon sinks since they
can store huge amounts of carbon in their vegetation and root systems
for long period of time (EPA, 2008 ) .
29
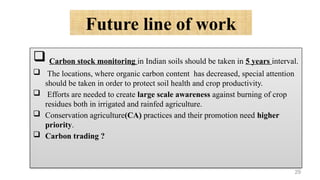
Future line ofwork
Carbon stock monitoring in Indian soils should be taken in 5 years interval.
The locations, where organic carbon content has decreased, special attention
should be taken in order to protect soil health and crop productivity.
Efforts are needed to create large scale awareness against burning of crop
residues both in irrigated and rainfed agriculture.
Conservation agriculture(CA) practices and their promotion need higher
priority.
Carbon trading ?
30.
30
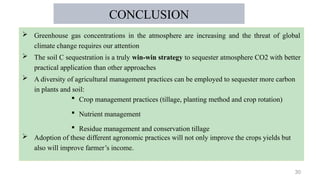
CONCLUSION
Greenhouse gasconcentrations in the atmosphere are increasing and the threat of global
climate change requires our attention
The soil C sequestration is a truly win-win strategy to sequester atmosphere CO2 with better
practical application than other approaches
A diversity of agricultural management practices can be employed to sequester more carbon
in plants and soil:
Adoption of these different agronomic practices will not only improve the crops yields but
also will improve farmer’s income.
Crop management practices (tillage, planting method and crop rotation)
Nutrient management
Residue management and conservation tillage

![4
CO2 is one of the main greenhouse gas that is causing global warming
About 30% of the total GHGs emission alone contributed by intensive agriculture
practices it self (IPCC, 2013)
Annual losses of 0.3–1.0 billions tons carbon through erosion of agricultural land
(Chappell et al., 2015)
1.4 billions metric tons C could be stored annually in agricultural soils, i.e.
equivalent to an annual storage rate of 0.4 % in top soil [IPCC, 2014]
80 % of this potential could be reached with an expenditure of 100 USD per ton of
CO2 (Smith et al., 2014)
SOIL CAROBON SEQUESTRATION: A MAJOR OPTION FOR TACKLING
CLIMATE CHANGE](https://image.slidesharecdn.com/rohitdocseminar-250901163101-633caf65/85/Strategies-for-enhancing-Carbon-sequestration-4-320.jpg)