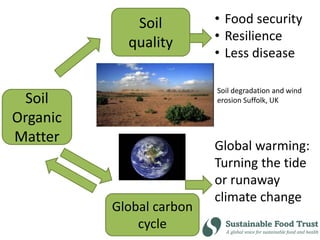
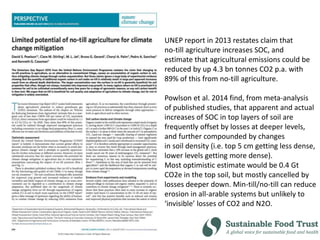
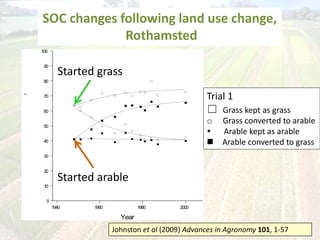
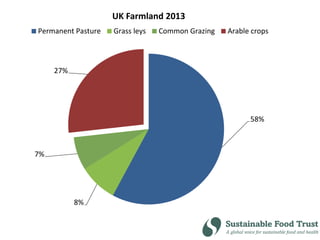
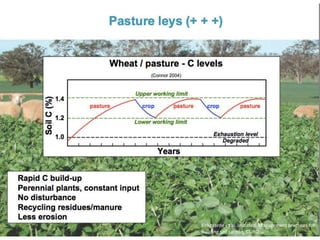
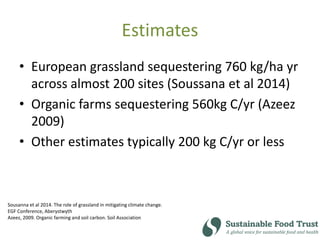
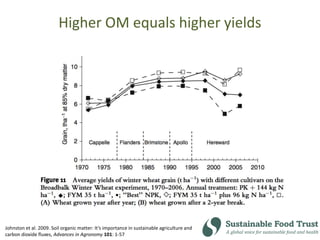
The potential of mixed and all-grass
farming to reverse soil degradation in
Europe
Richard Young
Global Soil Week, Berlin
21 April 2015
Soil
quality
Global carbon
cycle
• Food security
• Resilience
• Less disease
Global warming:
Turning the tide
or runaway
climate change
Soil
Organic
Matter
Soil degradation and wind
erosion Suffolk, UK
Tempting claims
‘Nearly 90 percent of the technical mitigation potential
of agriculture comes from soil carbon sequestration.’
(FAO 2009)
‘Reduce agriculture’s emissions by 1.1 - 4.3 Gt CO2 e’
Mostly due to no-till crop production.
(UNEP 2013)
‘A 10% increase in soil carbon stocks would cancel out
30 years of anthropogenic emissions.’
FAO 2009. Food Security and Agricultural Mitigation in Developing Countries:
Options for Capturing Synergies
UNEP 2013. The Emissions Gap Report
Various
Cropland and dust storms
Yangtze, Yellow, Mississippi and Paraná rivers
carrying topsoil to the sea
Arable cropping leads to approx. 60% soil
carbon loss (FAO)
Commodity crops –
ignoring the ‘rule of return’
UNEP report in 2013 restates claim that
no-till agriculture increases SOC, and
estimate that agricultural emissions could be
reduced by up 4.3 bn tonnes CO2 p.a. with
89% of this from no-till agriculture.
Powlson et al. 2014 find, from meta-analysis
of published studies, that apparent and actual
increases of SOC in top layers of soil are
frequently offset by losses at deeper levels,
and further compounded by changes
in soil density (i.e. top 5 cm getting less dense,
lower levels getting more dense).
Most optimistic estimate would be 0.4 Gt
CO2e in the top soil, but mostly cancelled by
losses deeper down. Min-till/no-till can reduce
erosion in all-arable systems but unlikely to
‘invisible’ losses of CO2 and N2O.
SOC changes following land use change,
Rothamsted
40
30
20
10
0
1960
90
1940
70
50
80
100
60
20001980
Year
-1
Started arable
Started grass
Johnston et al (2009) Advances in Agronomy 101, 1-57
Trial 1
☐ Grass kept as grass
o Grass converted to arable
 Arable kept as arable
 Arable converted to grass
UK grass leys under 5 years old
• 1977 30% of farmland
• 1999 18% of farmland
• 2013 <8% (7.56%) of farmland
77 & 99 Hatch et al. 2002 Grassland re-sowing and arable-grass rotations in the United Kingdom etc.
13 Defra 2014 Farming statistics
58%
8%
7%
27%
UK Farmland 2013
Permanent Pasture Grass leys Common Grazing Arable crops
Kirkgaarde et al. undated. Management practices for
Building soil carbon. CSIRO
Estimates
• European grassland sequestering 760 kg/ha yr
across almost 200 sites (Soussana et al 2014)
• Organic farms sequestering 560kg C/yr (Azeez
2009)
• Other estimates typically 200 kg C/yr or less
Sousanna et al 2014. The role of grassland in mitigating climate change.
EGF Conference, Aberystwyth
Azeez, 2009. Organic farming and soil carbon. Soil Association
Higher OM equals higher yields
Johnston et al. 2009. Soil organic matter: It’s importance in sustainable agriculture and
carbon dioxide fluxes, Advances in Agronomy 101: 1-57
But, adding organic matter to
cropland is not the best answer
Organic matter still declines on
sandy and sandy loam cropland soils, though
Will increase on clay soils. However,
more than 75% of the added carbon
is lost to the atmosphere.
Better to add composted OM to grassland
then rotate with arable crops as in
traditional mixed farming systems.
(However, all Rothamsted research
arable-based and this has not been
tested in a controlled study in the UK)
Continuous arable
with fallows
Continuous arable
3 year grass/clover ley
Woburn Ley/Arable Experiment
sandy loam soil, 7% clay, 60 years
3 years “treatment” cropping followed by
2 years arable “test” crops
Johnston et al (2009) Advances in Agronomy 101, 1-57
“Treatment”
cropping
3 year grass ley + N
%C increase ≈ 0.23%
With thanks to
Professor David Powlson
Trees have as much below ground, as wood above ground.
Some species of grass have 3 times as much root material
below ground as grass above ground.
Rooting depth of Grass, legumes and herbs
Ryegrass 0.6m
Timothy & Meadow fescue 0.75m
White clover 0.75m.
Tall fescue 1.1m.
Cocksfoot 1.2m
Birdsfoot trefoil 1.3m.
Smooth Meadow grass & Vetch 1.5m.
Alsike clover 2.m
Sweet clover 2.5m.
Red clover & chicory 3m.
Sainfoin 4m.
Lucerne 5-6m.
Methane
• UN FAO “Livestock’s Long Shadow claimed in 2006 that
livestock are responsible for 18% of anthropogenic
GHG emissions , more than transport
• Figure revised down to 14.5% in 2013
• Other estimates put total farming contribution at ‘8 –
10.8%’, excluding LUC. FAO 2013 only included LUC for
S. America.
• Impression given that ruminants mostly responsible for
this due to their methane emissions
• Let’s just put this in context
Global Warming: A Closer Look at the
Numbers, from www.geocraft.com
Wetlands
31%
Enteric Fermentation
18%
Fossil Fuels
15%
Oceans etc
7%
Rice
6%
Landfill & Waste water
11%
Termites
4%
Other Agriculture
4%
Manure
2%
Biomass
Burning
2%
Wetlands
Enteric Fermentation
Fossil Fuels
Oceans etc
Rice
Landfill & Waste water
Termites
Other Agriculture
Manure
Biomass Burning
Methane – all sources
Industry
29%
Transport
15%
Land Use Change
15%
Agriculture
7%
Energy Supply
13%
Residential
11%
Commercial
7%
Waste
3%
Global Anthropogenic GHG Sources
Knapp J R et al. 2013. Enteric methane in dairy cattle production,
J. Dairy Sci 97:3231-3261
(5.5% Methane)

Global Soil Week - Richard Young

  • 1.
    The potential ofmixed and all-grass farming to reverse soil degradation in Europe Richard Young Global Soil Week, Berlin 21 April 2015
  • 2.
    Soil quality Global carbon cycle • Foodsecurity • Resilience • Less disease Global warming: Turning the tide or runaway climate change Soil Organic Matter Soil degradation and wind erosion Suffolk, UK
  • 3.
    Tempting claims ‘Nearly 90percent of the technical mitigation potential of agriculture comes from soil carbon sequestration.’ (FAO 2009) ‘Reduce agriculture’s emissions by 1.1 - 4.3 Gt CO2 e’ Mostly due to no-till crop production. (UNEP 2013) ‘A 10% increase in soil carbon stocks would cancel out 30 years of anthropogenic emissions.’ FAO 2009. Food Security and Agricultural Mitigation in Developing Countries: Options for Capturing Synergies UNEP 2013. The Emissions Gap Report Various
  • 4.
  • 5.
    Yangtze, Yellow, Mississippiand Paraná rivers carrying topsoil to the sea
  • 8.
    Arable cropping leadsto approx. 60% soil carbon loss (FAO)
  • 9.
    Commodity crops – ignoringthe ‘rule of return’
  • 10.
    UNEP report in2013 restates claim that no-till agriculture increases SOC, and estimate that agricultural emissions could be reduced by up 4.3 bn tonnes CO2 p.a. with 89% of this from no-till agriculture. Powlson et al. 2014 find, from meta-analysis of published studies, that apparent and actual increases of SOC in top layers of soil are frequently offset by losses at deeper levels, and further compounded by changes in soil density (i.e. top 5 cm getting less dense, lower levels getting more dense). Most optimistic estimate would be 0.4 Gt CO2e in the top soil, but mostly cancelled by losses deeper down. Min-till/no-till can reduce erosion in all-arable systems but unlikely to ‘invisible’ losses of CO2 and N2O.
  • 11.
    SOC changes followingland use change, Rothamsted 40 30 20 10 0 1960 90 1940 70 50 80 100 60 20001980 Year -1 Started arable Started grass Johnston et al (2009) Advances in Agronomy 101, 1-57 Trial 1 ☐ Grass kept as grass o Grass converted to arable  Arable kept as arable  Arable converted to grass
  • 12.
    UK grass leysunder 5 years old • 1977 30% of farmland • 1999 18% of farmland • 2013 <8% (7.56%) of farmland 77 & 99 Hatch et al. 2002 Grassland re-sowing and arable-grass rotations in the United Kingdom etc. 13 Defra 2014 Farming statistics
  • 13.
    58% 8% 7% 27% UK Farmland 2013 PermanentPasture Grass leys Common Grazing Arable crops
  • 14.
    Kirkgaarde et al.undated. Management practices for Building soil carbon. CSIRO
  • 15.
    Estimates • European grasslandsequestering 760 kg/ha yr across almost 200 sites (Soussana et al 2014) • Organic farms sequestering 560kg C/yr (Azeez 2009) • Other estimates typically 200 kg C/yr or less Sousanna et al 2014. The role of grassland in mitigating climate change. EGF Conference, Aberystwyth Azeez, 2009. Organic farming and soil carbon. Soil Association
  • 16.
    Higher OM equalshigher yields Johnston et al. 2009. Soil organic matter: It’s importance in sustainable agriculture and carbon dioxide fluxes, Advances in Agronomy 101: 1-57
  • 17.
    But, adding organicmatter to cropland is not the best answer Organic matter still declines on sandy and sandy loam cropland soils, though Will increase on clay soils. However, more than 75% of the added carbon is lost to the atmosphere. Better to add composted OM to grassland then rotate with arable crops as in traditional mixed farming systems. (However, all Rothamsted research arable-based and this has not been tested in a controlled study in the UK)
  • 18.
    Continuous arable with fallows Continuousarable 3 year grass/clover ley Woburn Ley/Arable Experiment sandy loam soil, 7% clay, 60 years 3 years “treatment” cropping followed by 2 years arable “test” crops Johnston et al (2009) Advances in Agronomy 101, 1-57 “Treatment” cropping 3 year grass ley + N %C increase ≈ 0.23% With thanks to Professor David Powlson
  • 19.
    Trees have asmuch below ground, as wood above ground. Some species of grass have 3 times as much root material below ground as grass above ground.
  • 20.
    Rooting depth ofGrass, legumes and herbs Ryegrass 0.6m Timothy & Meadow fescue 0.75m White clover 0.75m. Tall fescue 1.1m. Cocksfoot 1.2m Birdsfoot trefoil 1.3m. Smooth Meadow grass & Vetch 1.5m. Alsike clover 2.m Sweet clover 2.5m. Red clover & chicory 3m. Sainfoin 4m. Lucerne 5-6m.
  • 21.
    Methane • UN FAO“Livestock’s Long Shadow claimed in 2006 that livestock are responsible for 18% of anthropogenic GHG emissions , more than transport • Figure revised down to 14.5% in 2013 • Other estimates put total farming contribution at ‘8 – 10.8%’, excluding LUC. FAO 2013 only included LUC for S. America. • Impression given that ruminants mostly responsible for this due to their methane emissions • Let’s just put this in context
  • 22.
    Global Warming: ACloser Look at the Numbers, from www.geocraft.com
  • 24.
    Wetlands 31% Enteric Fermentation 18% Fossil Fuels 15% Oceansetc 7% Rice 6% Landfill & Waste water 11% Termites 4% Other Agriculture 4% Manure 2% Biomass Burning 2% Wetlands Enteric Fermentation Fossil Fuels Oceans etc Rice Landfill & Waste water Termites Other Agriculture Manure Biomass Burning Methane – all sources
  • 25.
    Industry 29% Transport 15% Land Use Change 15% Agriculture 7% EnergySupply 13% Residential 11% Commercial 7% Waste 3% Global Anthropogenic GHG Sources Knapp J R et al. 2013. Enteric methane in dairy cattle production, J. Dairy Sci 97:3231-3261 (5.5% Methane)

Editor's Notes

  • #7 Before we look at any data, which type of farming more likely to lead to soil erosion – grassland or continuous arable cropping?
  • #11 These studies relate to temperate zones. Early indications from an ongoing review of published studies by Powlson as yet unpublished are that there may be very small carbon gains in tropical soils under no-till, but I would question how those equate to the CO2e emissions associated in the production, distribution, application of fertilisers used, especially nitrogenous fertilisers the production of which alone results in 6.7 (Mortimer et al 1993) to c.8 (Rees conference paper) 2015 tonnes of CO2 e per tonne of Nitrogen (i.e. per approx 3 tonnes of ammonium nitrate) At typical (UK) application rate of 140 kg N/ha equates to 938 kg CO2 (256kg carbon) per ha per year and for oilseed rape typically receiving 200 kg N/ha 1,340 kg CO2 (366) kg carbon per ha/yr, to which needs to be added to N20 losses from soil induced by N fertilsation, the N2O (via ammonia losses) and more.
  • #22 Obviously, we need to look at full GHG equations not just methane. But due to limitations of this presentation and due to the FAO’s focus on methane which has motivated NGOs (in the UK and some other countries) to campaign against grazing livestock systems, I am just looking at methane for now.
  • #23 According to this website, methane responsible for 7.2% of anthropogenic global warming. This may be an slight under estimate. Still some lack of agreement about which conversion factor to use for methane to express as CO2eq: 21,23, 26, 35 and even 82 times all used by different authors.
  • #24 Note that only 4 published studies had (in 2001) estimates both ruminant and rice emissions, yet one of these put ruminants and rice at similar levels and another put emissions from rice higher than those from ruminants. So can we be sure that current commonly accepted summaries which put ruminants much higher than rice production are correct?
  • #25 We should also consider the many studies which have looked at soil as a methane sink. Soils only responsible for c. 5% of the methane sink but difference between global emissions and sinks for methane are ‘only’ about 3% per year. Agriculture practiced on 37& of land surface and ammonium-based fertilisers killing off the methantrophic soil bacteria which use methane as an energy source. Grassland fertilsed by forage legumes is beneficial to these bacteria, arable cropping most widely used nitrogen fertilisers very detrimental. However, highest levels of methanotrophic bacteria are in virgin forest soils, next highest on established grasslands. But 20% or more of actual methane increase is possibly offset in unfertilised grasslands globally, which is slighly more than the net contribution from ruminants. Also need to note recent (and expected) studies indicating that emissions from natural gas extraction, distribution and use have been significantly under-estimated.