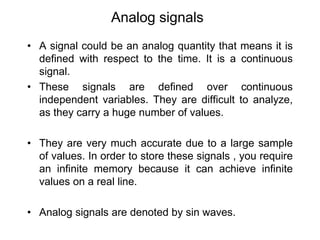
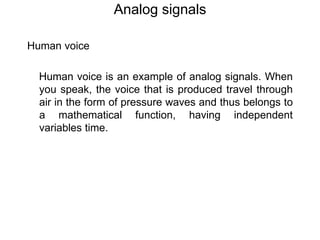
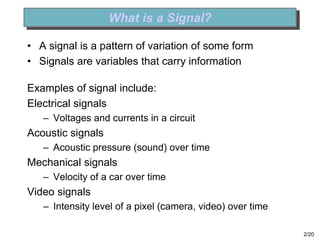
A signal can be defined as a pattern of variation that carries information over time. Signals can be continuous analog signals defined by mathematical functions, or discrete digital signals represented by discrete samples. Analog signals are more accurate but digital signals are easier to store and analyze. Conversion between analog and digital signals involves sampling the analog signal at discrete time intervals and quantizing the amplitude into discrete levels. Signals can be analyzed in the time domain, looking at amplitude variation over time, or the frequency domain, looking at how many times different events occur over the total observation period.

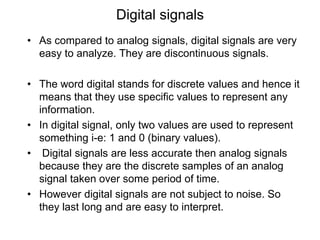
![TIME SIGNALS DESCRIPTION
1. Mathematical expression: x(t)=Asin()
2. Continuous (Analogue)
-15
-10
-5
0
5
10
15
0 5 10 15 20
3. Discrete (Digital)
x[n]
n](https://image.slidesharecdn.com/signalsbasics-210301065713/85/Signals-basics-8-320.jpg)
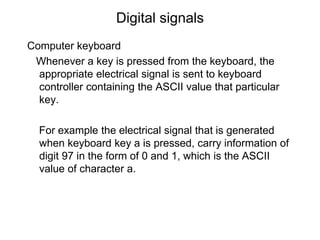
![Continuous & Discrete-Time Signals
Continuous-Time Signals
Most signals in the real world are
continuous time, as the scale is
infinitesimally fine.
Eg voltage, velocity,
Denote by x(t), where the time
interval may be bounded (finite) or
infinite
Discrete-Time Signals
Some real world and many digital
signals are discrete time, as they
are sampled
E.g. pixels, daily stock price (anything
that a digital computer processes)
Denote by x[n], where n is an integer
value that varies discretely
x(t)
t
x[n]
n](https://image.slidesharecdn.com/signalsbasics-210301065713/85/Signals-basics-10-320.jpg)