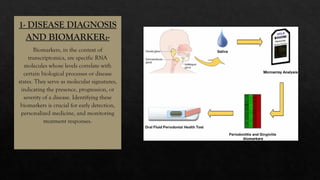
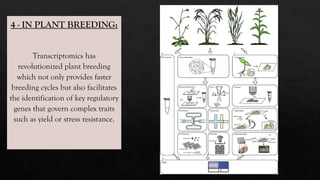
TRANSCRIPTOMIC-
TRANSCRIPTOMICS , THE STUDY OF RNA IN ANY OF ITS FORM. THE SET OF ALL RNA
MOLECULES INCLUDING m RNA , r RNA , t RNA AND OTHER NON-CODING RNA
PRODUCED IN ONE OR A POPULATION OF CELLS.
-MISBA AMREEN
CONTENT
DEFINITION
MOLECULAR MECHANISM
METHODOLOGY
APPLICATION
DEFINITION – The term can be applied to the total set of transcripts in a given organism, or to the specific subset of transcripts
present in a particular cell type. The study of transcriptomics , also referred to as expression profiling , examines the expression level
of mRNAs in a given cell population, often using high – throughput techniques based on DNA microarray technology.
Why use transcriptomes in biological research?
MOLECULAR MECHANISM
THE STAGE OF GENE EXPRESSION
WE CAPTURE:-
METHODOLOGY
1- Single Cell Transcriptomics
Step 1: Preparing Individual Cells-
We can do this in a couple of ways: by using enzymes
to dissolve the tissue or by physically breaking it
apart. In some applications, we break down tissues
and extract nuclei from the cells. This is done when,
for example, cells like cardiomyocytes are generally
too big for sequencing.
Step 2: Separating the Cells:-
There are two main ways to do this.
Method A: Sorting with FACS:
We can use a special machine called a Flow
Cytometer (FACS) to pick out single, live cells and
put them into tiny wells in a plate. We can also use a
special dye to check if the cells are alive and healthy.
If we're interested in a particular type of cell, we can
even use this machine to pick out only those cells.
Method B: Using Microfluidics
Alternatively, we can use microfluidics, where
we put our cell mixture onto a chip with tiny
beads and chemicals. By squeezing the cell
mixture through tiny tubes on the chip, we
separate the cells one by one. These isolated
cells get paired with the beads and chemicals
in tiny droplets for the next step.
Step 3: Labeling and Copying
RNA
Each cell contains a tiny amount of RNA,
which requires amplification to study it
adequately. We do this by making lots of
copies of the RNA using a process called PCR
and/or IVT. To tell the cells apart later, we
add a unique label, called a cellular barcode,
to each cell's RNA.
Step 4: Preparing for Sequencing
Now that we have made copies of the RNA
and barcoded them, we mix all RNA copies
from different cells into one batch. We add
another set of barcodes, this time to show
which batch each RNA copy comes from.
This helps to identify batch effects without
biological meaning. We then prepare the
mix as a library for Next Generation
Sequencing.
We can perform sequencing in-house
sequencing facility. It has the most advanced
Illumina NovaSeq X Plus as one of the
sequencing machines to do the work.
Step 5: Analyzing the Data-
Next Generation Sequencing generates a large
amount of data for each cell. We can take this
raw data and match it with a reference to
understand which genes are expressed in each
cell. We also run quality control to make sure
the data is reliable. This step is like putting all
the pieces of a puzzle together.
Once we have organized the data, we break it
down to the level of individual cells. This
creates a table with rows for all the genes we've
detected and columns for each cell. Because
there are often hundreds or thousands of cells
in our samples, the amount of data can be
overwhelming. This requires special tools, like
data analysis pipelines, to make sense of it all.
Some of these genes will be marker genes that
help identify a group of cells as a certain cell
type. For example, liver macrophage marker
genes may designate a number of cells as liver
macrophages.
Step 6 Data Visualization:
Finally, we visualize the data as accessible data
figures. As you can imagine, you need specific
computational approaches to create a picture
from very large numbers of transcriptomes. A
key step in this process is dimensionality
reduction. This generates the tSNE or UMAP
plots often seen in single-cell papers.
APPLICATIONS
1- DISEASE DIAGNOSIS
AND BIOMARKER:-
Biomarkers, in the context of
transcriptomics, are specific RNA
molecules whose levels correlate with
certain biological processes or disease
states. They serve as molecular signatures,
indicating the presence, progression, or
severity of a disease. Identifying these
biomarkers is crucial for early detection,
personalized medicine, and monitoring
treatment responses.
2- DRUG DEVELOPMENT:
IDENTIFYING POTENTIAL
DRUG TARGETS BY
ANALYZING GENES OR
PATHWAYS INVOLVED IN A
DISEASE.
3- CANCER RESEARCH:
Advances of individual-cell RNA
sequencing in carcinoma –
1-scRNA-seq and CTCs
2-scRNA-seq and CSCs
3-scRNA-seq and tumor resistance
4 - IN PLANT BREEDING:
Transcriptomics has
revolutionized plant breeding
which not only provides faster
breeding cycles but also facilitates
the identification of key regulatory
genes that govern complex traits
such as yield or stress resistance.
Thank you!
-Misba Amreen

Omics study - Transcriptomics ( RNA) Microbiology

  • 1.
    TRANSCRIPTOMIC- TRANSCRIPTOMICS , THESTUDY OF RNA IN ANY OF ITS FORM. THE SET OF ALL RNA MOLECULES INCLUDING m RNA , r RNA , t RNA AND OTHER NON-CODING RNA PRODUCED IN ONE OR A POPULATION OF CELLS. -MISBA AMREEN
  • 2.
  • 3.
    DEFINITION – Theterm can be applied to the total set of transcripts in a given organism, or to the specific subset of transcripts present in a particular cell type. The study of transcriptomics , also referred to as expression profiling , examines the expression level of mRNAs in a given cell population, often using high – throughput techniques based on DNA microarray technology.
  • 4.
    Why use transcriptomesin biological research?
  • 5.
  • 6.
    THE STAGE OFGENE EXPRESSION WE CAPTURE:-
  • 7.
  • 8.
    1- Single CellTranscriptomics Step 1: Preparing Individual Cells- We can do this in a couple of ways: by using enzymes to dissolve the tissue or by physically breaking it apart. In some applications, we break down tissues and extract nuclei from the cells. This is done when, for example, cells like cardiomyocytes are generally too big for sequencing. Step 2: Separating the Cells:- There are two main ways to do this. Method A: Sorting with FACS: We can use a special machine called a Flow Cytometer (FACS) to pick out single, live cells and put them into tiny wells in a plate. We can also use a special dye to check if the cells are alive and healthy. If we're interested in a particular type of cell, we can even use this machine to pick out only those cells.
  • 9.
    Method B: UsingMicrofluidics Alternatively, we can use microfluidics, where we put our cell mixture onto a chip with tiny beads and chemicals. By squeezing the cell mixture through tiny tubes on the chip, we separate the cells one by one. These isolated cells get paired with the beads and chemicals in tiny droplets for the next step. Step 3: Labeling and Copying RNA Each cell contains a tiny amount of RNA, which requires amplification to study it adequately. We do this by making lots of copies of the RNA using a process called PCR and/or IVT. To tell the cells apart later, we add a unique label, called a cellular barcode, to each cell's RNA.
  • 10.
    Step 4: Preparingfor Sequencing Now that we have made copies of the RNA and barcoded them, we mix all RNA copies from different cells into one batch. We add another set of barcodes, this time to show which batch each RNA copy comes from. This helps to identify batch effects without biological meaning. We then prepare the mix as a library for Next Generation Sequencing. We can perform sequencing in-house sequencing facility. It has the most advanced Illumina NovaSeq X Plus as one of the sequencing machines to do the work.
  • 11.
    Step 5: Analyzingthe Data- Next Generation Sequencing generates a large amount of data for each cell. We can take this raw data and match it with a reference to understand which genes are expressed in each cell. We also run quality control to make sure the data is reliable. This step is like putting all the pieces of a puzzle together. Once we have organized the data, we break it down to the level of individual cells. This creates a table with rows for all the genes we've detected and columns for each cell. Because there are often hundreds or thousands of cells in our samples, the amount of data can be overwhelming. This requires special tools, like data analysis pipelines, to make sense of it all.
  • 12.
    Some of thesegenes will be marker genes that help identify a group of cells as a certain cell type. For example, liver macrophage marker genes may designate a number of cells as liver macrophages. Step 6 Data Visualization: Finally, we visualize the data as accessible data figures. As you can imagine, you need specific computational approaches to create a picture from very large numbers of transcriptomes. A key step in this process is dimensionality reduction. This generates the tSNE or UMAP plots often seen in single-cell papers.
  • 14.
  • 15.
    1- DISEASE DIAGNOSIS ANDBIOMARKER:- Biomarkers, in the context of transcriptomics, are specific RNA molecules whose levels correlate with certain biological processes or disease states. They serve as molecular signatures, indicating the presence, progression, or severity of a disease. Identifying these biomarkers is crucial for early detection, personalized medicine, and monitoring treatment responses.
  • 16.
    2- DRUG DEVELOPMENT: IDENTIFYINGPOTENTIAL DRUG TARGETS BY ANALYZING GENES OR PATHWAYS INVOLVED IN A DISEASE.
  • 17.
    3- CANCER RESEARCH: Advancesof individual-cell RNA sequencing in carcinoma – 1-scRNA-seq and CTCs 2-scRNA-seq and CSCs 3-scRNA-seq and tumor resistance
  • 18.
    4 - INPLANT BREEDING: Transcriptomics has revolutionized plant breeding which not only provides faster breeding cycles but also facilitates the identification of key regulatory genes that govern complex traits such as yield or stress resistance.
  • 20.