Download to read offline

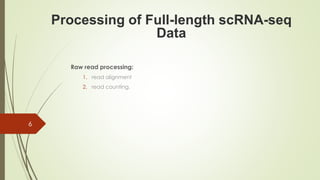
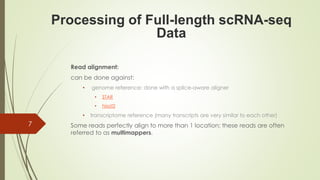
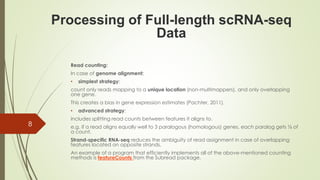
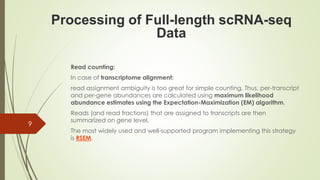
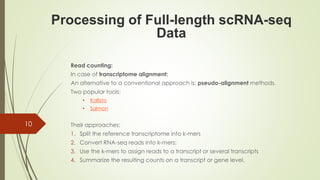
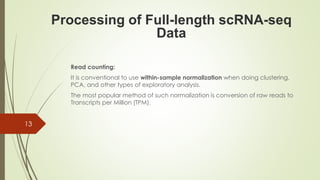
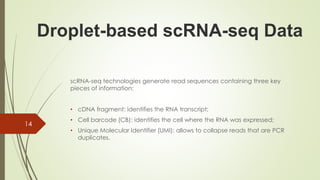
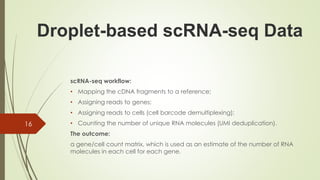
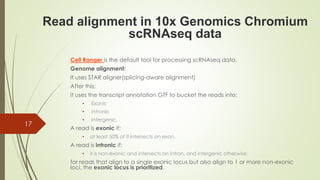
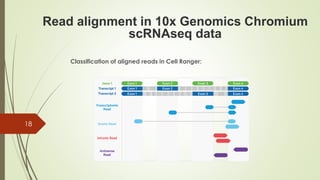
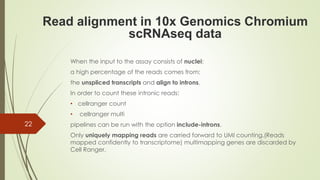
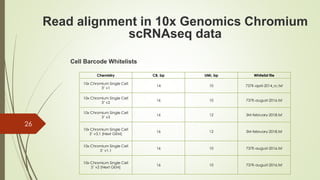
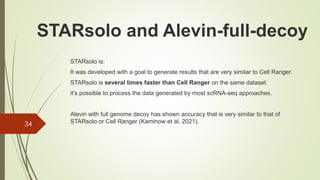

This document summarizes the key steps in processing raw single-cell RNA sequencing (scRNA-seq) data, including: 1. Aligning reads to a reference genome or transcriptome using tools like STAR or HISAT2. 2. Counting reads and assigning them to genes, which can involve splitting counts between overlapping genes. 3. Normalizing counts within samples using transcripts per million (TPM) for downstream analysis. 4. Identifying cell barcodes and unique molecular identifiers (UMIs) to assign reads to cells and collapse PCR duplicates.


![[DSC Europe 25] Josip Saban - Career building for data professionals.pptx](https://cdn.slidesharecdn.com/ss_thumbnails/zroflcttkm1vmli0txea-josip-saban-career-building-for-data-professionals-260123083019-587cdb8c-thumbnail.jpg?width=640&height=640&fit=bounds)


![[DSC Europe 25] Ekaterina Bubenko - Behind the Curtain: How Data Roles Collab...](https://cdn.slidesharecdn.com/ss_thumbnails/anmv6x8dstqbbzchoklr-ekaterina-bubenko-behind-the-curtain-how-data-roles-collaborate-in-the-ai-era-a-260123083019-4b252ec7-thumbnail.jpg?width=640&height=640&fit=bounds)


![[DSC Europe 25] Milos Belcevic - Product Professional's Journey to Full-Stack...](https://cdn.slidesharecdn.com/ss_thumbnails/1zovd6fgsycdg4wvgvls-milos-belcevic-product-professionals-journey-to-full-stack-product-developer-260123083019-d993120d-thumbnail.jpg?width=640&height=640&fit=bounds)
