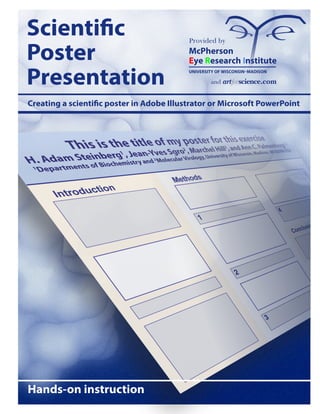
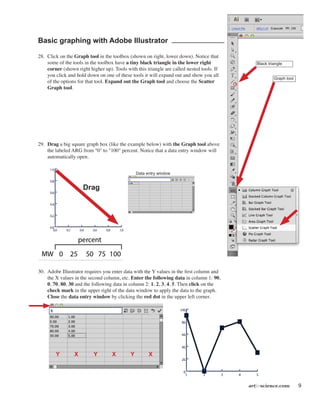
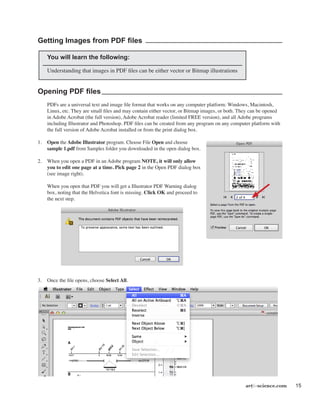
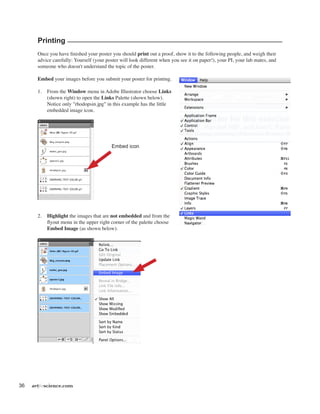
Scientific
Poster
Presentation
Creating a scientific poster in Adobe Illustrator or Microsoft PowerPoint
UNIVERSITY OF WISCONSIN–MADISON
Eye Research Institute
McPherson
and art
Provided by
forscience.com
Hands-on instruction
116 artforscience.com
Files require to complete this tutorial
Can be downloaded at the following URL:
artforscience.com/artforscience/Tutorials_files/samples_folder.zip
Poster templates for both Adobe Illustrator and Microsoft PowerPoint
Can be downloaded at the following URL:
artforscience.com/artforscience/Tutorials_files/templates.zip
artforscience.com 1
Creating a scientific poster
This tutorial will teach you the basics that will help you create an effective scientific poster in either
Adobe Illustrator and/or Microsoft PowerPoint. It will teach you how to use two hands at the same time
to control both the keyboard and the mouse, essential shortcuts, special function keys, and other items that
are listed below.
In this tutorial you will learn the following:
Basic Adobe Illustrator.................................................................................................3
Open, Place, Zoom, Text, Shift-Option, Arrow keys, Selection tools, Rectangles, Fill & Stroke
Adobe Illustrator - Graphing.........................................................................................9
Complex Selections, Option Double-Click, Shift Arrow Keys
Vector vs. Bitmap........................................................................................................14
Two very different kinds of image file formats
Images from PDF files.................................................................................................15
There are two different kinds of PDFs, image PDF verses vector PDF
Correctly inserting images into Microsoft PowerPoint............................................17
Converting vector to image format, correctly setting dpi and sizes
Creating a poster in Adobe Illustrator.......................................................................25
Poster size artboard, Formatting, Font sizes, Layout, Text boxes, Leading, Placing images,
Rectangles, Adding color to fills, Strokes
Minimum rules for poster layout and presenting poster information....................31
Author identity, Headings, Traffic flow, Appearances, Balance between images and text, Layout,
Basic coloring, highlighting
Poster examples..........................................................................................................35
Three sample posters with comments
Printing your poster....................................................................................................36
Scaling when printing
Creating a poster in Microsoft PowerPoint...............................................................39
Poster size artboard, Formatting, Font sizes, Layout, Text boxes, Leading, Placing images,
Rectangles, Adding color to fills, Strokes
Converting a PowerPoint talk to a PowerPoint poster............................................46
Slide Masters, Arranging multiple Windows
This tutorial was created by:
H. Adam Steinberg
Artist/Scientist
Web site: artforscience.com
Email: adam @ artforscience.com
Phone: 608/729-5944
2 artforscience.com
artforscience.com 3
Basic Adobe Illustrator
You will learn the following:
Open a new document
Placing images or text
Zoom tool and View menu
Character palette
Paragraph palette
Text tool
Opening a new document
1.	 Open Adobe Illustrator on the Mac from the Dock.
2. 	 Choose New from the File menu (shown at right).
	 You will be presented with the New Document dialog
box that is shown at the right.
Under the Profile: drop down menu, choose Print
	 for files that will be used for journal illustrations and
posters, choose Basic RGB for files that will be used
in presentations.
	Under Size choose Letter. Illustrations for journal
figures and presentations are created at letter size, for
posters, type in the Width and Height of your poster
into the size boxes.
3.	Click OK.
Place command
4. 	 From the File menu choose Place.
NOTE: Use the Place command to insert text (from
Microsoft Word), or Bitmap images, such as TIF,
JPEG, GIF, PSD, EPS, etc., directly into Adobe
Illustrator. Do not use the Place command to insert
Vector image files such as AI, SVG, EPS, PDF, and
TXT (ASCII or binary) that are created by programs
such as Adobe Illustrator, Macromedia Freehand,
Deneba Canvas, CorelDraw, or from "Print to File" or
"print to PDF" commands. Simply choose Open from
the File menu for Vector illustrations and images. See
page 14 to learn more about the differences between
Bitmap images and Vector illustrations and images.
5. 	 In the directory window that opens from the Place
command, choose the file ARGs1.tif from the samples
folder you downloaded earlier.
Constrain and copy shortcuts
Transform and Duplication
Moving objects with the Arrow keys
Black vs. White selection tools
Marquee tool
Fill and Stroke
4 artforscience.com
Zoom tool and View Menu
6.	 Click on the zoom tool (shown on the right).
	 The zoom tool works in three different ways:
1). You can click on an image and zoom in.
2). You can hold down the option or alt key and click
to zoom out. Notice when you do this the plus
sign in the middle of the magnifying lens turns to
a minus sign (to show you zoom out).
3). You can click and hold down the mouse button on
an item and it will zoom into exactly that space.
Take minute or two and try all three zoom options
listed above. You can also Zoom in an out of an Illustrator
window by using the options in the View menu (shown
below left). Try Zoom In, Zoom Out, Fit in Window, and
Actual Size from the View menu. When you are finished,
choose Actual Size from the View Menu and then click
and hold the zoom tool over the placed ARG until it nearly
fills the screen (as shown in the example at right).
Click and hold zoom tool
over ARG
artforscience.com 5
Basic labeling with Adobe Illustrator
Character palette
7.	 From the Window menu, choose Type, then Character
(image right). The Character Palette will open.
NOTE: If the Character palette is already open, the word
Character will have a check mark next to its name in the
window menu. If this is the case, you only need to find the
palette on your desktop. Click on the fly out menu (set of
four bars in the upper right corner of the palette) and choose
Show Options. Also notice the options for Superscript and
Subscript hidden here! You will use these later in your
example poster title.
Paragraph palette
8.	 From the Window menu choose Type and then Paragraph
(image right). The Paragraph Palette will open. Click on the
fly out menu (set of four bars in the upper right corner of the
palette) and choose Show Options.
Fly out menu
Fly out menu
6 artforscience.com
Type tool
9.	 Click on the Type tool (shown left).
10.	 Click (DO NOT DRAG) the Type tool right
above the middle of the first lane of the ARG (as
shown right). Type the capital letter “X”. Select
(block) the letter “X” (again as shown right).
Change the “X” to center text by clicking on the
Align center image in the paragraph palette you
opened in the last step.
Constrain and copy shortcuts
11.	 Click on the white arrow tool, the
Direct Selection tool (shown
left).
12.	 Click on the letter “X”, and then
with your left thumb and fore
finger, hold down the shift and
the option (or alt) keys on the left
side of the keyboard while you
drag the “X” to the right with
the mouse, placing it over the
second lane of the ARG. You
must let go of the mouse button
first and then the shift and option or alt keys second. Notice that the cursor changes to two triangles,
one black and one white (as shown above right) whenever you hold down the option or alt key and
drag an object with the white arrow tool. This is Illustrator's way of telling you that it is duplicating the
object. You hold the option or alt key and drag to duplicate the object. You hold down the shift
key to constrain the movement of the cursor to a perfectly horizontal line. Holding down the shift
key will constrain the movement of the cursor up, down, left, right and also to 45 degrees in any
direction. This "constraining" shortcut is adjustable in the preference panel and works in all Adobe and
Microsoft programs since it is a function of the operating system.
Transform and Duplication
13.	Choose Object–Transform–Transform Again – four times (or you could hold down the Command
key and hit the D key, which is the shortcut for this action, circled below).
Align center
Center
artforscience.com 7
	 The letter X will move to the right and duplicate itself four times! By duplicating your text this way you will get
the same size and style font for all of your text. You may notice that you didn't exactly duplicate the text over
the second lane of the ARG when you option (or alt) dragged it, so when you duplicated the text three more
times it didn't exactly line up with the other lanes of the gel. In the next step we will fix the alignment!
Move objects via the Arrow keys
14.	 Take the Direct Selection tool (white arrow tool) and click on one of the misaligned “X's” to select it. Notice
that clicking the arrow keys moves the object that is selected a small distance to the left or the right. If you
hold down the shift key and then click on the arrow keys on the keyboard the text will move ten times as far, try
it. Use the arrow keys on the keyboard to get your “X's” in visual alignment with the lanes of the ARG. This
arrow movement distance is adjustable in the preference panel and works in all Adobe and Microsoft programs.
15.	 With the type tool change the “X's" to “1", “2", “3", though "6".
Black vs. White selection tools
16.	 With the Direct Selection tool (white arrow tool) drag a box over all the lane numbers EXACTLY as you
see below.
NOTE: Do not include any of the ARG image below the numbers.
NOTE: all of the numbers will be selected. The Direct Selection tool selects parts of objects in three different
ways.
1).	 If you click on any part of an object, that part will be selected.
2).	 If you option (or alt) click on any part of an object the entire object will be selected.
3).	 If you drag a box over any part(s) of an object that/those part(s) will be selected. The Selection tool (black
arrow tool), selects whole objects in the same way. The Selection tool (black arrow tool) will also allow
you to rotate and scale selections while the Direct Selection tool will not.
Drag
8 artforscience.com
17.	 While you have all of the numbers selected,
click and drag on one of them, dragging them to
the bottom of the ARG lanes while you hold the
option and the shift keys (duplicating and
constraining them).
18.	 Label the top of the ARG with percentage points.
Change the top "1" to "MW", the top "2" to "0",
the "3" to "25", the"4" to "50", the "5" to "75" and
the "6" to "100"
Rectangle tool
19.	 Click on the Rectangle tool (shown left).
20.	 Drag a box from between the "MW" lane and the
“0” lane to the right of the "100" lane. (Follow the
image shown right.)
Fill and Stroke
21.	 Change the black fill to none by clicking on the
Fill box, then by clicking on the small box with
the red slash through it (labeled None right)
located below the Fill and Stroke boxes. Change
the stroke to black by clicking on the Stroke box
and then by clicking on the small Color box
below it (see example at right).
22.	 Click the Direct selection tool and then click on a
blank area of the desktop to deselect the box you
just drew.
23.	 Click once on the bottom line of the box (this
will select just the bottom part of the line) and
click the delete key on the keyboard.
24.	 With the Direct selection tool click on the "50".
25.	 Move the "50" up above the box while holding
down the shift and option key to constrain and
duplicate it.
26.	 Change the "50" to the word "percent".
27.	 In the View menu, choose Fit in Window.
Fill Stroke
NoneColor
Drag
Drag
artforscience.com 9
Basic graphing with Adobe Illustrator
28.	 Click on the Graph tool in the toolbox (shown on right, lower down). Notice that
some of the tools in the toolbox have a tiny black triangle in the lower right
corner (shown right higher up). Tools with this triangle are called nested tools. If
you click and hold down on one of these tools it will expand out and show you all
of the options for that tool. Expand out the Graph tool and choose the Scatter
Graph tool.
29.	 Drag a big square graph box (like the example below) with the Graph tool above
the labeled ARG from "0" to "100" percent. Notice that a data entry window will
automatically open.
30.	 Adobe Illustrator requires you enter data with the Y values in the first column and
the X values in the second column, etc. Enter the following data in column 1: 90,
0, 70, 80, 30 and the following data in column 2: 1, 2, 3, 4, 5. Then click on the
check mark in the upper right of the data window to apply the data to the graph.
Close the data entry window by clicking the red dot in the upper left corner.
Y X Y X Y X
Drag
Data entry window
Graph tool
Black triangle
10 artforscience.com
31.	 Notice that the fonts on the graph are too small and
the X and Y tick marks are inside the graph area.
	 Using the Direct selection tool drag a selection box
over the entire graph.
32. In the Character palette change the type to 12 points. Notice that if you click on the "TT" in the
Character palette that Illustrator will select the information in the TT box for you, making it easier to
enter text. All Adobe palettes work this way.
33.	 Using the Direct selection tool click on a blank part of the illustration to deselect everything. Drag
a selection box over the Y axis numbers, just as it is pictured below (left). Do not allow any of
the dotted selection box to touch any part of the graph! Arrow the Y axis values left with the
keyboard arrow keys or the Shift + Arrow keys.
Drag
Drag
artforscience.com 11
34.	 Do the same thing for the X axis. Notice that the selection box does not touch any part of the graph.
35.	 Using the Direct selection tool, option double-click on the Y axis tick marks, this will select all of
them as a group. Arrow them left with the keyboard arrows or the Shift + Arrow keys.
36.	 Do the same for the X value tick marks.
Drag
12 artforscience.com
When you are finished, your labeled ARG should look similar to this one.
artforscience.com 13
14 artforscience.com
There are two kinds of Images – Vector & Bitmap
Take a few minutes to review the following two types of images that can be made into PDF files. Make sure to
read all listed details about them. You will learn more about the difference between these two types of images in
the next section, Getting Images from PDF files.
Vector (Postscript)
• Computer files that are created from lines, fills and text
• Written in postscript language (PDFs are postscript)
• Files created by Adobe Illustrator,
	 Deneba Canvas, CorelDraw, ClarisWorks, etc.
• Can be scaled up to any dimension and still look good
• Sometimes the files are large, usually have poor compression
• May contain Bitmap information (below)
• File formats: AI, SVG, PS, EPS, PDF, and
			 TXT (may be ASCII or binary)
Bitmap
• Scanned images
• Files created in Adobe Photoshop, Adobe Elements,
	 CorelDraw, etc.
• Made of pixels that represent an image
• Pixels are always shades of gray
• Color images are layered grayscale files
		 Three grayscale layers (channels) in a RGB file
		 Four grayscale layers (channels) in a CMYK file
• Bitmap files are resolution (dpi or ppi) specific
• Should not be scaled up, pixels may become visible
• Can be scaled down via interpolation but resampling
will occur
• Generally do not contain vector information
(PDS, Photoshop native files may contain vector
information), may be saved as postscript files
• Some Bitmap images can be heavily compressed
• File formats are: PS, EPS, PDF, TXT, TIFF, BMP,
PCX, and PICT
• Web file formats are: JPEG, JPEG2000, GIF, PNG
Pixels
Vector art shown
as wireframe
Vector art
artforscience.com 15
Getting Images from PDF files
You will learn the following:
Understanding that images in PDF files can be either vector or Bitmap illustrations
Opening PDF files
PDFs are a universal text and image file format that works on any computer platform: Windows, Macintosh,
Linux, etc. They are small files and may contain either vector, or Bitmap images, or both. They can be opened
in Adobe Acrobat (the full version), Adobe Acrobat reader (limited FREE version), and all Adobe programs
including Illustrator and Photoshop. PDF files can be created from any program on any computer platform with
the full version of Adobe Acrobat installed or from the print dialog box.
1.	 Open the Adobe Illustrator program. Choose File Open and choose
sample 1.pdf from Samples folder you downloaded in the open dialog box.
2.	 When you open a PDF in an Adobe program NOTE, it will only allow
you to edit one page at a time. Pick page 2 in the Open PDF dialog box
(see image right).
	 When you open that PDF you will get a Illustrator PDF Warning dialog
box, noting that the Helvetica font is missing. Click OK and proceed to
the next step.
3.	 Once the file opens, choose Select All.
16 artforscience.com
There are two ways that one can save vector images into a PDF file. Notice in the top image below (sample
1.pdf), that the image parts are all in one box. This vector image was converted to a Bitmap image when it was
saved as a PDF file. You could open this PDF file in Adobe Photoshop and crop the Bitmap image out to use it
in a poster or PPT talk, however the image will be this current resolution and may result in a poor quality print.
4.	 Choose File Open and choose sample 2.pdf from the directory window. Pick page 2 in the Open PDF dialog
box. Choose Select All. Notice that the vector image parts are all highlighted and can be edited in this PDF file
(shown below at the bottom of the page). This vector image was retained as vector art in the PDF file. You can
resize and resave this image to use in a Poster or PPT talk to any resolution. This illustration is resolution
independent.
Bitmap image
Vector image
artforscience.com 17
Images into PowerPoint
You will learn the following:
Correct image file formats for PowerPoint talks and posters
How to create PNG files from Adobe Illustrator files
Notes
•	 All portable and fixed projectors for presentations are based on a screen resolution of 72 dpi, therefore all
image files inserted into a PowerPoint slide should be 72 dpi, or for even better looking presentations,
double that amount (150 dpi). They should not however, be 300 or 600 dpi!
•	 Though all poster printers can print posters at various higher resolutions, for efficiency of speed, print shops
generally print at 180 dpi. Therefore, all image files inserted into a poster should be 180 dpi, or for even
better looking posters, approximately double that amount (300 dpi). They should not however, be 600 or
1200 dpi!
•	 The PNG file format works best, but other file formats will also work but may cause problems when
switching between operating systems.
•	 For best results, PNG files should be 200% the final size you want, and then scaled to 50% in PowerPoint.
•	 All slides in a PowerPoint Presentation are 7.5” high and 10” wide, for 1024 projectors.
•	 When making a slide one should leave space for a title and a comfortable margin for the eye to rest in on all
four sides. Therefore, 6” x 9”, or less, is generally the maximum area for images on PowerPoint slides.
The PNG file format
Microsoft Office reccomends using the PNG file format for all images inserted into it's Office products. In this
section you will learn how to properly create PNG files from Adobe Illustrator vector files.
18 artforscience.com
Creating PNG files
1.	 Open Microsoft PowerPoint. From the PowerPoint Presentation Gallery choose the simple White theme.
2.	 From the Layout drop down menu under the Home tab,
choose Title Only slide.
3.	 From the Shape pull out menu Choose Rectangles and
then choose the first rectangle in the upper left.
artforscience.com 19
4.	 Draw a box (for this exercise draw it as it is shown below) to the approximate size and shape you want your
inserted image to be.
5.	 Double click on the box and the Format Shape options will open at the top of the page. In the size boxes,
change both the width and height to 4".
20 artforscience.com
6.	 Open Adobe Illustrator. Choose
Open from the File menu and then
choose sample 2.pdf from the samples
folder you downloaded earlier. Open
page 2. (See page 15, steps 1 and 2.)
7.	 Using the Direct selection tool click
and drag a selection box over
“section D”.
NOTE: Drag the selection box as close as
possible to the example shown right!
8.	 Copy and paste the image into a new
file by choosing Edit, then Copy. File,
then New. Edit, then Paste. Your
image should look something like the
example below.
9.	 Delete the extra lines around the figure, and also the letter
D and E (if you have them), by clicking on them with the
direct selection tool. First, click on the white space
around the figure to deselect everything, then click on a
line or a letter and hit the delete key. If you are deleting
a line you need to hit the delete key twice, once to
delete the line and once to delete the endpoints of the line.
NOTE: You may have created stray points making the above
deletions. Stray points are the endpoints of lines or text
anchors that do not contain lines or text. Zoom out to full
screen by choosing Actual Size from the View menu.
Choose Select, then All. Notice if there are any blue
highlighted dots around the figure. To remove these stray
points, you must deselect (click on the white space
around the figure to deselect everything), then choose
Select, then Object, then Stray Points (as shown right)
and then hit the delete key.
artforscience.com 21
10.	 From the Select menu choose All.
11.	 From the Window menu choose Transform
and the Transform palette will open
(remember, if the transform palette is already
open it will have a check mark next to it's name
in the menu). Make sure the "Constrain Width
and Height Proportions marker" is on.
12.	 Click on the flyout menu in the upper right of
the transform palette and from the fly out menu
choose "Scale Strokes and Effects".
NOTE: If you turn on Show Options in the flyout
menu you will get the Scale Strokes & Effects
checkbox in the Transform palette as shown
by the red arrow at the right.
13.	 The Transform palette allows one to move,
resize, rotate and skew images on the artboard
in Adobe Illustrator. In the “W:” box type
twice the width, OR in the “H:” box type twice
the height you noted for the size of the box you
drew in PowerPoint (see NOTE below about
units) and then hit the return or enter key.
NOTE: The default ruler units for Adobe Illustrator
is Picas (p) and Points (pt), a standard unit of
measure in the publishing world. You can change
the ruler units to a more familiar standard (inches)
or metric (centimeters) in the Preferences, Units (as
shown right). Or... you can just leave them as pts.
and type the unit symbol in any of the dialog boxes,
“in” for inches, “cm” for centimeters, “mm” for
millimeters, “px” for pixels, etc. Illustrator is
programmed to figure out what you mean!
The box I drew in
PowerPoint was 4” x 4”
so I entered 8” (8 in)
in the W: field.
Constrain marker
22 artforscience.com
14.	 Next we will take the image into PowerPoint.
	 From the File menu choose Export...
	The Export dialog box will open
	 (as shown below).
15.	 Name your file in the Save As: box,
choose Desktop for the file location on the left side, and
choose Format: PNG (png) from the dropdown menu at the bottom of the dialog box.
artforscience.com 23
16.	 A PNG Options dialog box will open.
	Choose Resolution: Medium (72ppi) and click OK.
NOTE: Transparent is choosen as a default. This will allow you to
place your PNG file over a colored background and have that
background show through.
17.	 Switch back to Microsoft PowerPoint.
18.	 From the Insert menu choose Photo, then Picture
From file. Choose the file you just saved from
Illustrator in the directory window that comes up.
24 artforscience.com
19.	 In the Size boxes at the top change the width of your image to 4.01".
NOTE: We always want to pick 50%... not 48%, not 53% or any other percent! The reason we pick EXACTLY 50%
is because the screen is 72 ppi (pixels/inch) and the file we just exported from Adobe Illustrator is 150 ppi. By
choosing exactly 50% we are perfectly aligning the image pixels with the screen pixels. In a pinch it is fine to
choose a percent slightly to one side or the other of 50% but the image quality will be slightly degraded. The
further you deviate from 50% the more the image quality will degrade.
20.	 Move the inserted picture over the blue box we drew earlier.
21.	 Click on the blue box and then hit the Delete key.
You now have a perfectly sized image on your slide. Choose view Slide Show from one of the three locations shown
below and look at your image on screen.
	 Yes, you could have transformed the size of your image
to 4" and exported it as a 150 dpi PNG file. But, I
needed you to understand how the Transform palette
works, and also how the pixel resolution of the image
relates to the pixel resolution of the screen...
artforscience.com 25
Creating a poster using Adobe Illustrator
You will learn the following:
Setting up a poster file
Changing the Unit preferences
Formatting and layout of a poster
Titles, identity and location
The abstract
Text boxes and leading
Setting up the poster file
NOTE: Before you try to create a poster, please complete the basic Adobe Illustrator tutorial starting on page 3.
1.	 Open Adobe Illustrator.
2. 	 Choose File–New.
	 You will be presented with a New Document
dialog box.
	 In the Name field it is a good idea to name
your poster in the following format: Year_
Lastname_Meeting.ai. This will help you
and everyone else keep track of your poster
during reviewing, sharing and printing.
	 Under the Color Mode drop down menu at
the bottom, make sure it says: CMYK
when creating a poster. Under Size type the
Width and Height of your poster in the
dialog boxes. Since the maximum paper
size the poster printer can print is 44”, keep
either the width OR the height to a
maximum of 43.5”, the other dimension
can be up to 227.54” (19’). Click OK.
NOTE: All meetings specify what size your
poster should be, please check the web site
of your particular meeting. Common sizes
are 24" x 36", 48" x 48", 48" x 60" and 48"
x 72".
3.	Choose View, then Fit in window.
4.	Choose File and then Save.
Switching between open files
Placing images
Five general rules for posters
Examples
Printing
26 artforscience.com
Formatting and layout of your Poster
Where does one start !?!
Posters are used to communicate information, therefore you should be thinking about what information you want
to communicate. A great poster is one that presents its information clearly, and succinctly. Think of your poster
as a talk, not as a paper. It should be ONE thought, ONE process, or ONE idea – NOT MANY!!! It should be as
simple as possible, with supporting images and short blocks of text that describe those images, most importantly...
all images must relate to your message and you should minimize the use of text to only the barest essentials! No
abstracts, no wordy titles, backgrounds/introductions, conclusions, and no long reference section.
Title, identity, and location
	
The title should sum up the entire poster in as few a words as possible. The title is generally centered but can also
be aligned left. It is usually in a 100 point, sans-serif, BOLD, font (Arial, Myriad, Verdana, etc.).
On the next line add your first name (do not use initials for your name, any additional first names can use initials),
last name, and the name(s) of any other major contributors to the work represented in the poster. The presenting
author's name is always first and the major professor's name is always last. This line is also usually centered and is
usually 75 pts.
Add the location of the presented work, including department(s), university affiliation(s), state, zip and country. This
line is also centered and is usually 55 pts.
Note: All of these fonts and sizes are adjustable, as is the vertical space (leading) between the lines of text. We are
giving you what we have found to work best over the years. Use whatever you feel is appropriate!
The abstract
Posters used to start with an abstract, but the abstract is just an outline of the information that is on the poster.
Therefore, there is no need to put a copy of the abstract on your poster, since your poster is the abstract! A better
idea would be to start your poster with an Introduction. One that includes enough background to allow the viewer of
your poster to understand the presented data. Also make sure you include the following information on your poster:
	 • why is the presented information important?
	 • how does the presented information further the current body of knowledge.
	 • a brief explanation of the methods.
	 • a succinct statement of the results, conclusions or summary.
	 • references, DO NOT leave off the references!
Remember: Posters should help you engage your colleagues in dialog while you are standing in front of it. They
should help you get your point across to as many people as possible.
artforscience.com 27
Creating a text box
NOTE: Adobe Illustrator allows you to import text
from any word processing program.
5.	Choose File, Place, then open the "introduction.
doc" file from the Sample folder you downloaded
earlier, and click OK.
	 In the Microsoft Word Option dialog box, accept
the text formatting by clicking the OK box.
Adobe Illustrator will then give you the icon shown
right. This icon lets you know that you have some
text waiting to be placed on the artboard.
6.	 Click and drag out a box as shown, right. Don't
worry about the size or exact placement of the text
box, you can move and resize it at anytime!
7.	 Click on the Artboard inside the upper left of the
box you just drew to place the text on your poster.
Your placed text will be tiny, we will fix that next.
8.	 Select all of the text in your text box.
9.	 In the Character palette change the font size
to 24 pts. This is the best presentation size for
general text on a poster.
	 Your text should now look like the example shown
below. The reason that this text is all crammed
together is because the leading (the space between
the lines of text) is set incorrectly for 24 point
type.
28 artforscience.com
In the Character Palette change the leading to
"Auto" from the leading pop-up menu.
Note: If you drew your text box too small to
hold all of the type you are importing,
Illustrator will display a small, red, boxed,
plus sign in the lower right of your text box
(as shown right).
Take the Selection tool (black arrow tool) and
click on the text box. You will see little
blue squares in the corners and in the
middle along the edges of the text box.
Clicking and dragging any one of these
little blue squares will re-size your text box.
Click and drag down the little blue square that
you see along the middle of the bottom
edge of your text box, until you can see all
of the text in your text box.
	
10.	 Highlight just the first line of the text with
the Text tool, "Introduction", and change
it to 36 pts in the Character Palette. This
the best size to use for headline text. down
the little blue square that you see along the
middle of the bottom edge of your text box,
until you can see all of the text in your text
box.
Bottom center
blue square
Pull
down
artforscience.com 29
	 Your poster should now look something like the example shown below.
Placing images
11.	Choose File, Open and then open figure 1.ai from the
Samples folder you downloaded earlier in the Open
dialog box.
12.	Choose Select, and then Select All.
13.	 Choose Edit, and then Copy.
14.	 Go to the Window menu and choose your poster file
from the list of open files at the bottom of the window
menu.
15.	Choose Edit, then Paste, and paste in figure 1. Then
select the Selection tool and move figure 1 below your
introduction.
30 artforscience.com
14.	 Using the text tool and drag out a text box
under the figure, so you can add a caption. Use
24 pt. font. Write a "dummy" caption of your
own (see sample right).
15.	Choose File and then Place. Open the sample
file called Rhodopsin.jpg. Drag this image so
it is to the right of the abstract. It will be the
start of our second column.
NOTE: Bitmap images placed into Illustrator for
a poster need to only be 180 dpi if they are
going to be used without any scaling. Just like
in the Illustrator to PowerPoint tutorial that
starts of on page 17, all images you create for
your poster should be created at the size you
are going to use them at in the poster. You may
use files with higher dpi but the extra dpi will
not be used by the poster printer and will only
slow it down. If you already have files scanned
at higher dpi for use in other documents don’t
bother resizing them down to 180 dpi unless
they are at dpi’s higher than 600.
16.	 Create a figure caption for the rhodopsin
molecule by Option - Dragging the figure 1
caption with the Selection tool, just like we
did in step number 12 on page 6 (see example
shown at right.)
artforscience.com 31
Idealized poster features
	 Let's take a moment to review the minimum features of poster, then we'll continue and learn how to add color.
Author Identification – Make sure you use your first and last name. This allows colleagues at the meeting to converse
with you on a first name basis. It is also a good idea to include your complete address, email and phone number
somewhere on the poster in case someone at the meeting would like to contact you.
Make your research objectives clear – Use large BOLD headings (36 pts.) that state the following: Introduction or
Background, Methods (or similar), Summary, Results or Conclusions, References, and Contact.
Traffic flow – When laying out your poster remember that you are trying facilitate the movement of people past your
poster. In general, present your poster in columns from left to right. This allows participants to read your poster and
move out of the way when the next participant starts to read your poster. Columns do not need to all be the same
size but in general, equally sized columns have a familiar symmetry.
Appearance – Make your poster pleasant to look at! There should be a pleasing use of text and graphics. It should not
be cluttered or sloppy! Make it easy for the participants to follow the information in your poster by using large
figure numbers. Make your poster text easy to read (24 pts.). Leave white space on all four sides and in between the
columns and title of your poster. This allows the reader to rest as they proceed through your poster.
Balance between graphics and text – Cut your text and title to the bare minimum. Repeat this mantra over and over
in your head, "SHORT AND SUCCINCT"! There should be enough text to explain the graphics, and just enough
graphics to clarify the text! Just because the symposium gives you a 4' x 4' poster, that doesn't mean you have to
use all of that space.
Layout – Use a black bar, fat line, or white space to separate the title, author, and location information from the rest of
the poster.
Color – Minimal use of color to separate the top from the bottom. Separate the introduction or Background from the
introduction, data, conclusion and references. Please use colors that are pleasing to the eye, and help emphasis your
data.
Highlight – Minimal use of color to highlight the conclusions.
Introduction
Conclusion(s)
Reference(s)
Methods
1
2
3
4
This is the title of my poster for this exercise
H. Adam Steinberg1
, Jean-Yves Sgro2
, Marchel Hill2
, and Ann C. Palmenberg1,2
1
Departments of Biochemistry and 2
Molecular Virology, University of Wisconsin, Madison, WI 53706 USA
32 artforscience.com
17.	 Using the Rectangle tool, click and drag a box out from the upper left corner of the poster – over
to the right edge of the poster – making sure you include all of the title, names, and the location
information in this box (see example below).
	NOTE: When you put the rectangle tool over the upper left corner, a green set of lines will
	 appear, and the word "intersect", in green, will appear. When you see this start your click and drag.
18.	 While that rectangle is still selected, Click on the Window menu
and choose Color (shown at right).
19.	 In the color palette that apprears, choose Show Options from the
flyout menu in the upper right of the palette. If the CMYK color
option does not show, go back into the fly out menu and choose
CMYK.
20.	 In the Color palette,
Change type 20(%) in the box labeled "C"
	 (C=cyan, M=magenta, Y=yellow, K=black).
artforscience.com 33
21.	 While that 20% Cyan title
rectangle is still selected,
go to the Object menu,
choose Arrange, then Send
to Back. This will place the
cyan title rectangle behind
your title text
22.	 Using the Direct selection tool, click on a blank place of the poster to deselect everything.
23.	 Using the Direct selection tool, click once on just the bottom line of the 20% Cyan title rectangle. This will
select just the bottom line of the rectangle.
24.	Choose Edit, then Copy.
25.	Choose Edit, then Paste in Front (shown right).
26.	 Change the fill to none and the
	 stroke to black (100% K) using
	the Color palette.
27.	 From the Window menu, choose Stroke to open
the stoke menu. Change the Stroke to 15 pts.
28.	 Again, using the Rectangle tool, click and drag a box out from the lower left corner of the 20% Cyan title
rectangle (you will see the green word "anchor" appear when you are in the correct location) – over to the
right edge of the first column of the poster – down to the bottom of the poster (you will see the green word
"page" appear when you reach the bottom).
29.	 In the Color palette, set the Fill of the rectangle to 30% Cyan and 30% Yellow.
30.	 Choose the Object menu, then Arrange, then Send to Back.
31.	 Remove the stroke by changing the Stroke to 0 pt or by setting the Fill to none with the red slash at the
bottom of the tool bar.
There is a sample of what your poster should look like at this point, on the next page.
You now have enough knowledge on using Adobe Illustrator to finish your poster. Add more images, captions and
text boxes for conclusions, references, etc.
NOTE: You will need to embed all of your image files before you print your poster on the poster printer. See page
36 for instructions on printing a poster.
Fill
None
Stroke
34 artforscience.com
artforscience.com 35
Some examples:
The (beige) Whole-genome comparison, poster at
the top of this page, is an example of a methods
poster. There are no conclusions. The information
is presented in three even columns but you can see
they added a two column figure to the bottom of
the second and third columns. This poster is heavy
on the text.
The next example on RANKL, is presented with
all the text on the left and the right and all the
figures in the middle. Though this is a visually
striking poster, it is lacking white space around the
edges and in between the columns, and the color is
a bit overwhelming.
The last example, DdrA protein, uses a three frame
approach to present the information. Color is used
to separate the title (black background), text (beige
background) and figures (light blue background).
All of the text is together, as are all of the figures.
Remember, it's your poster! It should reflect your
style and opinions so don't be afraid to adapt these
lessons to your taste.
36 artforscience.com
Printing
Once you have finished your poster you should print out a proof, show it to the following people, and weigh their
advice carefully: Yourself (your poster will look different when you see it on paper!), your PI, your lab mates, and
someone who doesn't understand the topic of the poster.
Embed your images before you submit your poster for printing.
1.	 From the Window menu in Adobe Illustrator choose Links
(shown right) to open the Links Palette (shown below).
Notice only "rhodopsin.jpg" in this example has the little
embedded image icon.
2.	 Highlight the images that are not embedded and from the
flyout menu in the upper right corner of the palette choose
Embed Image (as shown below).
Embed icon
artforscience.com 37
Print an 8 1/2" x 11" proof on any printer:
	Choose File, Print and then in the Print dialog box, make sure that under Scaling: Fit to Page is selected, then
click Print. Also make sure the Auto-Rotate box is checked in the middle of the dialog box.
38 artforscience.com
artforscience.com 39
Creating a poster in Microsoft PowerPoint
Note:
PowerPoint IS NOT a program for creating posters.
Posters created in PowerPoint:
	 Are limited to 56" in width by default.
	 They are not widely accepted at printshops that print posters. Many places require you to convert
them to PDF files first.
	 Have longer processing and printing times.
	 Tend to have problems when creating, editing and printing.
This tutorial builds on what was learned in the tutorials proceeding it. You will be referred back to them
in specific locations of this tutorial.
You will learn the following:
Setting up a poster file
Slide layout
Formatting palette
Drawing toolbar
Adding and formatting text
Inserting Microsoft Word files
Inserting pictures
Printing your poster
Setting up the poster file
1.	 Open Microsoft PowerPoint. From the
PowerPoint Presentation Gallery choose the
simple White theme (shown right).
2.	 From the Layout drop down menu under the
Home tab choose Blank slide (shown below).
40 artforscience.com
Setting up the poster board
3.	Choose File, then Page Setup
(as shown right).
4.	 In the Page setup dialog box, change the Width to 48" and
the Height to 43.5". Remember, one dimension must be 43.5"
(see page 25).
5.	 When you click OK PowerPoint will ask you if you want to
format your poster (which is just an oversized slide) to your
current printer's printable area. Click Fix.
Text box
6.	 From the format bar at the top of the poster
choose the Text Box tool and then click in the
middle top of the poster so you can add a title.
See the title box shown at the top and middle of
the next page for an example.
7.	 Type the title into the text box following the
guidelines on page 26. Again, see the title box
shown at the top and middle of the next page for
an example.
artforscience.com 41
8. If you click on the Home tab while the text box is selected, you will be presented with the formatting that focuses
on text (see example below).
9.	 Change the text to centered. Change the font sizes to match those on page 26. Change the font to Arial (or
similar) and click the Bold button (all of these are indicated below by the four downward pointing arrows).
10.	 To change the superscript numbers, that indicate association of person to local, click the superscript button
(indicated above by arrow pointing up on the left side). To change the leading (space between the lines of text)
you change the line spacing (indicated above by arrow pointing up on the right side).
11.	 Save the file with the year, your last name and the title of the meeting. This will help everyone keep track of
your poster when it comes time for reviewing, sharing and printing. i.e., year_lastname_meeting.pptx.
Inserting Microsoft Word files into your poster
12.	 Open Microsoft Word by clicking on it in the Dock.
13.	Choose File, then Open and open file Introduction1.doc from the sample folder you downloaded earlier.
14.	Choose Edit, then Select All and choose Edit, then Copy to copy the text to the clipboard.
15.	 Switch back to PowerPoint by clicking on it in the Dock.
16.	 Pick the Text Box tool (page 40, step 6) and then click and drag out a new text box for your introduction.
42 artforscience.com
17.	 In the new text box, change the text to Arial and the font size to 24
	 (page 47, step 9).
18.	Choose Edit, then Paste Special.
19.	 In the Paste special dialog box, choose Styled Text and then click OK.
NOTE: DO NOT copy and paste text between Word and PowerPoint, you will loose the formatting of the italic,
bold, and greek lettering! You must Paste Special it.
20.	 Click on the Text box editing handles and drag them to make
	the Text box longer and thinner. Move the Text box into place for the introduction.
21.	 Select and then change the word "Introduction" to 36 pts.
22.	Choose Insert, Photo, Picture from File and open rhodopsin.jpg from the samples folder you downloaded
earlier (see example shown on page 29, step 18).
artforscience.com 43
23.	 Click on the Text tool and drag out a text box for the rhodopsin figure legend. Format the font (Arial 24pts)
and make the "Figure 1" heading bold 36 pts.
24.	 Go to page 37 and quickly review the idealized poster features. Just like on pages 38 and 39, let's create a
colored box to go behind our title. From the Shape pull down menu in the format area choose the rectangle
shape and drag out a box that will start in the upper left of our poster and go down to the lower right side of
our title area.
25.	 From the Fill box choose More Colors... (as shown right)
26.	 From the Color palette that opens up,
choose CMYK colors and give the box a
20 % Cyan fill, click OK.
27.	 From the Line box choose No Line (as
shown right)
28.	 Add the green rectangle down the left
side of the poster to separate off the
Introduction (refer back to pages 33). Give
it a 20% Cyan, 20% Yellow fill with no
stroke, and then Arrange, Send to Back.
Fill box
Line box
44 artforscience.com
31.	 To create the black line that separates the title from the body of the poster (see example at the top of the next
page), choose the Shape tool, then Line. Then draw a line that follows right along the bottom of the blue box
behind the title (as shown right, and at the top of the next page).
32.	 From the Arrange menu, choose Bring to Front. To make
sure your line is on top of the boxes.
33.	 From the Line tool choose Weights, then More Lines (as
pointed out by the arrows right).
	 In the Format Shape dialog box that appears, change the Weight
of the line to 15 pts. Click OK.
Your poster should look similar to the one shown at the top of the next
page. You can now finish your poster by adding more images, captions
and text boxes for conclusions, references, etc.
artforscience.com 45
Printing
Once you have finished your poster you should print out a proof, show it to the following people, and weigh their
advice carefully: Yourself (your poster will look different when you see it on paper!), your PI, your lab mates, and
someone who doesn't understand the topic of the poster.
Print an 8 1/2" x 11" proof on any printer:
	Choose File, Print and then click on Scale to Fit Page, then Print (as shown below). If the preview on the left
in the Print dialog box doesn't fit the page, click Page Setup and choose your printer from the printer list.
46 artforscience.com
Converting a PowerPoint talk to a PowerPoint poster
You will learn the following:
Working with Slide masters
Viewing two PowerPoint files at the same time
Copying and pasting between a PowerPoint talk and a poster
This tutorial builds on what was learned in the tutorials proceeding it.
You will be referred back to them in specific locations of this tutorial.
Create the poster file
1.	 Please follow steps 1-11 on pages 39-41. This will properly create your poster file and poster title.
2. 	 Choose File, then Open, and open the file talk.ppt from the sample folder you downloaded earlier.
3	 From the View menu choose Master,
	then Slide Master (as shown right).
5.	 Click on the "Master title style" and
note the font, font size, and font style
(bold, italic, etc.). In our example it's
Arial and 32 pts. Then click on the 1st
bullet line of text and do the same (Arial
22 pt). Continue this with each line of
bullet text.
6.	Choose Window from the menus at the
top of the screen and then pick your
poster file from the list of open files
you'll see there.
7.	 In the poster file choose View, then
Master, Slide Master (as shown above
right).
8.	 Select all of the text in the Master title
style and change it to whatever it was in
the talk.ppt file. In our example that was
Arial 32 pts. Select the text of the first
bullet text and do the same. Proceed
through each of the other bullet text
strings in the slide master until the Slide
master of the talk and the Slide master of
the poster are the same (see examples at
right).
Poster Slide Master before...
Poster Slide Master after...
artforscience.com 47
9.	 While still in the poster file choose View, then Normal (as shown
right).
10.	Choose Window, Arrange All.
11.	 Click on the talk file window (shown on the right side below) and choose View, then Normal. If your slide is
too big change the size by sliding the scale bar in the lower right of the slide window (see arrow below).
12.	 In the talk file, Slide one, Select All and Copy. Click on the poster file and Paste.
13.	 Switch back to the talk file by clicking on it, and go to slide two. Select All and Copy. Click on to the poster
file and Paste. Repeat for all slides in the talk (six in our example).
14.	 Once you have moved all of your slides over to the poster file, close the talk file. Make the poster file full
screen by clicking on the little green dot in the upper left corner of the window. Complete your poster using the
information on pages 41 step 12 through page 45.
NOTE: Little things may change when you copy from one file to the other. Remember to go in and check all the
details!

Scientific Poster Making Using Adobe Illustrator -hmftj

  • 1.
    Scientific Poster Presentation Creating a scientificposter in Adobe Illustrator or Microsoft PowerPoint UNIVERSITY OF WISCONSIN–MADISON Eye Research Institute McPherson and art Provided by forscience.com Hands-on instruction
  • 2.
    116 artforscience.com Files requireto complete this tutorial Can be downloaded at the following URL: artforscience.com/artforscience/Tutorials_files/samples_folder.zip Poster templates for both Adobe Illustrator and Microsoft PowerPoint Can be downloaded at the following URL: artforscience.com/artforscience/Tutorials_files/templates.zip
  • 3.
    artforscience.com 1 Creating ascientific poster This tutorial will teach you the basics that will help you create an effective scientific poster in either Adobe Illustrator and/or Microsoft PowerPoint. It will teach you how to use two hands at the same time to control both the keyboard and the mouse, essential shortcuts, special function keys, and other items that are listed below. In this tutorial you will learn the following: Basic Adobe Illustrator.................................................................................................3 Open, Place, Zoom, Text, Shift-Option, Arrow keys, Selection tools, Rectangles, Fill & Stroke Adobe Illustrator - Graphing.........................................................................................9 Complex Selections, Option Double-Click, Shift Arrow Keys Vector vs. Bitmap........................................................................................................14 Two very different kinds of image file formats Images from PDF files.................................................................................................15 There are two different kinds of PDFs, image PDF verses vector PDF Correctly inserting images into Microsoft PowerPoint............................................17 Converting vector to image format, correctly setting dpi and sizes Creating a poster in Adobe Illustrator.......................................................................25 Poster size artboard, Formatting, Font sizes, Layout, Text boxes, Leading, Placing images, Rectangles, Adding color to fills, Strokes Minimum rules for poster layout and presenting poster information....................31 Author identity, Headings, Traffic flow, Appearances, Balance between images and text, Layout, Basic coloring, highlighting Poster examples..........................................................................................................35 Three sample posters with comments Printing your poster....................................................................................................36 Scaling when printing Creating a poster in Microsoft PowerPoint...............................................................39 Poster size artboard, Formatting, Font sizes, Layout, Text boxes, Leading, Placing images, Rectangles, Adding color to fills, Strokes Converting a PowerPoint talk to a PowerPoint poster............................................46 Slide Masters, Arranging multiple Windows This tutorial was created by: H. Adam Steinberg Artist/Scientist Web site: artforscience.com Email: adam @ artforscience.com Phone: 608/729-5944
  • 4.
  • 5.
    artforscience.com 3 Basic AdobeIllustrator You will learn the following: Open a new document Placing images or text Zoom tool and View menu Character palette Paragraph palette Text tool Opening a new document 1. Open Adobe Illustrator on the Mac from the Dock. 2. Choose New from the File menu (shown at right). You will be presented with the New Document dialog box that is shown at the right. Under the Profile: drop down menu, choose Print for files that will be used for journal illustrations and posters, choose Basic RGB for files that will be used in presentations. Under Size choose Letter. Illustrations for journal figures and presentations are created at letter size, for posters, type in the Width and Height of your poster into the size boxes. 3. Click OK. Place command 4. From the File menu choose Place. NOTE: Use the Place command to insert text (from Microsoft Word), or Bitmap images, such as TIF, JPEG, GIF, PSD, EPS, etc., directly into Adobe Illustrator. Do not use the Place command to insert Vector image files such as AI, SVG, EPS, PDF, and TXT (ASCII or binary) that are created by programs such as Adobe Illustrator, Macromedia Freehand, Deneba Canvas, CorelDraw, or from "Print to File" or "print to PDF" commands. Simply choose Open from the File menu for Vector illustrations and images. See page 14 to learn more about the differences between Bitmap images and Vector illustrations and images. 5. In the directory window that opens from the Place command, choose the file ARGs1.tif from the samples folder you downloaded earlier. Constrain and copy shortcuts Transform and Duplication Moving objects with the Arrow keys Black vs. White selection tools Marquee tool Fill and Stroke
  • 6.
    4 artforscience.com Zoom tooland View Menu 6. Click on the zoom tool (shown on the right). The zoom tool works in three different ways: 1). You can click on an image and zoom in. 2). You can hold down the option or alt key and click to zoom out. Notice when you do this the plus sign in the middle of the magnifying lens turns to a minus sign (to show you zoom out). 3). You can click and hold down the mouse button on an item and it will zoom into exactly that space. Take minute or two and try all three zoom options listed above. You can also Zoom in an out of an Illustrator window by using the options in the View menu (shown below left). Try Zoom In, Zoom Out, Fit in Window, and Actual Size from the View menu. When you are finished, choose Actual Size from the View Menu and then click and hold the zoom tool over the placed ARG until it nearly fills the screen (as shown in the example at right). Click and hold zoom tool over ARG
  • 7.
    artforscience.com 5 Basic labelingwith Adobe Illustrator Character palette 7. From the Window menu, choose Type, then Character (image right). The Character Palette will open. NOTE: If the Character palette is already open, the word Character will have a check mark next to its name in the window menu. If this is the case, you only need to find the palette on your desktop. Click on the fly out menu (set of four bars in the upper right corner of the palette) and choose Show Options. Also notice the options for Superscript and Subscript hidden here! You will use these later in your example poster title. Paragraph palette 8. From the Window menu choose Type and then Paragraph (image right). The Paragraph Palette will open. Click on the fly out menu (set of four bars in the upper right corner of the palette) and choose Show Options. Fly out menu Fly out menu
  • 8.
    6 artforscience.com Type tool 9. Click on the Type tool (shown left). 10. Click (DO NOT DRAG) the Type tool right above the middle of the first lane of the ARG (as shown right). Type the capital letter “X”. Select (block) the letter “X” (again as shown right). Change the “X” to center text by clicking on the Align center image in the paragraph palette you opened in the last step. Constrain and copy shortcuts 11. Click on the white arrow tool, the Direct Selection tool (shown left). 12. Click on the letter “X”, and then with your left thumb and fore finger, hold down the shift and the option (or alt) keys on the left side of the keyboard while you drag the “X” to the right with the mouse, placing it over the second lane of the ARG. You must let go of the mouse button first and then the shift and option or alt keys second. Notice that the cursor changes to two triangles, one black and one white (as shown above right) whenever you hold down the option or alt key and drag an object with the white arrow tool. This is Illustrator's way of telling you that it is duplicating the object. You hold the option or alt key and drag to duplicate the object. You hold down the shift key to constrain the movement of the cursor to a perfectly horizontal line. Holding down the shift key will constrain the movement of the cursor up, down, left, right and also to 45 degrees in any direction. This "constraining" shortcut is adjustable in the preference panel and works in all Adobe and Microsoft programs since it is a function of the operating system. Transform and Duplication 13. Choose Object–Transform–Transform Again – four times (or you could hold down the Command key and hit the D key, which is the shortcut for this action, circled below). Align center Center
  • 9.
    artforscience.com 7 Theletter X will move to the right and duplicate itself four times! By duplicating your text this way you will get the same size and style font for all of your text. You may notice that you didn't exactly duplicate the text over the second lane of the ARG when you option (or alt) dragged it, so when you duplicated the text three more times it didn't exactly line up with the other lanes of the gel. In the next step we will fix the alignment! Move objects via the Arrow keys 14. Take the Direct Selection tool (white arrow tool) and click on one of the misaligned “X's” to select it. Notice that clicking the arrow keys moves the object that is selected a small distance to the left or the right. If you hold down the shift key and then click on the arrow keys on the keyboard the text will move ten times as far, try it. Use the arrow keys on the keyboard to get your “X's” in visual alignment with the lanes of the ARG. This arrow movement distance is adjustable in the preference panel and works in all Adobe and Microsoft programs. 15. With the type tool change the “X's" to “1", “2", “3", though "6". Black vs. White selection tools 16. With the Direct Selection tool (white arrow tool) drag a box over all the lane numbers EXACTLY as you see below. NOTE: Do not include any of the ARG image below the numbers. NOTE: all of the numbers will be selected. The Direct Selection tool selects parts of objects in three different ways. 1). If you click on any part of an object, that part will be selected. 2). If you option (or alt) click on any part of an object the entire object will be selected. 3). If you drag a box over any part(s) of an object that/those part(s) will be selected. The Selection tool (black arrow tool), selects whole objects in the same way. The Selection tool (black arrow tool) will also allow you to rotate and scale selections while the Direct Selection tool will not. Drag
  • 10.
    8 artforscience.com 17. Whileyou have all of the numbers selected, click and drag on one of them, dragging them to the bottom of the ARG lanes while you hold the option and the shift keys (duplicating and constraining them). 18. Label the top of the ARG with percentage points. Change the top "1" to "MW", the top "2" to "0", the "3" to "25", the"4" to "50", the "5" to "75" and the "6" to "100" Rectangle tool 19. Click on the Rectangle tool (shown left). 20. Drag a box from between the "MW" lane and the “0” lane to the right of the "100" lane. (Follow the image shown right.) Fill and Stroke 21. Change the black fill to none by clicking on the Fill box, then by clicking on the small box with the red slash through it (labeled None right) located below the Fill and Stroke boxes. Change the stroke to black by clicking on the Stroke box and then by clicking on the small Color box below it (see example at right). 22. Click the Direct selection tool and then click on a blank area of the desktop to deselect the box you just drew. 23. Click once on the bottom line of the box (this will select just the bottom part of the line) and click the delete key on the keyboard. 24. With the Direct selection tool click on the "50". 25. Move the "50" up above the box while holding down the shift and option key to constrain and duplicate it. 26. Change the "50" to the word "percent". 27. In the View menu, choose Fit in Window. Fill Stroke NoneColor Drag Drag
  • 11.
    artforscience.com 9 Basic graphingwith Adobe Illustrator 28. Click on the Graph tool in the toolbox (shown on right, lower down). Notice that some of the tools in the toolbox have a tiny black triangle in the lower right corner (shown right higher up). Tools with this triangle are called nested tools. If you click and hold down on one of these tools it will expand out and show you all of the options for that tool. Expand out the Graph tool and choose the Scatter Graph tool. 29. Drag a big square graph box (like the example below) with the Graph tool above the labeled ARG from "0" to "100" percent. Notice that a data entry window will automatically open. 30. Adobe Illustrator requires you enter data with the Y values in the first column and the X values in the second column, etc. Enter the following data in column 1: 90, 0, 70, 80, 30 and the following data in column 2: 1, 2, 3, 4, 5. Then click on the check mark in the upper right of the data window to apply the data to the graph. Close the data entry window by clicking the red dot in the upper left corner. Y X Y X Y X Drag Data entry window Graph tool Black triangle
  • 12.
    10 artforscience.com 31. Noticethat the fonts on the graph are too small and the X and Y tick marks are inside the graph area. Using the Direct selection tool drag a selection box over the entire graph. 32. In the Character palette change the type to 12 points. Notice that if you click on the "TT" in the Character palette that Illustrator will select the information in the TT box for you, making it easier to enter text. All Adobe palettes work this way. 33. Using the Direct selection tool click on a blank part of the illustration to deselect everything. Drag a selection box over the Y axis numbers, just as it is pictured below (left). Do not allow any of the dotted selection box to touch any part of the graph! Arrow the Y axis values left with the keyboard arrow keys or the Shift + Arrow keys. Drag Drag
  • 13.
    artforscience.com 11 34. Dothe same thing for the X axis. Notice that the selection box does not touch any part of the graph. 35. Using the Direct selection tool, option double-click on the Y axis tick marks, this will select all of them as a group. Arrow them left with the keyboard arrows or the Shift + Arrow keys. 36. Do the same for the X value tick marks. Drag
  • 14.
    12 artforscience.com When youare finished, your labeled ARG should look similar to this one.
  • 15.
  • 16.
    14 artforscience.com There aretwo kinds of Images – Vector & Bitmap Take a few minutes to review the following two types of images that can be made into PDF files. Make sure to read all listed details about them. You will learn more about the difference between these two types of images in the next section, Getting Images from PDF files. Vector (Postscript) • Computer files that are created from lines, fills and text • Written in postscript language (PDFs are postscript) • Files created by Adobe Illustrator, Deneba Canvas, CorelDraw, ClarisWorks, etc. • Can be scaled up to any dimension and still look good • Sometimes the files are large, usually have poor compression • May contain Bitmap information (below) • File formats: AI, SVG, PS, EPS, PDF, and TXT (may be ASCII or binary) Bitmap • Scanned images • Files created in Adobe Photoshop, Adobe Elements, CorelDraw, etc. • Made of pixels that represent an image • Pixels are always shades of gray • Color images are layered grayscale files Three grayscale layers (channels) in a RGB file Four grayscale layers (channels) in a CMYK file • Bitmap files are resolution (dpi or ppi) specific • Should not be scaled up, pixels may become visible • Can be scaled down via interpolation but resampling will occur • Generally do not contain vector information (PDS, Photoshop native files may contain vector information), may be saved as postscript files • Some Bitmap images can be heavily compressed • File formats are: PS, EPS, PDF, TXT, TIFF, BMP, PCX, and PICT • Web file formats are: JPEG, JPEG2000, GIF, PNG Pixels Vector art shown as wireframe Vector art
  • 17.
    artforscience.com 15 Getting Imagesfrom PDF files You will learn the following: Understanding that images in PDF files can be either vector or Bitmap illustrations Opening PDF files PDFs are a universal text and image file format that works on any computer platform: Windows, Macintosh, Linux, etc. They are small files and may contain either vector, or Bitmap images, or both. They can be opened in Adobe Acrobat (the full version), Adobe Acrobat reader (limited FREE version), and all Adobe programs including Illustrator and Photoshop. PDF files can be created from any program on any computer platform with the full version of Adobe Acrobat installed or from the print dialog box. 1. Open the Adobe Illustrator program. Choose File Open and choose sample 1.pdf from Samples folder you downloaded in the open dialog box. 2. When you open a PDF in an Adobe program NOTE, it will only allow you to edit one page at a time. Pick page 2 in the Open PDF dialog box (see image right). When you open that PDF you will get a Illustrator PDF Warning dialog box, noting that the Helvetica font is missing. Click OK and proceed to the next step. 3. Once the file opens, choose Select All.
  • 18.
    16 artforscience.com There aretwo ways that one can save vector images into a PDF file. Notice in the top image below (sample 1.pdf), that the image parts are all in one box. This vector image was converted to a Bitmap image when it was saved as a PDF file. You could open this PDF file in Adobe Photoshop and crop the Bitmap image out to use it in a poster or PPT talk, however the image will be this current resolution and may result in a poor quality print. 4. Choose File Open and choose sample 2.pdf from the directory window. Pick page 2 in the Open PDF dialog box. Choose Select All. Notice that the vector image parts are all highlighted and can be edited in this PDF file (shown below at the bottom of the page). This vector image was retained as vector art in the PDF file. You can resize and resave this image to use in a Poster or PPT talk to any resolution. This illustration is resolution independent. Bitmap image Vector image
  • 19.
    artforscience.com 17 Images intoPowerPoint You will learn the following: Correct image file formats for PowerPoint talks and posters How to create PNG files from Adobe Illustrator files Notes • All portable and fixed projectors for presentations are based on a screen resolution of 72 dpi, therefore all image files inserted into a PowerPoint slide should be 72 dpi, or for even better looking presentations, double that amount (150 dpi). They should not however, be 300 or 600 dpi! • Though all poster printers can print posters at various higher resolutions, for efficiency of speed, print shops generally print at 180 dpi. Therefore, all image files inserted into a poster should be 180 dpi, or for even better looking posters, approximately double that amount (300 dpi). They should not however, be 600 or 1200 dpi! • The PNG file format works best, but other file formats will also work but may cause problems when switching between operating systems. • For best results, PNG files should be 200% the final size you want, and then scaled to 50% in PowerPoint. • All slides in a PowerPoint Presentation are 7.5” high and 10” wide, for 1024 projectors. • When making a slide one should leave space for a title and a comfortable margin for the eye to rest in on all four sides. Therefore, 6” x 9”, or less, is generally the maximum area for images on PowerPoint slides. The PNG file format Microsoft Office reccomends using the PNG file format for all images inserted into it's Office products. In this section you will learn how to properly create PNG files from Adobe Illustrator vector files.
  • 20.
    18 artforscience.com Creating PNGfiles 1. Open Microsoft PowerPoint. From the PowerPoint Presentation Gallery choose the simple White theme. 2. From the Layout drop down menu under the Home tab, choose Title Only slide. 3. From the Shape pull out menu Choose Rectangles and then choose the first rectangle in the upper left.
  • 21.
    artforscience.com 19 4. Drawa box (for this exercise draw it as it is shown below) to the approximate size and shape you want your inserted image to be. 5. Double click on the box and the Format Shape options will open at the top of the page. In the size boxes, change both the width and height to 4".
  • 22.
    20 artforscience.com 6. OpenAdobe Illustrator. Choose Open from the File menu and then choose sample 2.pdf from the samples folder you downloaded earlier. Open page 2. (See page 15, steps 1 and 2.) 7. Using the Direct selection tool click and drag a selection box over “section D”. NOTE: Drag the selection box as close as possible to the example shown right! 8. Copy and paste the image into a new file by choosing Edit, then Copy. File, then New. Edit, then Paste. Your image should look something like the example below. 9. Delete the extra lines around the figure, and also the letter D and E (if you have them), by clicking on them with the direct selection tool. First, click on the white space around the figure to deselect everything, then click on a line or a letter and hit the delete key. If you are deleting a line you need to hit the delete key twice, once to delete the line and once to delete the endpoints of the line. NOTE: You may have created stray points making the above deletions. Stray points are the endpoints of lines or text anchors that do not contain lines or text. Zoom out to full screen by choosing Actual Size from the View menu. Choose Select, then All. Notice if there are any blue highlighted dots around the figure. To remove these stray points, you must deselect (click on the white space around the figure to deselect everything), then choose Select, then Object, then Stray Points (as shown right) and then hit the delete key.
  • 23.
    artforscience.com 21 10. Fromthe Select menu choose All. 11. From the Window menu choose Transform and the Transform palette will open (remember, if the transform palette is already open it will have a check mark next to it's name in the menu). Make sure the "Constrain Width and Height Proportions marker" is on. 12. Click on the flyout menu in the upper right of the transform palette and from the fly out menu choose "Scale Strokes and Effects". NOTE: If you turn on Show Options in the flyout menu you will get the Scale Strokes & Effects checkbox in the Transform palette as shown by the red arrow at the right. 13. The Transform palette allows one to move, resize, rotate and skew images on the artboard in Adobe Illustrator. In the “W:” box type twice the width, OR in the “H:” box type twice the height you noted for the size of the box you drew in PowerPoint (see NOTE below about units) and then hit the return or enter key. NOTE: The default ruler units for Adobe Illustrator is Picas (p) and Points (pt), a standard unit of measure in the publishing world. You can change the ruler units to a more familiar standard (inches) or metric (centimeters) in the Preferences, Units (as shown right). Or... you can just leave them as pts. and type the unit symbol in any of the dialog boxes, “in” for inches, “cm” for centimeters, “mm” for millimeters, “px” for pixels, etc. Illustrator is programmed to figure out what you mean! The box I drew in PowerPoint was 4” x 4” so I entered 8” (8 in) in the W: field. Constrain marker
  • 24.
    22 artforscience.com 14. Nextwe will take the image into PowerPoint. From the File menu choose Export... The Export dialog box will open (as shown below). 15. Name your file in the Save As: box, choose Desktop for the file location on the left side, and choose Format: PNG (png) from the dropdown menu at the bottom of the dialog box.
  • 25.
    artforscience.com 23 16. APNG Options dialog box will open. Choose Resolution: Medium (72ppi) and click OK. NOTE: Transparent is choosen as a default. This will allow you to place your PNG file over a colored background and have that background show through. 17. Switch back to Microsoft PowerPoint. 18. From the Insert menu choose Photo, then Picture From file. Choose the file you just saved from Illustrator in the directory window that comes up.
  • 26.
    24 artforscience.com 19. Inthe Size boxes at the top change the width of your image to 4.01". NOTE: We always want to pick 50%... not 48%, not 53% or any other percent! The reason we pick EXACTLY 50% is because the screen is 72 ppi (pixels/inch) and the file we just exported from Adobe Illustrator is 150 ppi. By choosing exactly 50% we are perfectly aligning the image pixels with the screen pixels. In a pinch it is fine to choose a percent slightly to one side or the other of 50% but the image quality will be slightly degraded. The further you deviate from 50% the more the image quality will degrade. 20. Move the inserted picture over the blue box we drew earlier. 21. Click on the blue box and then hit the Delete key. You now have a perfectly sized image on your slide. Choose view Slide Show from one of the three locations shown below and look at your image on screen. Yes, you could have transformed the size of your image to 4" and exported it as a 150 dpi PNG file. But, I needed you to understand how the Transform palette works, and also how the pixel resolution of the image relates to the pixel resolution of the screen...
  • 27.
    artforscience.com 25 Creating aposter using Adobe Illustrator You will learn the following: Setting up a poster file Changing the Unit preferences Formatting and layout of a poster Titles, identity and location The abstract Text boxes and leading Setting up the poster file NOTE: Before you try to create a poster, please complete the basic Adobe Illustrator tutorial starting on page 3. 1. Open Adobe Illustrator. 2. Choose File–New. You will be presented with a New Document dialog box. In the Name field it is a good idea to name your poster in the following format: Year_ Lastname_Meeting.ai. This will help you and everyone else keep track of your poster during reviewing, sharing and printing. Under the Color Mode drop down menu at the bottom, make sure it says: CMYK when creating a poster. Under Size type the Width and Height of your poster in the dialog boxes. Since the maximum paper size the poster printer can print is 44”, keep either the width OR the height to a maximum of 43.5”, the other dimension can be up to 227.54” (19’). Click OK. NOTE: All meetings specify what size your poster should be, please check the web site of your particular meeting. Common sizes are 24" x 36", 48" x 48", 48" x 60" and 48" x 72". 3. Choose View, then Fit in window. 4. Choose File and then Save. Switching between open files Placing images Five general rules for posters Examples Printing
  • 28.
    26 artforscience.com Formatting andlayout of your Poster Where does one start !?! Posters are used to communicate information, therefore you should be thinking about what information you want to communicate. A great poster is one that presents its information clearly, and succinctly. Think of your poster as a talk, not as a paper. It should be ONE thought, ONE process, or ONE idea – NOT MANY!!! It should be as simple as possible, with supporting images and short blocks of text that describe those images, most importantly... all images must relate to your message and you should minimize the use of text to only the barest essentials! No abstracts, no wordy titles, backgrounds/introductions, conclusions, and no long reference section. Title, identity, and location The title should sum up the entire poster in as few a words as possible. The title is generally centered but can also be aligned left. It is usually in a 100 point, sans-serif, BOLD, font (Arial, Myriad, Verdana, etc.). On the next line add your first name (do not use initials for your name, any additional first names can use initials), last name, and the name(s) of any other major contributors to the work represented in the poster. The presenting author's name is always first and the major professor's name is always last. This line is also usually centered and is usually 75 pts. Add the location of the presented work, including department(s), university affiliation(s), state, zip and country. This line is also centered and is usually 55 pts. Note: All of these fonts and sizes are adjustable, as is the vertical space (leading) between the lines of text. We are giving you what we have found to work best over the years. Use whatever you feel is appropriate! The abstract Posters used to start with an abstract, but the abstract is just an outline of the information that is on the poster. Therefore, there is no need to put a copy of the abstract on your poster, since your poster is the abstract! A better idea would be to start your poster with an Introduction. One that includes enough background to allow the viewer of your poster to understand the presented data. Also make sure you include the following information on your poster: • why is the presented information important? • how does the presented information further the current body of knowledge. • a brief explanation of the methods. • a succinct statement of the results, conclusions or summary. • references, DO NOT leave off the references! Remember: Posters should help you engage your colleagues in dialog while you are standing in front of it. They should help you get your point across to as many people as possible.
  • 29.
    artforscience.com 27 Creating atext box NOTE: Adobe Illustrator allows you to import text from any word processing program. 5. Choose File, Place, then open the "introduction. doc" file from the Sample folder you downloaded earlier, and click OK. In the Microsoft Word Option dialog box, accept the text formatting by clicking the OK box. Adobe Illustrator will then give you the icon shown right. This icon lets you know that you have some text waiting to be placed on the artboard. 6. Click and drag out a box as shown, right. Don't worry about the size or exact placement of the text box, you can move and resize it at anytime! 7. Click on the Artboard inside the upper left of the box you just drew to place the text on your poster. Your placed text will be tiny, we will fix that next. 8. Select all of the text in your text box. 9. In the Character palette change the font size to 24 pts. This is the best presentation size for general text on a poster. Your text should now look like the example shown below. The reason that this text is all crammed together is because the leading (the space between the lines of text) is set incorrectly for 24 point type.
  • 30.
    28 artforscience.com In theCharacter Palette change the leading to "Auto" from the leading pop-up menu. Note: If you drew your text box too small to hold all of the type you are importing, Illustrator will display a small, red, boxed, plus sign in the lower right of your text box (as shown right). Take the Selection tool (black arrow tool) and click on the text box. You will see little blue squares in the corners and in the middle along the edges of the text box. Clicking and dragging any one of these little blue squares will re-size your text box. Click and drag down the little blue square that you see along the middle of the bottom edge of your text box, until you can see all of the text in your text box. 10. Highlight just the first line of the text with the Text tool, "Introduction", and change it to 36 pts in the Character Palette. This the best size to use for headline text. down the little blue square that you see along the middle of the bottom edge of your text box, until you can see all of the text in your text box. Bottom center blue square Pull down
  • 31.
    artforscience.com 29 Yourposter should now look something like the example shown below. Placing images 11. Choose File, Open and then open figure 1.ai from the Samples folder you downloaded earlier in the Open dialog box. 12. Choose Select, and then Select All. 13. Choose Edit, and then Copy. 14. Go to the Window menu and choose your poster file from the list of open files at the bottom of the window menu. 15. Choose Edit, then Paste, and paste in figure 1. Then select the Selection tool and move figure 1 below your introduction.
  • 32.
    30 artforscience.com 14. Usingthe text tool and drag out a text box under the figure, so you can add a caption. Use 24 pt. font. Write a "dummy" caption of your own (see sample right). 15. Choose File and then Place. Open the sample file called Rhodopsin.jpg. Drag this image so it is to the right of the abstract. It will be the start of our second column. NOTE: Bitmap images placed into Illustrator for a poster need to only be 180 dpi if they are going to be used without any scaling. Just like in the Illustrator to PowerPoint tutorial that starts of on page 17, all images you create for your poster should be created at the size you are going to use them at in the poster. You may use files with higher dpi but the extra dpi will not be used by the poster printer and will only slow it down. If you already have files scanned at higher dpi for use in other documents don’t bother resizing them down to 180 dpi unless they are at dpi’s higher than 600. 16. Create a figure caption for the rhodopsin molecule by Option - Dragging the figure 1 caption with the Selection tool, just like we did in step number 12 on page 6 (see example shown at right.)
  • 33.
    artforscience.com 31 Idealized posterfeatures Let's take a moment to review the minimum features of poster, then we'll continue and learn how to add color. Author Identification – Make sure you use your first and last name. This allows colleagues at the meeting to converse with you on a first name basis. It is also a good idea to include your complete address, email and phone number somewhere on the poster in case someone at the meeting would like to contact you. Make your research objectives clear – Use large BOLD headings (36 pts.) that state the following: Introduction or Background, Methods (or similar), Summary, Results or Conclusions, References, and Contact. Traffic flow – When laying out your poster remember that you are trying facilitate the movement of people past your poster. In general, present your poster in columns from left to right. This allows participants to read your poster and move out of the way when the next participant starts to read your poster. Columns do not need to all be the same size but in general, equally sized columns have a familiar symmetry. Appearance – Make your poster pleasant to look at! There should be a pleasing use of text and graphics. It should not be cluttered or sloppy! Make it easy for the participants to follow the information in your poster by using large figure numbers. Make your poster text easy to read (24 pts.). Leave white space on all four sides and in between the columns and title of your poster. This allows the reader to rest as they proceed through your poster. Balance between graphics and text – Cut your text and title to the bare minimum. Repeat this mantra over and over in your head, "SHORT AND SUCCINCT"! There should be enough text to explain the graphics, and just enough graphics to clarify the text! Just because the symposium gives you a 4' x 4' poster, that doesn't mean you have to use all of that space. Layout – Use a black bar, fat line, or white space to separate the title, author, and location information from the rest of the poster. Color – Minimal use of color to separate the top from the bottom. Separate the introduction or Background from the introduction, data, conclusion and references. Please use colors that are pleasing to the eye, and help emphasis your data. Highlight – Minimal use of color to highlight the conclusions. Introduction Conclusion(s) Reference(s) Methods 1 2 3 4 This is the title of my poster for this exercise H. Adam Steinberg1 , Jean-Yves Sgro2 , Marchel Hill2 , and Ann C. Palmenberg1,2 1 Departments of Biochemistry and 2 Molecular Virology, University of Wisconsin, Madison, WI 53706 USA
  • 34.
    32 artforscience.com 17. Usingthe Rectangle tool, click and drag a box out from the upper left corner of the poster – over to the right edge of the poster – making sure you include all of the title, names, and the location information in this box (see example below). NOTE: When you put the rectangle tool over the upper left corner, a green set of lines will appear, and the word "intersect", in green, will appear. When you see this start your click and drag. 18. While that rectangle is still selected, Click on the Window menu and choose Color (shown at right). 19. In the color palette that apprears, choose Show Options from the flyout menu in the upper right of the palette. If the CMYK color option does not show, go back into the fly out menu and choose CMYK. 20. In the Color palette, Change type 20(%) in the box labeled "C" (C=cyan, M=magenta, Y=yellow, K=black).
  • 35.
    artforscience.com 33 21. Whilethat 20% Cyan title rectangle is still selected, go to the Object menu, choose Arrange, then Send to Back. This will place the cyan title rectangle behind your title text 22. Using the Direct selection tool, click on a blank place of the poster to deselect everything. 23. Using the Direct selection tool, click once on just the bottom line of the 20% Cyan title rectangle. This will select just the bottom line of the rectangle. 24. Choose Edit, then Copy. 25. Choose Edit, then Paste in Front (shown right). 26. Change the fill to none and the stroke to black (100% K) using the Color palette. 27. From the Window menu, choose Stroke to open the stoke menu. Change the Stroke to 15 pts. 28. Again, using the Rectangle tool, click and drag a box out from the lower left corner of the 20% Cyan title rectangle (you will see the green word "anchor" appear when you are in the correct location) – over to the right edge of the first column of the poster – down to the bottom of the poster (you will see the green word "page" appear when you reach the bottom). 29. In the Color palette, set the Fill of the rectangle to 30% Cyan and 30% Yellow. 30. Choose the Object menu, then Arrange, then Send to Back. 31. Remove the stroke by changing the Stroke to 0 pt or by setting the Fill to none with the red slash at the bottom of the tool bar. There is a sample of what your poster should look like at this point, on the next page. You now have enough knowledge on using Adobe Illustrator to finish your poster. Add more images, captions and text boxes for conclusions, references, etc. NOTE: You will need to embed all of your image files before you print your poster on the poster printer. See page 36 for instructions on printing a poster. Fill None Stroke
  • 36.
  • 37.
    artforscience.com 35 Some examples: The(beige) Whole-genome comparison, poster at the top of this page, is an example of a methods poster. There are no conclusions. The information is presented in three even columns but you can see they added a two column figure to the bottom of the second and third columns. This poster is heavy on the text. The next example on RANKL, is presented with all the text on the left and the right and all the figures in the middle. Though this is a visually striking poster, it is lacking white space around the edges and in between the columns, and the color is a bit overwhelming. The last example, DdrA protein, uses a three frame approach to present the information. Color is used to separate the title (black background), text (beige background) and figures (light blue background). All of the text is together, as are all of the figures. Remember, it's your poster! It should reflect your style and opinions so don't be afraid to adapt these lessons to your taste.
  • 38.
    36 artforscience.com Printing Once youhave finished your poster you should print out a proof, show it to the following people, and weigh their advice carefully: Yourself (your poster will look different when you see it on paper!), your PI, your lab mates, and someone who doesn't understand the topic of the poster. Embed your images before you submit your poster for printing. 1. From the Window menu in Adobe Illustrator choose Links (shown right) to open the Links Palette (shown below). Notice only "rhodopsin.jpg" in this example has the little embedded image icon. 2. Highlight the images that are not embedded and from the flyout menu in the upper right corner of the palette choose Embed Image (as shown below). Embed icon
  • 39.
    artforscience.com 37 Print an8 1/2" x 11" proof on any printer: Choose File, Print and then in the Print dialog box, make sure that under Scaling: Fit to Page is selected, then click Print. Also make sure the Auto-Rotate box is checked in the middle of the dialog box.
  • 40.
  • 41.
    artforscience.com 39 Creating aposter in Microsoft PowerPoint Note: PowerPoint IS NOT a program for creating posters. Posters created in PowerPoint: Are limited to 56" in width by default. They are not widely accepted at printshops that print posters. Many places require you to convert them to PDF files first. Have longer processing and printing times. Tend to have problems when creating, editing and printing. This tutorial builds on what was learned in the tutorials proceeding it. You will be referred back to them in specific locations of this tutorial. You will learn the following: Setting up a poster file Slide layout Formatting palette Drawing toolbar Adding and formatting text Inserting Microsoft Word files Inserting pictures Printing your poster Setting up the poster file 1. Open Microsoft PowerPoint. From the PowerPoint Presentation Gallery choose the simple White theme (shown right). 2. From the Layout drop down menu under the Home tab choose Blank slide (shown below).
  • 42.
    40 artforscience.com Setting upthe poster board 3. Choose File, then Page Setup (as shown right). 4. In the Page setup dialog box, change the Width to 48" and the Height to 43.5". Remember, one dimension must be 43.5" (see page 25). 5. When you click OK PowerPoint will ask you if you want to format your poster (which is just an oversized slide) to your current printer's printable area. Click Fix. Text box 6. From the format bar at the top of the poster choose the Text Box tool and then click in the middle top of the poster so you can add a title. See the title box shown at the top and middle of the next page for an example. 7. Type the title into the text box following the guidelines on page 26. Again, see the title box shown at the top and middle of the next page for an example.
  • 43.
    artforscience.com 41 8. Ifyou click on the Home tab while the text box is selected, you will be presented with the formatting that focuses on text (see example below). 9. Change the text to centered. Change the font sizes to match those on page 26. Change the font to Arial (or similar) and click the Bold button (all of these are indicated below by the four downward pointing arrows). 10. To change the superscript numbers, that indicate association of person to local, click the superscript button (indicated above by arrow pointing up on the left side). To change the leading (space between the lines of text) you change the line spacing (indicated above by arrow pointing up on the right side). 11. Save the file with the year, your last name and the title of the meeting. This will help everyone keep track of your poster when it comes time for reviewing, sharing and printing. i.e., year_lastname_meeting.pptx. Inserting Microsoft Word files into your poster 12. Open Microsoft Word by clicking on it in the Dock. 13. Choose File, then Open and open file Introduction1.doc from the sample folder you downloaded earlier. 14. Choose Edit, then Select All and choose Edit, then Copy to copy the text to the clipboard. 15. Switch back to PowerPoint by clicking on it in the Dock. 16. Pick the Text Box tool (page 40, step 6) and then click and drag out a new text box for your introduction.
  • 44.
    42 artforscience.com 17. Inthe new text box, change the text to Arial and the font size to 24 (page 47, step 9). 18. Choose Edit, then Paste Special. 19. In the Paste special dialog box, choose Styled Text and then click OK. NOTE: DO NOT copy and paste text between Word and PowerPoint, you will loose the formatting of the italic, bold, and greek lettering! You must Paste Special it. 20. Click on the Text box editing handles and drag them to make the Text box longer and thinner. Move the Text box into place for the introduction. 21. Select and then change the word "Introduction" to 36 pts. 22. Choose Insert, Photo, Picture from File and open rhodopsin.jpg from the samples folder you downloaded earlier (see example shown on page 29, step 18).
  • 45.
    artforscience.com 43 23. Clickon the Text tool and drag out a text box for the rhodopsin figure legend. Format the font (Arial 24pts) and make the "Figure 1" heading bold 36 pts. 24. Go to page 37 and quickly review the idealized poster features. Just like on pages 38 and 39, let's create a colored box to go behind our title. From the Shape pull down menu in the format area choose the rectangle shape and drag out a box that will start in the upper left of our poster and go down to the lower right side of our title area. 25. From the Fill box choose More Colors... (as shown right) 26. From the Color palette that opens up, choose CMYK colors and give the box a 20 % Cyan fill, click OK. 27. From the Line box choose No Line (as shown right) 28. Add the green rectangle down the left side of the poster to separate off the Introduction (refer back to pages 33). Give it a 20% Cyan, 20% Yellow fill with no stroke, and then Arrange, Send to Back. Fill box Line box
  • 46.
    44 artforscience.com 31. Tocreate the black line that separates the title from the body of the poster (see example at the top of the next page), choose the Shape tool, then Line. Then draw a line that follows right along the bottom of the blue box behind the title (as shown right, and at the top of the next page). 32. From the Arrange menu, choose Bring to Front. To make sure your line is on top of the boxes. 33. From the Line tool choose Weights, then More Lines (as pointed out by the arrows right). In the Format Shape dialog box that appears, change the Weight of the line to 15 pts. Click OK. Your poster should look similar to the one shown at the top of the next page. You can now finish your poster by adding more images, captions and text boxes for conclusions, references, etc.
  • 47.
    artforscience.com 45 Printing Once youhave finished your poster you should print out a proof, show it to the following people, and weigh their advice carefully: Yourself (your poster will look different when you see it on paper!), your PI, your lab mates, and someone who doesn't understand the topic of the poster. Print an 8 1/2" x 11" proof on any printer: Choose File, Print and then click on Scale to Fit Page, then Print (as shown below). If the preview on the left in the Print dialog box doesn't fit the page, click Page Setup and choose your printer from the printer list.
  • 48.
    46 artforscience.com Converting aPowerPoint talk to a PowerPoint poster You will learn the following: Working with Slide masters Viewing two PowerPoint files at the same time Copying and pasting between a PowerPoint talk and a poster This tutorial builds on what was learned in the tutorials proceeding it. You will be referred back to them in specific locations of this tutorial. Create the poster file 1. Please follow steps 1-11 on pages 39-41. This will properly create your poster file and poster title. 2. Choose File, then Open, and open the file talk.ppt from the sample folder you downloaded earlier. 3 From the View menu choose Master, then Slide Master (as shown right). 5. Click on the "Master title style" and note the font, font size, and font style (bold, italic, etc.). In our example it's Arial and 32 pts. Then click on the 1st bullet line of text and do the same (Arial 22 pt). Continue this with each line of bullet text. 6. Choose Window from the menus at the top of the screen and then pick your poster file from the list of open files you'll see there. 7. In the poster file choose View, then Master, Slide Master (as shown above right). 8. Select all of the text in the Master title style and change it to whatever it was in the talk.ppt file. In our example that was Arial 32 pts. Select the text of the first bullet text and do the same. Proceed through each of the other bullet text strings in the slide master until the Slide master of the talk and the Slide master of the poster are the same (see examples at right). Poster Slide Master before... Poster Slide Master after...
  • 49.
    artforscience.com 47 9. Whilestill in the poster file choose View, then Normal (as shown right). 10. Choose Window, Arrange All. 11. Click on the talk file window (shown on the right side below) and choose View, then Normal. If your slide is too big change the size by sliding the scale bar in the lower right of the slide window (see arrow below). 12. In the talk file, Slide one, Select All and Copy. Click on the poster file and Paste. 13. Switch back to the talk file by clicking on it, and go to slide two. Select All and Copy. Click on to the poster file and Paste. Repeat for all slides in the talk (six in our example). 14. Once you have moved all of your slides over to the poster file, close the talk file. Make the poster file full screen by clicking on the little green dot in the upper left corner of the window. Complete your poster using the information on pages 41 step 12 through page 45. NOTE: Little things may change when you copy from one file to the other. Remember to go in and check all the details!