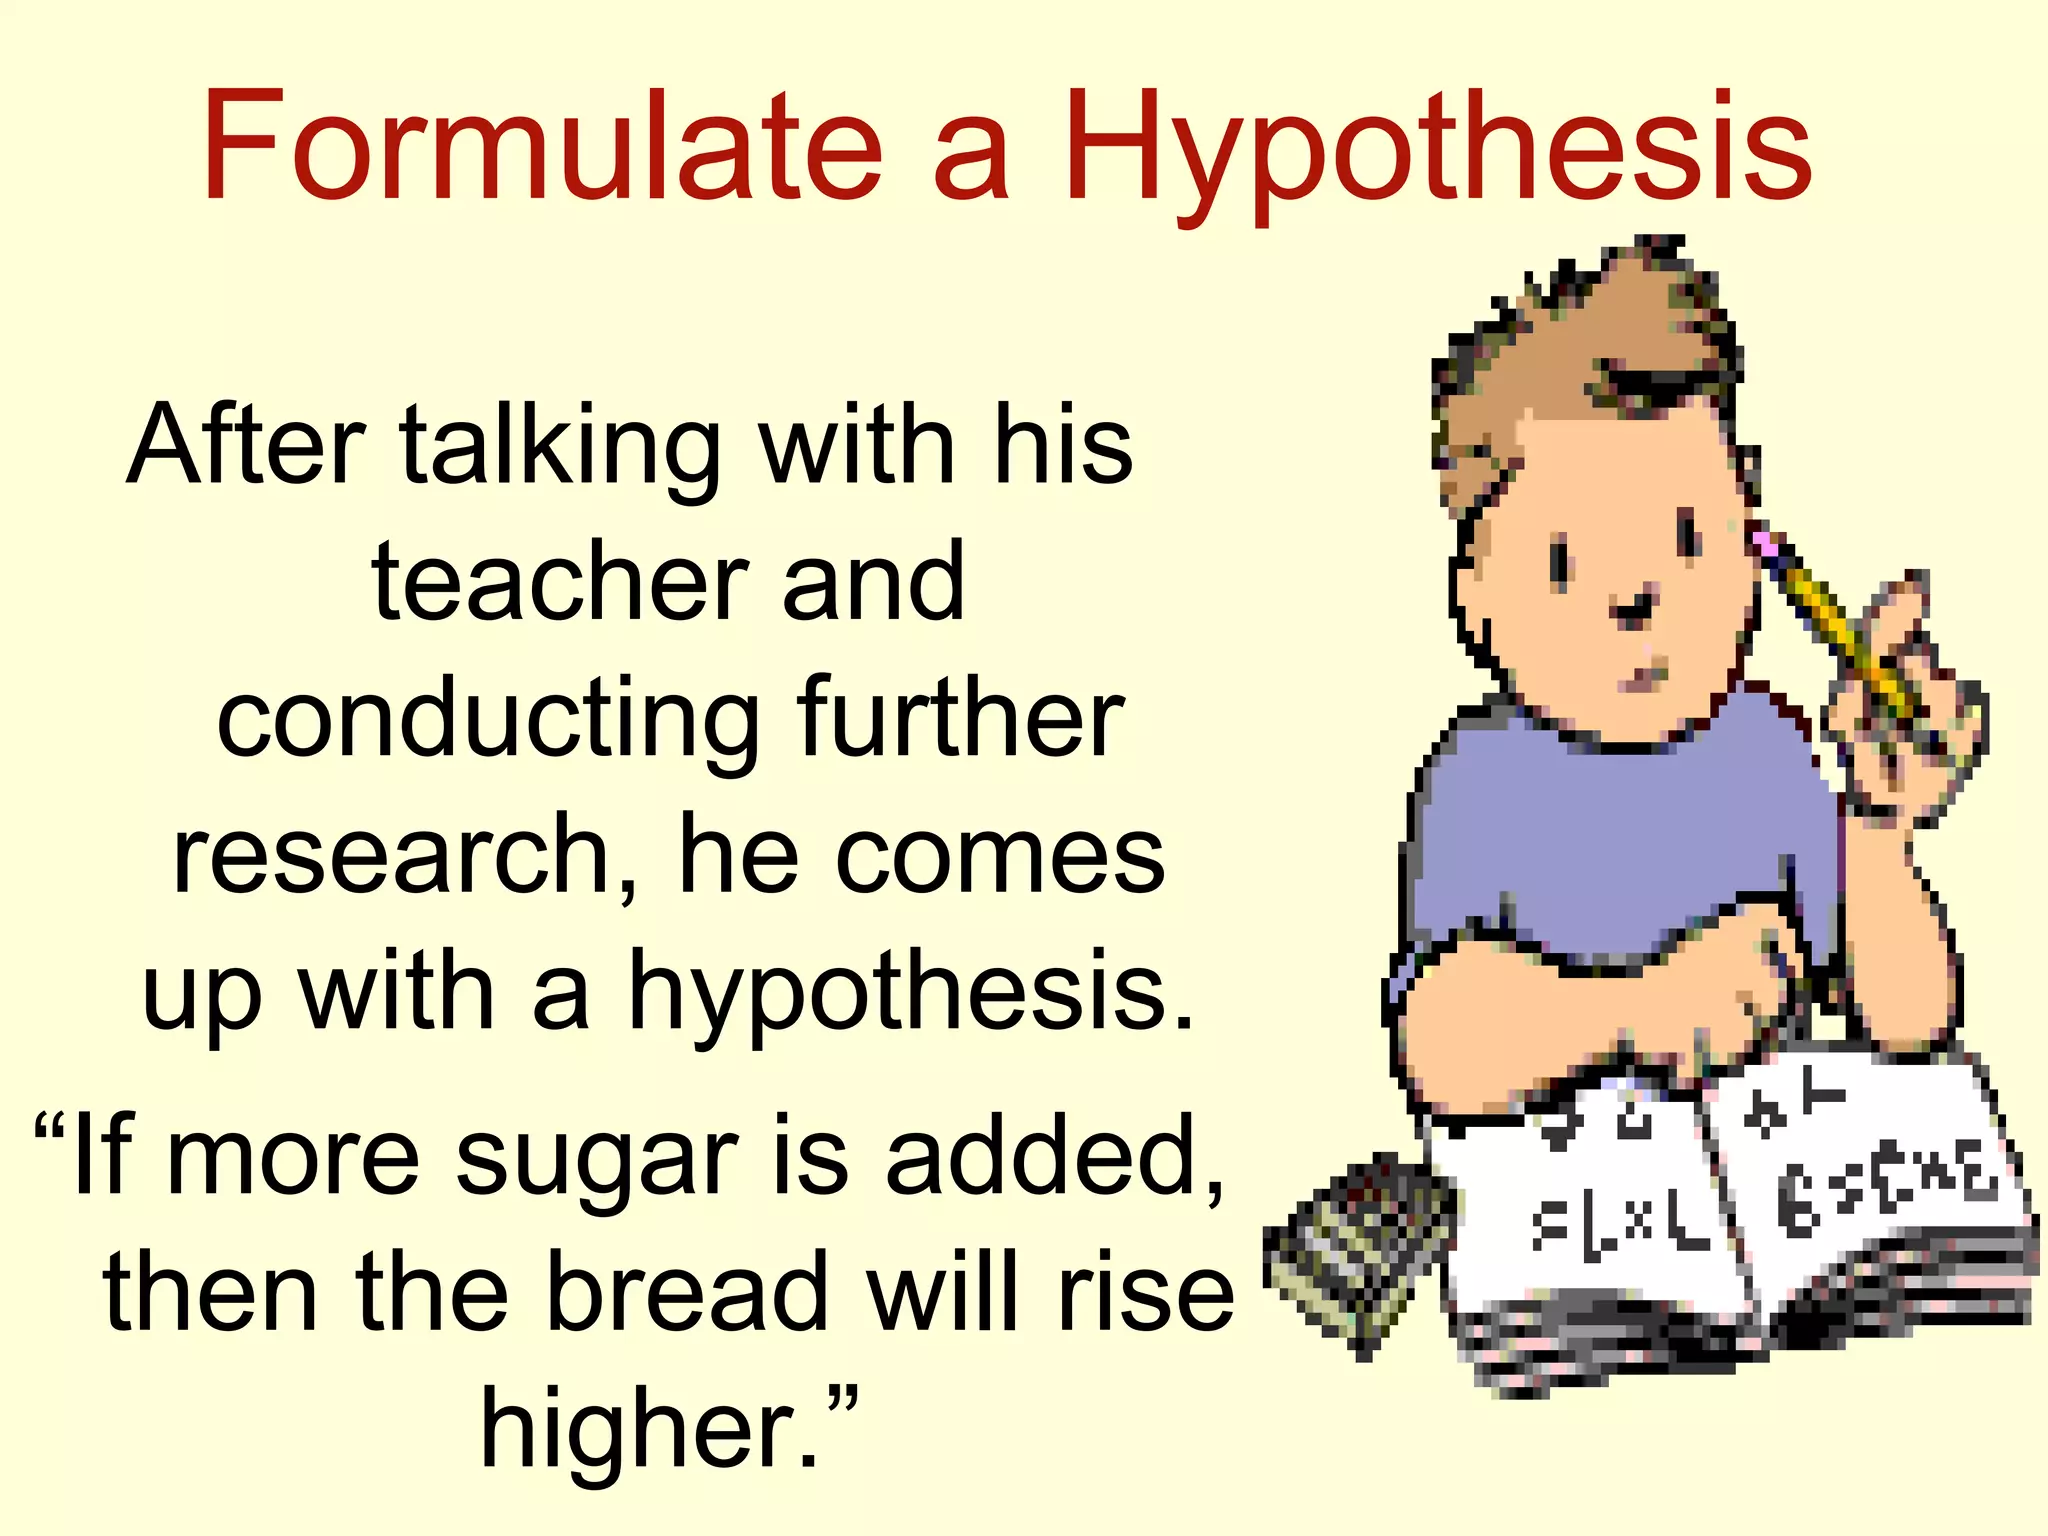
Steps ofSteps of
thethe
ScientificScientific
MethodMethod
The Scientific Method
involves a series of
steps that are used
to investigate a
natural occurrence.
We shall take a
closer look at
these steps and
the terminology
you will need to
understand
before you start a
science project.
Problem/Question
Observation/Research
Formulate a Hypothesis
Experiment
Collect and Analyze Results
Conclusion
Communicate the Results
Steps of the
Scientific Method
1. Problem/QuestionProblem/Question: Develop a
question or problem that can
be solved through
experimentation.
Steps of the
Scientific Method
2. Observation/ResearchObservation/Research: Make
observations and research
your topic of interest.
Do you remember theDo you remember the
next step?next step?
Steps of the
Scientific Method
3. Formulate a HypothesisFormulate a Hypothesis:
Predict a possible answer to
the problem or question.
Example: If soil temperatures
rise, then plant growth will
increase.
Steps of the
Scientific Method
4. ExperimentExperiment: Develop and
follow a procedure.
Include a detailed materials list.
The outcome must be
measurable (quantifiable).
Steps of the
Scientific Method
5. Collect and Analyze ResultsCollect and Analyze Results:
Modify the procedure if
needed.
Confirm the results by retesting.
Include tables, graphs, and
photographs.
Steps of the
Scientific Method
6. ConclusionConclusion: Include a
statement that accepts or
rejects the hypothesis.
Make recommendations for
further study and possible
improvements to the
procedure.
Steps of the
Scientific Method
7. Communicate the ResultsCommunicate the Results: Be
prepared to present the project
to an audience.
Expect questions from the
audience.
Think you can name allThink you can name all
seven steps?seven steps?
Problem/QuestionProblem/Question
Observation/ResearchObservation/Research
Formulate a HypothesisFormulate a Hypothesis
ExperimentExperiment
Collect and Analyze ResultsCollect and Analyze Results
ConclusionConclusion
Communicate the ResultsCommunicate the Results
Let’s put our knowledge of the
Scientific Method to a realistic
example that includes some of the
terms you’ll be needing to use and
understand.
Problem/Question
John watches his
grandmother bake
bread. He ask his
grandmother what
makes the bread rise.
She explains that yeast
releases a gas as it
feeds on sugar.
Problem/Question
John wonders if the
amount of sugar used
in the recipe will affect
the size of the bread
loaf?
Caution!
Be careful how you use effect and
affect.
Effect is usually a noun and affect, a
verb.
“ The effect of sugar amounts on the
rising of bread.”
“How does sugar affect the rising of
bread?”
Observation/Research
John researches the
areas of baking and
fermentation and tries
to come up with a way
to test his question.
He keeps all of his
information on this
topic in a journal.
John talks with his
teacher and she gives
him a Experimental
Design Diagram to
help him set up his
investigation.
Formulate a Hypothesis
After talking with his
teacher and
conducting further
research, he comes
up with a hypothesis.
“If more sugar is added,
then the bread will rise
higher.”
Hypothesis
The hypothesis is an educated
guess about the relationship
between the independent and
dependent variables.
Note: These variables will be
defined in the next few slides.
Do you know the differenceDo you know the difference
between the independentbetween the independent
and dependent variables?and dependent variables?
Independent Variable
The independent, or
manipulated variable, is a factor
that’s intentionally varied by the
experimenter.
John is going to use 25g., 50g.,
100g., 250g., 500g. of sugar in
his experiment.
Dependent Variable
The dependent, or responding
variable, is the factor that may
change as a result of changes
made in the independent
variable.
In this case, it would be the size
of the loaf of bread.
Experiment
His teacher helps him
come up with a
procedure and list of
needed materials.
She discusses with
John how to
determine the control
group.
Control Group
In a scientific experiment, the
control is the group that serves
as the standard of comparison.
The control group may be a “no
treatment" or an “experimenter
selected” group.
Control Group
The control group is exposed to
the same conditions as the
experimental group, except for
the variable being tested.
All experiments should have a
control group.
Control Group
Because his grandmother
always used 50g. of sugar in
her recipe, John is going to use
that amount in his control
group.
Constants
John’s teacher reminds
him to keep all other
factors the same so
that any observed
changes in the bread
can be attributed to
the variation in the
amount of sugar.
Constants
The constants in an
experiment are all the
factors that the
experimenter attempts
to keep the same.
Can you think of someCan you think of some
constants for thisconstants for this
experiment?experiment?
Constants
They might include:
Other ingredients to the
bread recipe, oven used,
rise time, brand of
ingredients, cooking time,
type of pan used, air
temperature and humidity
where the bread was
rising, oven temperature,
age of the yeast…
Experiment
John writes out his
procedure for his
experiment along with
a materials list in his
journal. He has both of
these checked by his
teacher where she
checks for any safety
concerns.
Trials
Trials refer to replicate
groups that are exposed
to the same conditions
in an experiment.
John is going to test each
sugar variable 3 times.
Collect and Analyze Results
John comes up with
a table he can use
to record his data.
John gets all his
materials together
and carries out his
experiment.
Size of Baked Bread (LxWxH) cm3
Amt. of
Sugar (g.)
1 2 3 AverageAverage
Size (cmSize (cm33
))
25 768 744 761 758
50 1296 1188 1296 1260
100 1188 1080 1080 1116
250 672 576 588 612
500 432 504 360 432
Size of Bread Loaf (cmSize of Bread Loaf (cm33
))
TrialsTrials
Control group
Collect and Analyze Results
John examines his
data and notices that
his control worked
the best in this
experiment, but not
significantly better
than 100g. of sugar.
Conclusion
John rejects his
hypothesis, but
decides to re-test
using sugar
amounts between
50g. and 100g.
Experiment
Once again, John
gathers his materials
and carries out his
experiment.
Here are the results.
Can you tell which groupCan you tell which group
did the best?did the best?
Size of Baked Bread (LxWxH) cm3
Amt. of
Sugar (g.)
1 2 3 AverageAverage
Size (cmSize (cm33
))
50 1296 1440 1296 1344
60 1404 1296 1440 1380
70 1638 1638 1560 1612
80 1404 1296 1296 1332
90 1080 1200 972 1084
Size of Bread Loaf (cmSize of Bread Loaf (cm33
))
TrialsTrials
Control group
Conclusion
John finds that 70g.
of sugar produces
the largest loaf.
His hypothesis is
accepted.
Communicate the Results
John tells his
grandmother about
his findings and
prepares to present
his project in
Science class.
The 5 E’s of Scientific
Presentation
Concepts
of
Science
Science
Content
Students use the process skills of science to
develop an understanding of the scientific
concepts.
Process
Skills of
Science
Engage
Explore
ExplainExtend
Evaluate
5 E’s
Scientific
Presentation
Engage
Activity which will focus student’s attention,
stimulate their thinking, and access prior
knowledge.
Explore
Activity which gives students time to think and
investigate/test/make decisions/problem solve,
and collect information.
Explain
Activity which allows students to analyze their
exploration. Student’s understanding is
clarified and modified through a reflective
activity.
Extend
Activity which expands and solidifies student
thinking and/or applies it to a real-world situation.
Evaluate
Activity which allows the teacher to assess
student performance and/or understandings of
concepts, skills, processes, and applications.
Engage
Explore
ExplainExtend
Evaluate
5 E’s
Scientific
Presentation
Engage
Suggested Activities
• Demonstration
• Reading
• Free Writing
• Analyze a Graphic Organizer
• KWL
• Brainstorming
Engage
What the Scientist Does
• Creates Interest.
• Generates curiosity.
• Raises questions.
• Elicits responses that uncover what the
Audience know or think about the concept/topic.
Engage
What the Presenter Does
• Asks questions such as, Why did this happen?
What do I already know about this? What have I
found out about this?
• Shows interest in the topic.
Explore
Suggested Activities
• Perform an Investigation
• Read Authentic Resources to Collect Information
• Solve a Problem
• Construct a Model
Explore
What the Scientist Does
• Encourages the Audience to work together
without direct instruction from the Scientist.
• Observes and listens to the Audience as they
interact.
• Asks probing questions to redirect the Audience’
investigations when necessary.
• Provides time for Audience to puzzle through
problems.
Explore
What the Audience Does
• Thinks freely but within the limits of the activity.
• Tests predictions and hypotheses.
• Forms new predictions and hypotheses.
• Tries alternatives and discusses them with
others.
• Records observations and ideas.
• Suspends judgement.
Explain
Suggested Activities
• Audience Analysis & Explanation
• Supporting Ideas with Evidence
• Structured Questioning
• Reading and Discussion
• Scientist Explanation
• Thinking Skill Activities: compare, classify, error
analysis
Explain
What the Scientist Does
• Encourages the Audience to explain concepts
and definitions in their own words.
• Asks for justification (evidence) and clarification
from Audience.
• Formally provides definitions, explanations, and
new ideas.
• Uses Audience’ previous experiences as basis
for explaining concepts.
Explain
What the Audience Does
• Explains possible solutions or answers to others.
• Listens officially to others’ explanations.
• Questions others’ explanations.
• Listens to and tries to comprehend explanations
the Scientist offers.
• Refers to previous activities.
• Uses recorded observations in explanations.
Extend
Suggested Activities
• Problem Solving
• Decision Making
• Experimental Inquiry
• Thinking Skill Activities: compare, classify, apply
Extend
What the Scientist Does
• Expects the Audience to use formal ideas,
definitions, and explanations provided
previously.
• Encourages the Audience to apply or extend the
concepts and skills in new situations.
• Reminds the Audience of alternative
explanations.
• Refers the Audience to existing data and
evidence and asks, What do you already know?
Why do you think . . .?
• Strategies from Explore apply here also.
Extend
What the Audience Does
• Applies new ideas, definitions, explanations, and
skills in new, but similar situations.
• Uses previous information to ask questions,
propose solutions, make decisions, and design
experiments.
• Draws reasonable conclusions from evidence.
• Records observations and explanations.
• Checks for understandings among peers.
Evaluate
Suggested Activities
• Any of the Previous Activities
• Develop a Scoring Tool or Rubric
• Test (SR, BCR, ECR)
• Performance Assessment
• Produce a Product
• Journal Entry
• Portfolio
Evaluate
What the Scientist Does
• Observes the Audience as they apply new
concepts and skills.
• Assesses Audience’s’ knowledge and/or skills.
• Looks for evidence that the Audience have
changed their thinking or behaviors.
• Allows Audience to assess their own learning
and group-process skills.
• Asks open-ended questions, such as: Why do
you think. . .? What evidence do you have?
What do you know about x? How would you
explain x?
Evaluate
What the Audience Does
• Answers open-ended questions by using
observations, evidence, and previously accepted
explanations.
• Demonstrates an understanding or knowledge of
the concept or skill.
• Evaluates his or her own progress and
knowledge.
• Asks related questions that would encourage
future investigations.
The 5 E’s Scientific Presentation Planner
ENGAGE:
EXPLORE:EVALUATE:
EXPLAIN:EXTEND:
Elementary Scientific Planning Sheet
CONTENT STANDARDS:
Earth/Space Science
Life Science Physics
Chemistry Environmental Science
INDICATOR (MLO):
Grade: Unit:
SKILLS AND PROCESSES STANDARD:
Students will demonstrate the thinking and acting inherent in the practice of science.
Scientific Inquiry:
Demonstrates the ability to employ the
language, instruments, methods, and materials
of science.
Indicator:
Critical Thinking:
Demonstrates the thinking and acting inherent
in the practice of science.
Indicator:
Applications of Science:
Demonstrates the ability to apply science
information in various situations.
Indicator:
Technology:
Demonstrates the ability to use the principles
of technology when exploring scientific
concepts.
Indicator:
ENDURING UNDERSTANDING:
ESSENTIALQUESTION:
Well-Designed Science Investigation
High School
Testable Question(s) - A question that can be answered through an investigation.
Prediction - A statement about what may happen in the investigation based on
prior knowledge and/or evidence from previous investigations.
Hypothesis -
Well-Designed Procedure
A testable explanation (if-then statement) based on an observation,
experience, or scientific reason including the expected cause and
effect in a given circumstance or situation.
Directions - A logical set of steps followed while completing the procedure.
Materials - All materials needed for completing the investigation are listed.
Variables(s) - Factors in an investigation that could affect the results. The
independent variable (horizontal or x-axis) is the one variable the
investigator chooses to change. The dependent variable(s)
(vertical or y-axis) change(s) as a result or response.
Data Collection - The results of the investigation usually recorded on a table,
graph, chart, etc.
Repeated or Multiple Trials - Repeating the investigation several times
and using the collected data for comparing results and creating
reliability.
Part 1
Well-Designed Science Investigation
High School
Part 2
Conclusion
1. A statement about the trend (general drift, tendency, or direction) of a set of
data from analyzing the data collected during the investigation
(form a conclusion ).
2. The closing paragraph of a report including at least the investigative question,
the hypothesis, and the explanation of the results ( write a conclusion ).
Communicate and Discuss Results
Share your findings with others for critical analysis (peer review, conference,
presentation, etc.) Discuss conclusions with supporting evidence to identify
more investigative questions.

Scientific method and procces.

  • 1.
  • 2.
    The Scientific Method involvesa series of steps that are used to investigate a natural occurrence.
  • 3.
    We shall takea closer look at these steps and the terminology you will need to understand before you start a science project.
  • 4.
    Problem/Question Observation/Research Formulate a Hypothesis Experiment Collectand Analyze Results Conclusion Communicate the Results
  • 5.
    Steps of the ScientificMethod 1. Problem/QuestionProblem/Question: Develop a question or problem that can be solved through experimentation.
  • 6.
    Steps of the ScientificMethod 2. Observation/ResearchObservation/Research: Make observations and research your topic of interest.
  • 7.
    Do you remembertheDo you remember the next step?next step?
  • 8.
    Steps of the ScientificMethod 3. Formulate a HypothesisFormulate a Hypothesis: Predict a possible answer to the problem or question. Example: If soil temperatures rise, then plant growth will increase.
  • 9.
    Steps of the ScientificMethod 4. ExperimentExperiment: Develop and follow a procedure. Include a detailed materials list. The outcome must be measurable (quantifiable).
  • 10.
    Steps of the ScientificMethod 5. Collect and Analyze ResultsCollect and Analyze Results: Modify the procedure if needed. Confirm the results by retesting. Include tables, graphs, and photographs.
  • 11.
    Steps of the ScientificMethod 6. ConclusionConclusion: Include a statement that accepts or rejects the hypothesis. Make recommendations for further study and possible improvements to the procedure.
  • 12.
    Steps of the ScientificMethod 7. Communicate the ResultsCommunicate the Results: Be prepared to present the project to an audience. Expect questions from the audience.
  • 13.
    Think you canname allThink you can name all seven steps?seven steps? Problem/QuestionProblem/Question Observation/ResearchObservation/Research Formulate a HypothesisFormulate a Hypothesis ExperimentExperiment Collect and Analyze ResultsCollect and Analyze Results ConclusionConclusion Communicate the ResultsCommunicate the Results
  • 14.
    Let’s put ourknowledge of the Scientific Method to a realistic example that includes some of the terms you’ll be needing to use and understand.
  • 15.
    Problem/Question John watches his grandmotherbake bread. He ask his grandmother what makes the bread rise. She explains that yeast releases a gas as it feeds on sugar.
  • 16.
    Problem/Question John wonders ifthe amount of sugar used in the recipe will affect the size of the bread loaf?
  • 17.
    Caution! Be careful howyou use effect and affect. Effect is usually a noun and affect, a verb. “ The effect of sugar amounts on the rising of bread.” “How does sugar affect the rising of bread?”
  • 18.
    Observation/Research John researches the areasof baking and fermentation and tries to come up with a way to test his question. He keeps all of his information on this topic in a journal.
  • 19.
    John talks withhis teacher and she gives him a Experimental Design Diagram to help him set up his investigation.
  • 20.
    Formulate a Hypothesis Aftertalking with his teacher and conducting further research, he comes up with a hypothesis. “If more sugar is added, then the bread will rise higher.”
  • 21.
    Hypothesis The hypothesis isan educated guess about the relationship between the independent and dependent variables. Note: These variables will be defined in the next few slides.
  • 22.
    Do you knowthe differenceDo you know the difference between the independentbetween the independent and dependent variables?and dependent variables?
  • 23.
    Independent Variable The independent,or manipulated variable, is a factor that’s intentionally varied by the experimenter. John is going to use 25g., 50g., 100g., 250g., 500g. of sugar in his experiment.
  • 24.
    Dependent Variable The dependent,or responding variable, is the factor that may change as a result of changes made in the independent variable. In this case, it would be the size of the loaf of bread.
  • 25.
    Experiment His teacher helpshim come up with a procedure and list of needed materials. She discusses with John how to determine the control group.
  • 26.
    Control Group In ascientific experiment, the control is the group that serves as the standard of comparison. The control group may be a “no treatment" or an “experimenter selected” group.
  • 27.
    Control Group The controlgroup is exposed to the same conditions as the experimental group, except for the variable being tested. All experiments should have a control group.
  • 28.
    Control Group Because hisgrandmother always used 50g. of sugar in her recipe, John is going to use that amount in his control group.
  • 29.
    Constants John’s teacher reminds himto keep all other factors the same so that any observed changes in the bread can be attributed to the variation in the amount of sugar.
  • 30.
    Constants The constants inan experiment are all the factors that the experimenter attempts to keep the same.
  • 31.
    Can you thinkof someCan you think of some constants for thisconstants for this experiment?experiment?
  • 32.
    Constants They might include: Otheringredients to the bread recipe, oven used, rise time, brand of ingredients, cooking time, type of pan used, air temperature and humidity where the bread was rising, oven temperature, age of the yeast…
  • 33.
    Experiment John writes outhis procedure for his experiment along with a materials list in his journal. He has both of these checked by his teacher where she checks for any safety concerns.
  • 34.
    Trials Trials refer toreplicate groups that are exposed to the same conditions in an experiment. John is going to test each sugar variable 3 times.
  • 35.
    Collect and AnalyzeResults John comes up with a table he can use to record his data. John gets all his materials together and carries out his experiment.
  • 36.
    Size of BakedBread (LxWxH) cm3 Amt. of Sugar (g.) 1 2 3 AverageAverage Size (cmSize (cm33 )) 25 768 744 761 758 50 1296 1188 1296 1260 100 1188 1080 1080 1116 250 672 576 588 612 500 432 504 360 432 Size of Bread Loaf (cmSize of Bread Loaf (cm33 )) TrialsTrials Control group
  • 37.
    Collect and AnalyzeResults John examines his data and notices that his control worked the best in this experiment, but not significantly better than 100g. of sugar.
  • 38.
    Conclusion John rejects his hypothesis,but decides to re-test using sugar amounts between 50g. and 100g.
  • 39.
    Experiment Once again, John gathershis materials and carries out his experiment. Here are the results.
  • 40.
    Can you tellwhich groupCan you tell which group did the best?did the best?
  • 41.
    Size of BakedBread (LxWxH) cm3 Amt. of Sugar (g.) 1 2 3 AverageAverage Size (cmSize (cm33 )) 50 1296 1440 1296 1344 60 1404 1296 1440 1380 70 1638 1638 1560 1612 80 1404 1296 1296 1332 90 1080 1200 972 1084 Size of Bread Loaf (cmSize of Bread Loaf (cm33 )) TrialsTrials Control group
  • 42.
    Conclusion John finds that70g. of sugar produces the largest loaf. His hypothesis is accepted.
  • 43.
    Communicate the Results Johntells his grandmother about his findings and prepares to present his project in Science class.
  • 44.
    The 5 E’sof Scientific Presentation
  • 45.
    Concepts of Science Science Content Students use theprocess skills of science to develop an understanding of the scientific concepts. Process Skills of Science
  • 46.
  • 47.
    Engage Activity which willfocus student’s attention, stimulate their thinking, and access prior knowledge.
  • 48.
    Explore Activity which givesstudents time to think and investigate/test/make decisions/problem solve, and collect information.
  • 49.
    Explain Activity which allowsstudents to analyze their exploration. Student’s understanding is clarified and modified through a reflective activity.
  • 50.
    Extend Activity which expandsand solidifies student thinking and/or applies it to a real-world situation.
  • 51.
    Evaluate Activity which allowsthe teacher to assess student performance and/or understandings of concepts, skills, processes, and applications.
  • 52.
  • 53.
    Engage Suggested Activities • Demonstration •Reading • Free Writing • Analyze a Graphic Organizer • KWL • Brainstorming
  • 54.
    Engage What the ScientistDoes • Creates Interest. • Generates curiosity. • Raises questions. • Elicits responses that uncover what the Audience know or think about the concept/topic.
  • 55.
    Engage What the PresenterDoes • Asks questions such as, Why did this happen? What do I already know about this? What have I found out about this? • Shows interest in the topic.
  • 56.
    Explore Suggested Activities • Performan Investigation • Read Authentic Resources to Collect Information • Solve a Problem • Construct a Model
  • 57.
    Explore What the ScientistDoes • Encourages the Audience to work together without direct instruction from the Scientist. • Observes and listens to the Audience as they interact. • Asks probing questions to redirect the Audience’ investigations when necessary. • Provides time for Audience to puzzle through problems.
  • 58.
    Explore What the AudienceDoes • Thinks freely but within the limits of the activity. • Tests predictions and hypotheses. • Forms new predictions and hypotheses. • Tries alternatives and discusses them with others. • Records observations and ideas. • Suspends judgement.
  • 59.
    Explain Suggested Activities • AudienceAnalysis & Explanation • Supporting Ideas with Evidence • Structured Questioning • Reading and Discussion • Scientist Explanation • Thinking Skill Activities: compare, classify, error analysis
  • 60.
    Explain What the ScientistDoes • Encourages the Audience to explain concepts and definitions in their own words. • Asks for justification (evidence) and clarification from Audience. • Formally provides definitions, explanations, and new ideas. • Uses Audience’ previous experiences as basis for explaining concepts.
  • 61.
    Explain What the AudienceDoes • Explains possible solutions or answers to others. • Listens officially to others’ explanations. • Questions others’ explanations. • Listens to and tries to comprehend explanations the Scientist offers. • Refers to previous activities. • Uses recorded observations in explanations.
  • 62.
    Extend Suggested Activities • ProblemSolving • Decision Making • Experimental Inquiry • Thinking Skill Activities: compare, classify, apply
  • 63.
    Extend What the ScientistDoes • Expects the Audience to use formal ideas, definitions, and explanations provided previously. • Encourages the Audience to apply or extend the concepts and skills in new situations. • Reminds the Audience of alternative explanations. • Refers the Audience to existing data and evidence and asks, What do you already know? Why do you think . . .? • Strategies from Explore apply here also.
  • 64.
    Extend What the AudienceDoes • Applies new ideas, definitions, explanations, and skills in new, but similar situations. • Uses previous information to ask questions, propose solutions, make decisions, and design experiments. • Draws reasonable conclusions from evidence. • Records observations and explanations. • Checks for understandings among peers.
  • 65.
    Evaluate Suggested Activities • Anyof the Previous Activities • Develop a Scoring Tool or Rubric • Test (SR, BCR, ECR) • Performance Assessment • Produce a Product • Journal Entry • Portfolio
  • 66.
    Evaluate What the ScientistDoes • Observes the Audience as they apply new concepts and skills. • Assesses Audience’s’ knowledge and/or skills. • Looks for evidence that the Audience have changed their thinking or behaviors. • Allows Audience to assess their own learning and group-process skills. • Asks open-ended questions, such as: Why do you think. . .? What evidence do you have? What do you know about x? How would you explain x?
  • 67.
    Evaluate What the AudienceDoes • Answers open-ended questions by using observations, evidence, and previously accepted explanations. • Demonstrates an understanding or knowledge of the concept or skill. • Evaluates his or her own progress and knowledge. • Asks related questions that would encourage future investigations.
  • 68.
    The 5 E’sScientific Presentation Planner ENGAGE: EXPLORE:EVALUATE: EXPLAIN:EXTEND:
  • 69.
    Elementary Scientific PlanningSheet CONTENT STANDARDS: Earth/Space Science Life Science Physics Chemistry Environmental Science INDICATOR (MLO): Grade: Unit: SKILLS AND PROCESSES STANDARD: Students will demonstrate the thinking and acting inherent in the practice of science. Scientific Inquiry: Demonstrates the ability to employ the language, instruments, methods, and materials of science. Indicator: Critical Thinking: Demonstrates the thinking and acting inherent in the practice of science. Indicator: Applications of Science: Demonstrates the ability to apply science information in various situations. Indicator: Technology: Demonstrates the ability to use the principles of technology when exploring scientific concepts. Indicator: ENDURING UNDERSTANDING: ESSENTIALQUESTION:
  • 70.
    Well-Designed Science Investigation HighSchool Testable Question(s) - A question that can be answered through an investigation. Prediction - A statement about what may happen in the investigation based on prior knowledge and/or evidence from previous investigations. Hypothesis - Well-Designed Procedure A testable explanation (if-then statement) based on an observation, experience, or scientific reason including the expected cause and effect in a given circumstance or situation. Directions - A logical set of steps followed while completing the procedure. Materials - All materials needed for completing the investigation are listed. Variables(s) - Factors in an investigation that could affect the results. The independent variable (horizontal or x-axis) is the one variable the investigator chooses to change. The dependent variable(s) (vertical or y-axis) change(s) as a result or response. Data Collection - The results of the investigation usually recorded on a table, graph, chart, etc. Repeated or Multiple Trials - Repeating the investigation several times and using the collected data for comparing results and creating reliability. Part 1
  • 71.
    Well-Designed Science Investigation HighSchool Part 2 Conclusion 1. A statement about the trend (general drift, tendency, or direction) of a set of data from analyzing the data collected during the investigation (form a conclusion ). 2. The closing paragraph of a report including at least the investigative question, the hypothesis, and the explanation of the results ( write a conclusion ). Communicate and Discuss Results Share your findings with others for critical analysis (peer review, conference, presentation, etc.) Discuss conclusions with supporting evidence to identify more investigative questions.