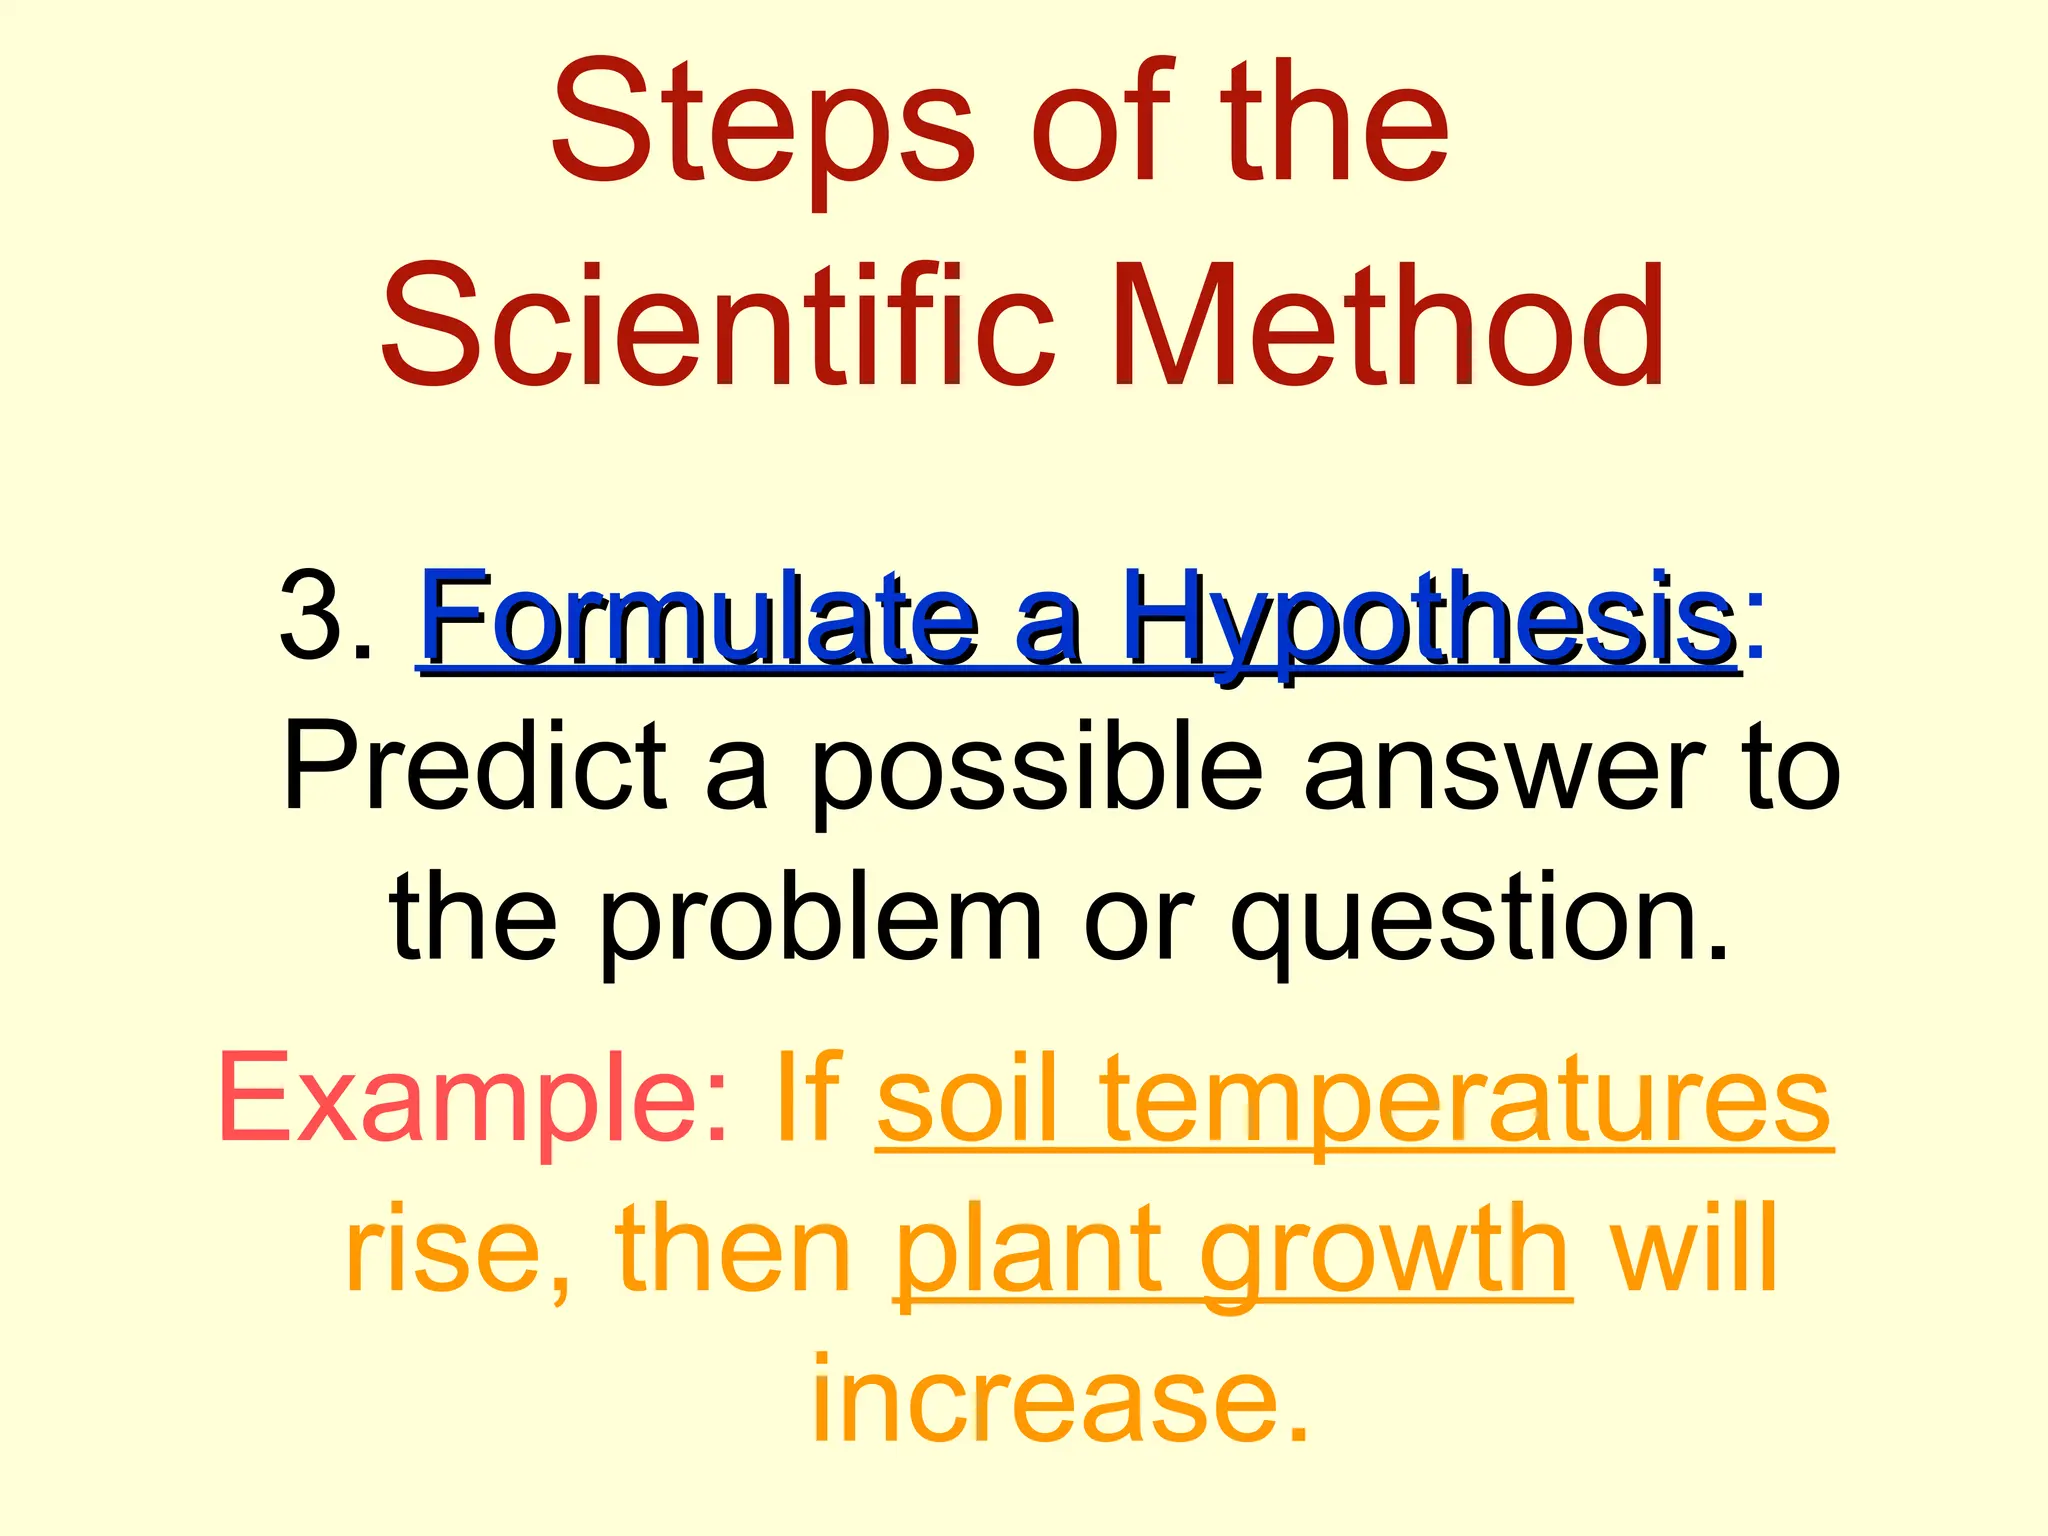
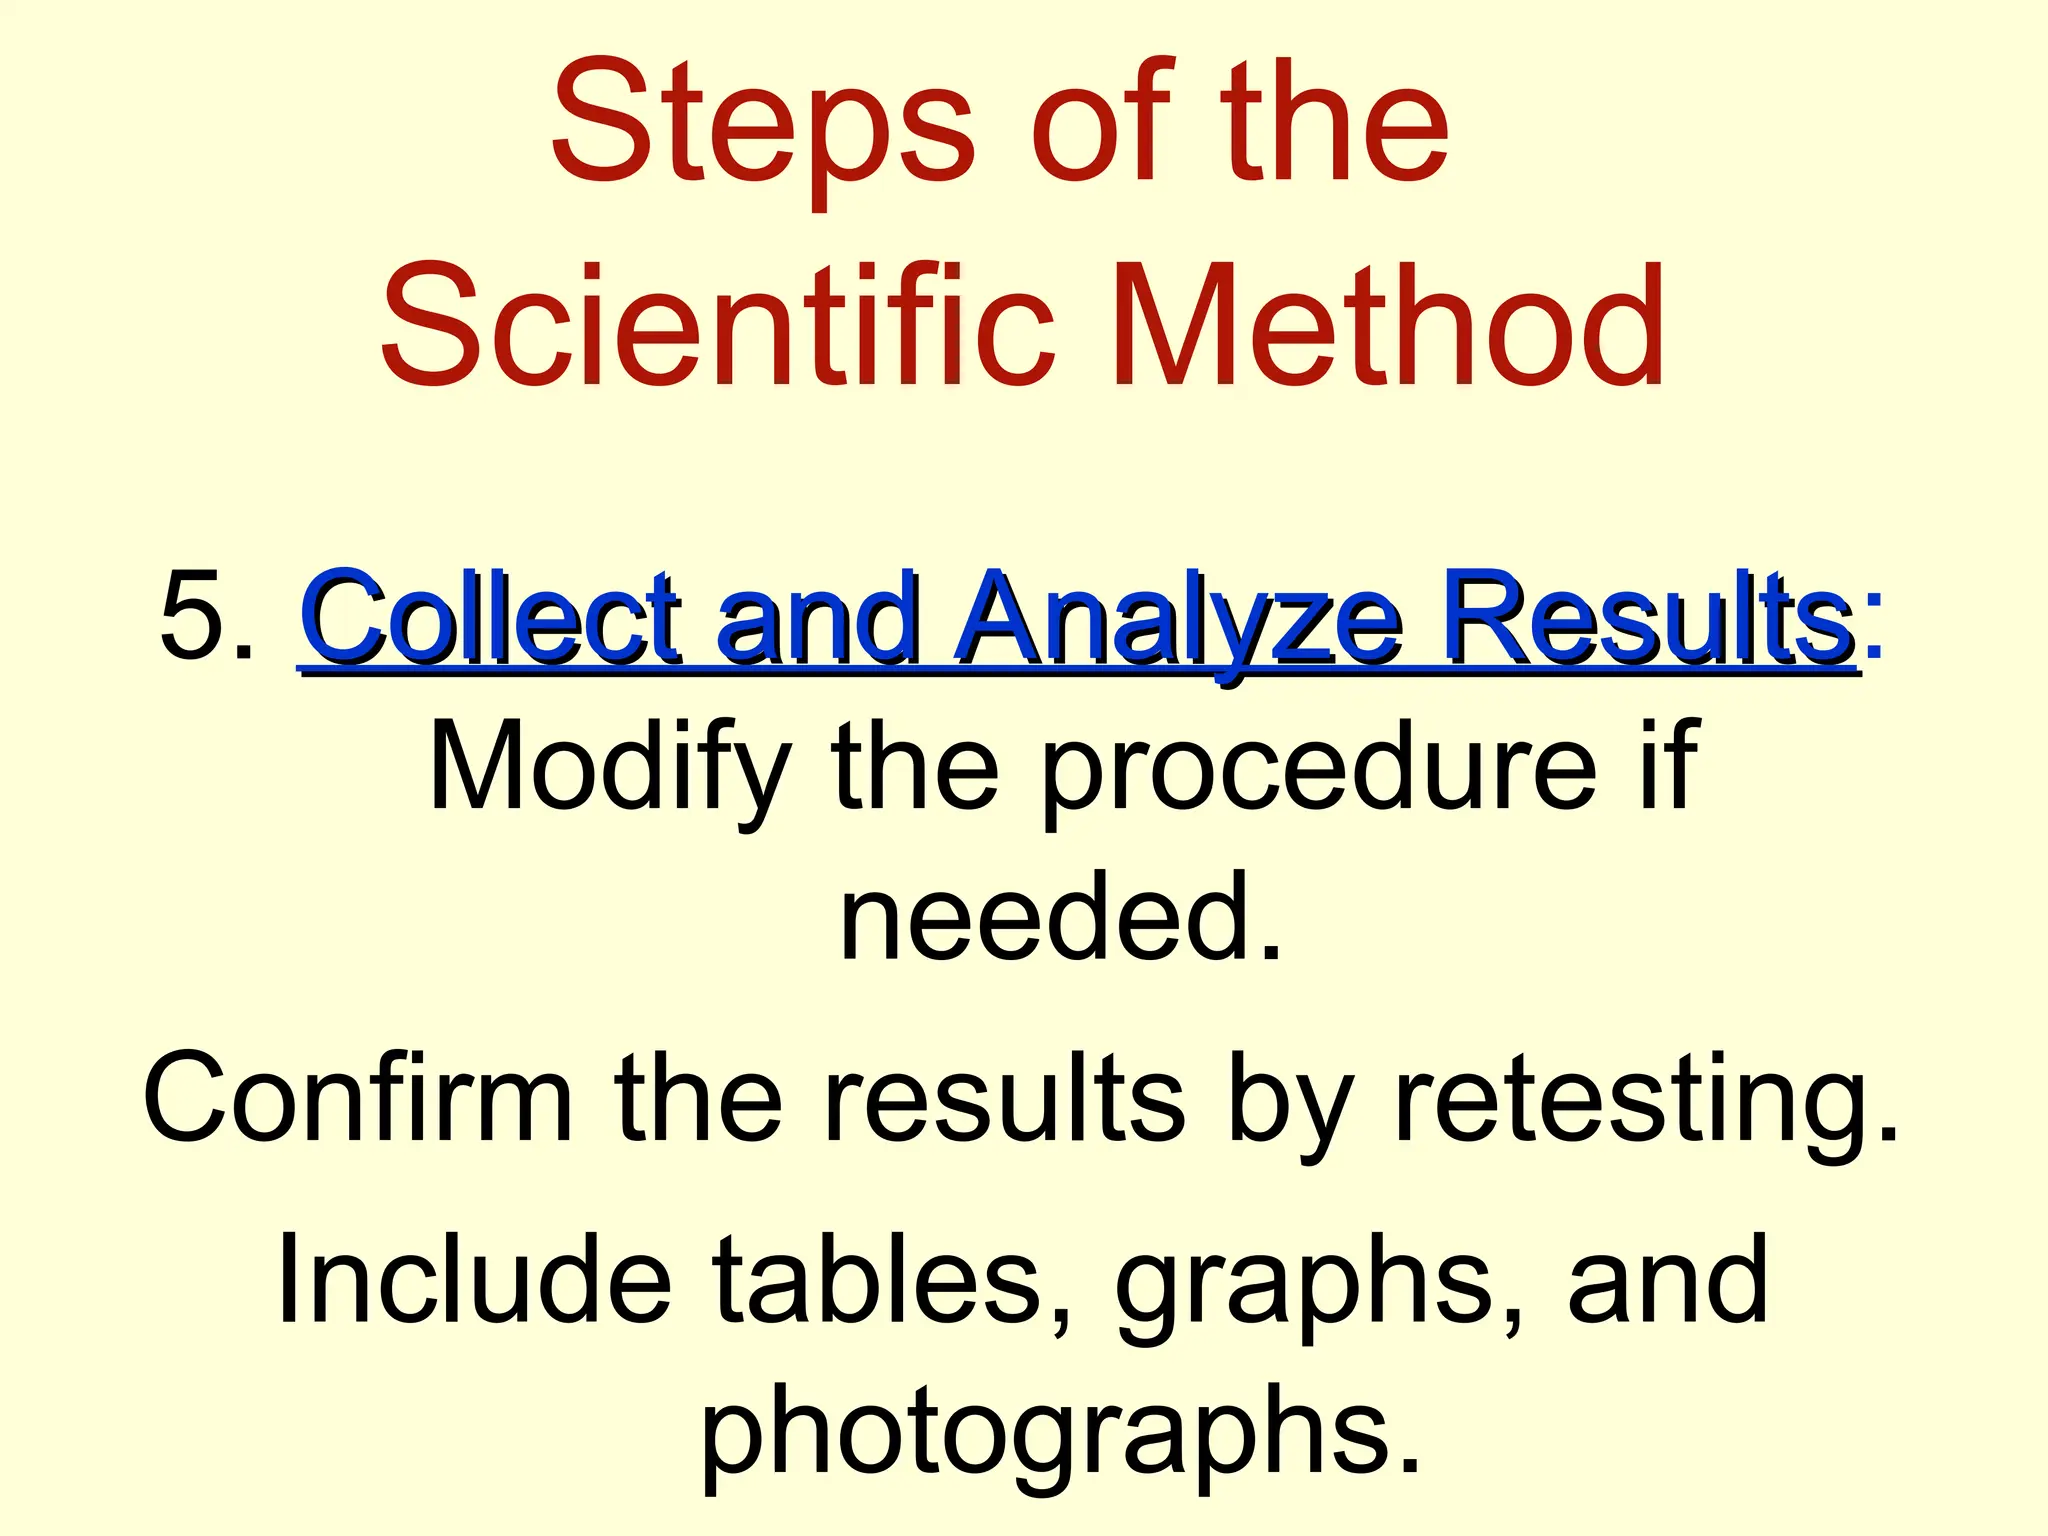
The Scientific
Method involves a
series of steps that
are used to
investigate a
natural
occurrence.
We shall take a
closer look at
these steps and
the terminology
you will need to
understand
before you start a
science project.
Problem/Question
Observation/Research
Formulate a Hypothesis
Experiment
Collect and Analyze Results
Conclusion
Communicate the Results
Steps of the
Scientific Method
1. Problem/Question
Problem/Question: Develop a
question or problem that can
be solved through
experimentation.
Steps of the
Scientific Method
2. Observation/Research
Observation/Research: Make
observations and research
your topic of interest.
Do you remember the
Do you remember the
next step?
next step?
Steps of the
Scientific Method
3. Formulate a Hypothesis
Formulate a Hypothesis:
Predict a possible answer to
the problem or question.
Example: If soil temperatures
rise, then plant growth will
increase.
Steps of the
Scientific Method
4. Experiment
Experiment: Develop and
follow a procedure.
Include a detailed materials list.
The outcome must be
measurable (quantifiable).
Steps of the
Scientific Method
5. Collect and Analyze Results
Collect and Analyze Results:
Modify the procedure if
needed.
Confirm the results by retesting.
Include tables, graphs, and
photographs.
Steps of the
Scientific Method
6. Conclusion
Conclusion: Include a
statement that accepts or
rejects the hypothesis.
Make recommendations for
further study and possible
improvements to the
procedure.
Steps of the
Scientific Method
7. Communicate the Results
Communicate the Results: Be
prepared to present the project
to an audience.
Expect questions from the
audience.
Think you can name all
seven steps?
seven steps?
Problem/Question
Problem/Question
Observation/Research
Formulate a Hypothesis
Experiment
Experiment
Collect and Analyze Results
Conclusion
Conclusion
Communicate the Results
Let’s put our knowledge of the
Scientific Method to a realistic
example that includes some of the
terms you’ll be needing to use and
understand.
Problem/Question
John watches his
grandmother bake
bread. He ask his
grandmother what
makes the bread rise.
She explains that yeast
releases a gas as it
feeds on sugar.
Problem/Question
John wonders if the
amount of sugar used
in the recipe will affect
the size of the bread
loaf?
Caution!
Be careful how you use effect and
affect.
Effect is usually a noun and affect, a
verb.
“ The effect of sugar amounts on the
rising of bread.”
“How does sugar affect the rising of
bread?”
Observation/Research
John researches the
areas of baking and
fermentation and tries
to come up with a way
to test his question.
He keeps all of his
information on this
topic in a journal.
John talks with his
teacher and she gives
him a Experimental
Design Diagram to
help him set up his
investigation.
Formulate a Hypothesis
After talking with his
teacher and
conducting further
research, he comes
up with a hypothesis.
“If more sugar is added,
then the bread will rise
higher.”
Hypothesis
The hypothesis is an educated
guess about the relationship
between the independent and
dependent variables.
Note: These variables will be
defined in the next few slides.
Do you know the difference
between the independent
and dependent variables?
Independent Variable
The independent, or
manipulated variable, is a factor
that’s intentionally varied by the
experimenter.
John is going to use 25g., 50g.,
100g., 250g., 500g. of sugar in
his experiment.
Dependent Variable
The dependent, or responding
variable, is the factor that may
change as a result of changes
made in the independent
variable.
In this case, it would be the size
of the loaf of bread.
Experiment
His teacher helps him
come up with a
procedure and list of
needed materials.
She discusses with
John how to
determine the control
group.
Control Group
In a scientific experiment, the
control is the group that serves
as the standard of comparison.
The control group may be a “no
treatment" or an “experimenter
selected” group.
Control Group
The control group is exposed to
the same conditions as the
experimental group, except for
the variable being tested.
All experiments should have a
control group.
Control Group
Because his grandmother
always used 50g. of sugar in
her recipe, John is going to use
that amount in his control
group.
Constants
John’s teacher reminds
him to keep all other
factors the same so
that any observed
changes in the bread
can be attributed to
the variation in the
amount of sugar.
Constants
The constants in an
experiment are all the
factors that the
experimenter attempts
to keep the same.
Can you think of some
constants for this
constants for this
experiment?
experiment?
Constants
They might include:
Other ingredients to the
bread recipe, oven used,
rise time, brand of
ingredients, cooking time,
type of pan used, air
temperature and humidity
where the bread was
rising, oven temperature,
age of the yeast…
Experiment
John writes out his
procedure for his
experiment along with
a materials list in his
journal. He has both of
these checked by his
teacher where she
checks for any safety
concerns.
Trials
Trials refer to replicate
groups that are exposed
to the same conditions
in an experiment.
John is going to test each
sugar variable 3 times.
Collect and Analyze Results
John comes up with
a table he can use
to record his data.
John gets all his
materials together
and carries out his
experiment.
Size of Baked Bread (LxWxH) cm3
Amt. of
Sugar (g.)
1 2 3 Average
Average
Size (cm
Size (cm3
3
)
)
25 768 744 761 758
50 1296 1188 1296 1260
100 1188 1080 1080 1116
250 672 576 588 612
500 432 504 360 432
Size of Bread Loaf (cm
Size of Bread Loaf (cm3
3
)
)
Trials
Trials
Control group
Collect and Analyze Results
John examines his
data and notices that
his control worked
the best in this
experiment, but not
significantly better
than 100g. of sugar.
Conclusion
John rejects his
hypothesis, but
decides to re-test
using sugar
amounts between
50g. and 100g.
Experiment
Once again, John
gathers his materials
and carries out his
experiment.
Here are the results.
Can you tell which group
did the best?
did the best?
Size of Baked Bread (LxWxH) cm3
Amt. of
Sugar (g.)
1 2 3 Average
Average
Size (cm
Size (cm3
3
)
)
50 1296 1440 1296 1344
60 1404 1296 1440 1380
70 1638 1638 1560 1612
80 1404 1296 1296 1332
90 1080 1200 972 1084
Size of Bread Loaf (cm
Size of Bread Loaf (cm3
3
)
)
Trials
Trials
Control group
Conclusion
John finds that 70g.
of sugar produces
the largest loaf.
His hypothesis is
accepted.
Communicate the Results
John tells his
grandmother about
his findings and
prepares to present
his project in
Science class.
Scientific_Method sadfsdafasdfasdfasdf.ppt

Scientific_Method sadfsdafasdfasdfasdf.ppt

  • 2.
    The Scientific Method involvesa series of steps that are used to investigate a natural occurrence.
  • 3.
    We shall takea closer look at these steps and the terminology you will need to understand before you start a science project.
  • 4.
    Problem/Question Observation/Research Formulate a Hypothesis Experiment Collectand Analyze Results Conclusion Communicate the Results
  • 5.
    Steps of the ScientificMethod 1. Problem/Question Problem/Question: Develop a question or problem that can be solved through experimentation.
  • 6.
    Steps of the ScientificMethod 2. Observation/Research Observation/Research: Make observations and research your topic of interest.
  • 7.
    Do you rememberthe Do you remember the next step? next step?
  • 8.
    Steps of the ScientificMethod 3. Formulate a Hypothesis Formulate a Hypothesis: Predict a possible answer to the problem or question. Example: If soil temperatures rise, then plant growth will increase.
  • 9.
    Steps of the ScientificMethod 4. Experiment Experiment: Develop and follow a procedure. Include a detailed materials list. The outcome must be measurable (quantifiable).
  • 10.
    Steps of the ScientificMethod 5. Collect and Analyze Results Collect and Analyze Results: Modify the procedure if needed. Confirm the results by retesting. Include tables, graphs, and photographs.
  • 11.
    Steps of the ScientificMethod 6. Conclusion Conclusion: Include a statement that accepts or rejects the hypothesis. Make recommendations for further study and possible improvements to the procedure.
  • 12.
    Steps of the ScientificMethod 7. Communicate the Results Communicate the Results: Be prepared to present the project to an audience. Expect questions from the audience.
  • 13.
    Think you canname all Think you can name all seven steps? seven steps? Problem/Question Problem/Question Observation/Research Observation/Research Formulate a Hypothesis Formulate a Hypothesis Experiment Experiment Collect and Analyze Results Collect and Analyze Results Conclusion Conclusion Communicate the Results Communicate the Results
  • 14.
    Let’s put ourknowledge of the Scientific Method to a realistic example that includes some of the terms you’ll be needing to use and understand.
  • 15.
    Problem/Question John watches his grandmotherbake bread. He ask his grandmother what makes the bread rise. She explains that yeast releases a gas as it feeds on sugar.
  • 16.
    Problem/Question John wonders ifthe amount of sugar used in the recipe will affect the size of the bread loaf?
  • 17.
    Caution! Be careful howyou use effect and affect. Effect is usually a noun and affect, a verb. “ The effect of sugar amounts on the rising of bread.” “How does sugar affect the rising of bread?”
  • 18.
    Observation/Research John researches the areasof baking and fermentation and tries to come up with a way to test his question. He keeps all of his information on this topic in a journal.
  • 19.
    John talks withhis teacher and she gives him a Experimental Design Diagram to help him set up his investigation.
  • 21.
    Formulate a Hypothesis Aftertalking with his teacher and conducting further research, he comes up with a hypothesis. “If more sugar is added, then the bread will rise higher.”
  • 22.
    Hypothesis The hypothesis isan educated guess about the relationship between the independent and dependent variables. Note: These variables will be defined in the next few slides.
  • 23.
    Do you knowthe difference Do you know the difference between the independent between the independent and dependent variables? and dependent variables?
  • 24.
    Independent Variable The independent,or manipulated variable, is a factor that’s intentionally varied by the experimenter. John is going to use 25g., 50g., 100g., 250g., 500g. of sugar in his experiment.
  • 25.
    Dependent Variable The dependent,or responding variable, is the factor that may change as a result of changes made in the independent variable. In this case, it would be the size of the loaf of bread.
  • 26.
    Experiment His teacher helpshim come up with a procedure and list of needed materials. She discusses with John how to determine the control group.
  • 27.
    Control Group In ascientific experiment, the control is the group that serves as the standard of comparison. The control group may be a “no treatment" or an “experimenter selected” group.
  • 28.
    Control Group The controlgroup is exposed to the same conditions as the experimental group, except for the variable being tested. All experiments should have a control group.
  • 29.
    Control Group Because hisgrandmother always used 50g. of sugar in her recipe, John is going to use that amount in his control group.
  • 30.
    Constants John’s teacher reminds himto keep all other factors the same so that any observed changes in the bread can be attributed to the variation in the amount of sugar.
  • 31.
    Constants The constants inan experiment are all the factors that the experimenter attempts to keep the same.
  • 32.
    Can you thinkof some Can you think of some constants for this constants for this experiment? experiment?
  • 33.
    Constants They might include: Otheringredients to the bread recipe, oven used, rise time, brand of ingredients, cooking time, type of pan used, air temperature and humidity where the bread was rising, oven temperature, age of the yeast…
  • 34.
    Experiment John writes outhis procedure for his experiment along with a materials list in his journal. He has both of these checked by his teacher where she checks for any safety concerns.
  • 35.
    Trials Trials refer toreplicate groups that are exposed to the same conditions in an experiment. John is going to test each sugar variable 3 times.
  • 36.
    Collect and AnalyzeResults John comes up with a table he can use to record his data. John gets all his materials together and carries out his experiment.
  • 37.
    Size of BakedBread (LxWxH) cm3 Amt. of Sugar (g.) 1 2 3 Average Average Size (cm Size (cm3 3 ) ) 25 768 744 761 758 50 1296 1188 1296 1260 100 1188 1080 1080 1116 250 672 576 588 612 500 432 504 360 432 Size of Bread Loaf (cm Size of Bread Loaf (cm3 3 ) ) Trials Trials Control group
  • 38.
    Collect and AnalyzeResults John examines his data and notices that his control worked the best in this experiment, but not significantly better than 100g. of sugar.
  • 39.
    Conclusion John rejects his hypothesis,but decides to re-test using sugar amounts between 50g. and 100g.
  • 40.
    Experiment Once again, John gathershis materials and carries out his experiment. Here are the results.
  • 41.
    Can you tellwhich group Can you tell which group did the best? did the best?
  • 42.
    Size of BakedBread (LxWxH) cm3 Amt. of Sugar (g.) 1 2 3 Average Average Size (cm Size (cm3 3 ) ) 50 1296 1440 1296 1344 60 1404 1296 1440 1380 70 1638 1638 1560 1612 80 1404 1296 1296 1332 90 1080 1200 972 1084 Size of Bread Loaf (cm Size of Bread Loaf (cm3 3 ) ) Trials Trials Control group
  • 43.
    Conclusion John finds that70g. of sugar produces the largest loaf. His hypothesis is accepted.
  • 44.
    Communicate the Results Johntells his grandmother about his findings and prepares to present his project in Science class.