This document discusses many positive feedback loops that could significantly increase global warming due to greenhouse gas emissions. It identifies 41 feedback loops in total, including 27 positive feedback loops that could amplify climate change. These feedback loops are not fully accounted for in climate models, so mitigation plans may fail to sufficiently limit temperature rise. The document argues more research is needed on these feedbacks and accelerated emissions reductions, to minimize climate risks like crossing tipping points.
Tim Lenton - Early warning of climate tipping pointsSTEPS Centre
Presentation at the STEPS Conference 2010 - Pathways to Sustainability: Agendas for a new politics of environment, development and social justice
http://www.steps-centre.org/events/stepsconference2010.html
ArcGIS Pro es la aplicación de escritorio fundamental del profesional del GIS. Una aplicación especialmente diseñada para explotar la Plataforma ArcGIS y con funcionalidad innovadora que la hacen única en el mercado: publicación de Web Maps, creación de cacheados vectoriales, gráficos dinámicos, edición 3D, análisis espaciotemporales, simbología multiescala, funciones ráster, integración con Conda, etc. Ven a esta sesión y descubre las caracterísiticas que hacen que ArcGIS Pro marque la diferencia.
IoT is a new technology that was born a few years ago that based on the internet network which connects all IoT network terminals together to transfer data over the network between terminals (devices) abd take an action according to these data.
5G is a set of emerging global telecommunications standards, generally using high-frequency spectrum, to offer network connectivity with reduced latency and greater speed and capacity relative to its predecessors, most recently 4G LTE (Long-Term Evolution).
Importantly, 5G describes a collection of standards and technologies used to build tomorrow’s cutting-edge network infrastructure. In fact, many of the standards that will be officially considered 5G are still being decided on by working groups like the 3GPP, a collaborative body made up of various telecommunications associations.
While 6G is as yet 10 years away, organizations that keep themselves up to date with what this next networking architecture has to bring to the table will have a decisive advantage over their competitors.
While 5G commercialization is still in its initial stage, it's never too soon to begin planning for 6G on the grounds that it regularly takes around 10 years from the beginning of exploration to commercialization of new generation of communications technology.
Most tech insiders trust 6G would need to hit two or three benchmarks first beginning with a hyper-quick information rate that beats 5G, with download paces of at any rate 1,000Gbps (multiple times the speed of 5G) and record-breaking all-time low latency, or “air latency” of under 100 μs, start to finish (E2E) inertness under 1 ms, and amazingly low delay jitter in order of microseconds.
Technology doesn't rest.
Despite the fact that the 5G Technology is still in the beginning of its arrangement, the tech world is now bantering around thoughts on what the next generation – 6G – might resemble.
This isn't startling on the grounds that the technology that goes into 5G's replacement will set aside some effort to create.
Tonex offers 6G Introduction, IMT-2030, a one-day course covering the planning inspiration and basic technology of 6G engineering, just like the new 6G terminology. Members are familiar with the comparison between 5G and 6G, and understand how 6G achieves its goals by understanding the functions of 6G.
Introduction to 6G Course by Tonex
IMT-2030 is an introduction to 6G, a one-day overview of 6G technology consistent with ITU-T IMT-2030. Learn about 6G wireless systems, use cases, applications, trends, technologies and protocols.
6G or IMT-2030 is the future of mobile networks promised by ITU-T network 2030. Tonex now offers training courses to help develop the next generation of 6G skills.
Who Should Attend
This one-day training course covers the design motivation and basic technology of 6G architecture, as well as new 6G vocabulary. You will also understand the difference between 5G and 6G, and understand how 6G will achieve its goals by observing how 6G works.
An advanced 6G technical overview for anyone involved in 6G product development, product management, analysis, planning, design and engineering.
Learning Objectives
Describe the 6G vision and business case Explain the key technologies and basic components of 6G networks
Draw end-to-end 6G network architecture, including new radio types, core networks and applications
Gradually complete the evolution from 5G to 6G
Course outline
Overview of 6G Wireless Networks
6G Vision, Architecture, and Key Technologies
Hologram Type Communications
Learn More
Introduction to 6G, Prepare Now Training
https://www.tonex.com/introduction-to-6g-prepare-now-training/
A GIS integrated platform for air quality monitoring, analytics, and planning, can accurately predict the PM levels in varied areas within a city. Learn more @ http://giscindia.com/
We can predict soil moisture level and motion of predators.
Irrigation system can be monitored .
Damage caused by predators is reduced.
Increased productivity.
Water conservation.
Profit to farmers.
Climate change tipping points and their implications - downloadablePaul Mahony
Climate change presentation dealing with: the science; tipping points; implications (including insurance); denialism; media reporting; and essential measures.
The impression conveyed in the media of a debate among scientists is not supported by the evidence. The overwhelming majority of climate researchers most actively publishing in the field, concur that the climate is changing rapidly due to human activity.
Urgent and meaningful action is required if we are to avoid runaway climate change, leading to a planet vastly different to the one in which human civilisation has developed.
Internet of Things ( IOT) in AgricultureAmey Khebade
Application of IOT in Agriculture
Monitoring soil moisture and temperature
Controlled irrigation
Efficient usage of input like water, fertilizers, pesticides, etc
Reduced cost of production
Connected greenhouses and stables
Livestock monitoring
Download PPT for better design and animation
Water scarcity nowadays is a big concern for farmers and with this growing population of our country agriculture becomes a serious and main problem that our framers are facing today. The main objective of the project is providing automatic irrigation system that switches a motor pump ONOFF by sensing moisture content of the soil through application of Internet of Things (IOT). Human intervention can be reduced by proper method of irrigation. The project consists of Arduino microcontroller and sensor, where Arduino microcontroller is programmed to receive the input signal of varying moisture condition of the soil through sensor. Once the controller receives these signal, the output then relay on operating the water pump. The sensing arrangement is made up of two metallic rods inserted to the agriculture field which is required to be controlled. Priyanka Lahande | Dr. Basavaraj Mathpathi"IoT Based Smart Irrigation System" Published in International Journal of Trend in Scientific Research and Development (ijtsrd), ISSN: 2456-6470, Volume-2 | Issue-5 , August 2018, URL: http://www.ijtsrd.com/papers/ijtsrd15827.pdf http://www.ijtsrd.com/computer-science/embedded-system/15827/iot-based-smart-irrigation-system/priyanka-lahande
An introductory training on 5G for newbies available on Udemy - http://bit.ly/udemy5G
All our #3G4G5G slides and videos are available at:
Videos: https://www.youtube.com/3G4G5G
Slides: https://www.slideshare.net/3G4GLtd
5G Page: https://www.3g4g.co.uk/5G/
Free Training Videos: https://www.3g4g.co.uk/Training/
“Cosecha de Agua”como medida de adaptación al cambio climático y aumento de ...InfoAndina CONDESAN
Presentación del Programa de Desarrollo Agropecuario Sustentable (PROAGRO-GIZ), realizada el 4 de setiembre de 2013
Encuentro Internacional "Agua: Presente y futuro de la seguridad alimentaria y nutricional en un contexto de cambio climático"
To meet the new connectivity requirements of the emerging IoT segment, 3GPP has taken evolutionary steps on both the network side and the device side. A single technology or solution cannot be ideal to all the different potential IoT applications, market situations and spectrum availability. As a result, the 3GPP standardizing several technologies, including Extended Coverage GSM (EC-GSM), LTE-M and NB-IoT.
LTE-M, NB-IoT and EC-GSM are all superior solutions to meet IoT requirements as a family of solutions, and can complement each other based on technology availability, use case requirements and deployment scenarios. The evolution for these technologies is shown in figure #5. Technical studies and normative work for the support of Machine Type Communication (MTC) as part of 3GPP LTE specifications for RAN began in 3GPP Release 12 and are continuing with the goals of developing features optimized for devices with MTC traffic.
Running Head CLIMATE CHANGE 1CLIMATE CHANGE 1CLIMAT.docxjoellemurphey
Running Head: CLIMATE CHANGE 1
CLIMATE CHANGE 1
CLIMATE CHANGE
Student’s Name
University Affiliation
Climate Change
So there has been an temperature increase on the Earth b 1 degree Farenheit with the past two centuries. Many oblivious persosn would wonder what the big deal is. The one degree being mentioned may appear negligible, but it is actually an extraordinary event in the planet’s history. The preserved and studied Earth’s climate records indicate that the average global temperature has been stable for long periods of time. Furthermore, slight changes in the temperature result in major alterations in the environment.
According to scientific estimations, the environment as we now know it will not be the same in the next 10 years. We should also not forget that the environment is what we depend on fully, not the other way round. As it is, the initiatives to mitigate climate change should first begin with the actions of each and every one at a personal level. Climate change is no longer considered an emerging concern but a lurking catastrophe. This paper seeks to enlighten the reader on climate change, a Geoscience issue that has been the cause of massive research in its various aspects. The paper gains insight on the topic in the most holistic manner possible.
According to other professionals in the field of geology, climate change has been termed as a significant, progressive and lasting alteration in weather’s statistical patterns, noted for periods that range from a decade to millions of ages. Basically, climate change has the potential of being the change in the weather’s average condition or its distribution. The main means that have been used by scientists in understanding the condition’s plight are theoretical and observational. More recently however, there have been improved methods of scrutinizing the situation, through the use of instrumental recordings. Nonetheless, the universally accepted definition of climate change is; the change in climate system’s statistical properties after being considered for a long period of time, where the causes are not regarded.
As a constituent issue, many are unable to distinguish climate and global warming (Giddens, 2009). However, the fault cannot be entirely placed on them as the two are indeed deeply intertwined. I would therefore use this relationship between the two issues to approach both at once. It is common knowledge that climate change is one of the realest threats that our prosperity faces; this being in accordance to a tenfold of research conducted by numerous scientists. Carbon dioxide is among the pollutant gases that contribute to the deterioration of the ozone layer as well as bringing about the greenhouse effect (McKrecher, 2010). Various anthropogenic activities such as deforestation have also been noted as major causes of the progressively increasing climate change. Having stated that, it becomes clear that climate change comes about due to global ...
Electric Utility Risk Management in the Face of Climate RiskMark Trexler
Electric utilities are a key contributor to greenhouse gas emissions, and have been thinking about climate change and climate policy longer than any other sector. This presentation to the Executive Committee of an electric utility in North America walks through the key issues and questions in developing an effective risk management strategy.
The WA must include information (properly cited) from at least one.docxchristalgrieg
The WA must include information (properly cited) from at least one of the assigned discussion readings and must contain information from at least two other references (i.e., a total of at least three references, all properly cited as described below). The course text and web sites can be used in addition to, but not instead of, your two additional references. You must also submit an outline of your paper that includes: title, thesis statement, main concepts to be discussed, and at least two supporting references (cited as described below). The outline should be submitted via Canvas about one week before the WA is due (see class schedule). You are encouraged to discuss assigned readings, but every student must submit an individual essay. The assignment must be written in your own words. Late writing assignments will NOT be accepted.This policy will be strictly enforced.
Your paper should be well-written (spell-checked, logically-structured, coherent, concise, and include proper citations), critical, and imaginative. The format should include an introduction to the topic (including a rationale for why you are writing about the topic, and a thesis statement, wherein you state the point of view you will evaluate (either support or reject). The main body of the paper should contain facts (data) and some assessment of those data (e.g., not enough data, contradictory data, invalid assumptions) and how the problem you are discussing is related to the global environment. Finally, summarize with an evaluation of how the data you discussed led you to support or reject your thesis.
After submitting your first draft, you will receive a grade and comments. Use this feedback to revise and improve your final draft, due two weeks after the first draft (see class schedule). The first and final drafts are worth an equal amount of points – so please do not submit a sloppy first draft or an unrevised final draft. Your final draft grade will NOT replace your first draft grade. You must turn in your graded first draft along with your final draft. Your final draft must be revised and improved based on the suggestions and comments you receive on your first draft. If you submit a final draft that is not revised, or if your revisions do not address any of the comments on your first draft, you will receive a 0.
Your essay should make some progress toward explaining questions such as, (i) Why should anyone in the Central Valley care about El Nino (or desertification or thawing of permafrost)? or (ii) What assumptions were made in developing models of nitrogen cycling (or eutrophication, or greenhouse gas influence on climate change)?, or (iii) How good are the data used to test the hypothesis that global warming is occurring (or animal habitat is lost with desertification, or agricultural nitrogen fertilization leads to anoxia in marine systems)?
Direct quotes must be enclosed in quotation marks and have an authordate citation.
References must be properly cited i ...
The Big Oil Reality Check report finds that the climate pledges and plans of 8 international oil and gas companies fail to align with international agreements to phase out fossil fuels and to limit global temperature rise to 1.5ºC.
Publication May 2021
IEA publication, May 2024
Critical minerals, which are essential for a range of clean energy technologies, have risen up the policy agenda in recent years due to increasing demand, volatile price movements, supply chain bottlenecks and geopolitical concerns. The dynamic nature of the market necessitates greater transparency and reliable information to facilitate informed decision-making, as underscored by the request from Group of Seven (G7) ministers for the IEA to produce medium- and long-term outlooks for critical minerals.
The Global Critical Minerals Outlook 2024 follows the IEA’s inaugural review of the market last year. It provides a snapshot of industry developments in 2023 and early 2024 and offers medium- and long-term outlooks for the demand and supply of key energy transition minerals based on the latest technology and policy trends.
The report also assesses key risks to the reliability, sustainability and diversity of critical mineral supply chains and analyses the consequences for policy and industry stakeholders. It will be accompanied by an updated version of the Critical Minerals Data Explorer, an interactive online tool that allows users to explore the latest IEA projections.
Science Publication
Global projections of macroeconomic climate-change damages typically consider
impacts from average annual and national temperatures over long time horizons1–6
.
Here we use recent empirical fndings from more than 1,600 regions worldwide over
the past 40 years to project sub-national damages from temperature and precipitation,
including daily variability and extremes7,8
. Using an empirical approach that provides
a robust lower bound on the persistence of impacts on economic growth, we fnd that
the world economy is committed to an income reduction of 19% within the next
26 years independent of future emission choices (relative to a baseline without
climate impacts, likely range of 11–29% accounting for physical climate and empirical
uncertainty). These damages already outweigh the mitigation costs required to limit
global warming to 2 °C by sixfold over this near-term time frame and thereafter diverge
strongly dependent on emission choices. Committed damages arise predominantly
through changes in average temperature, but accounting for further climatic
components raises estimates by approximately 50% and leads to stronger regional
heterogeneity. Committed losses are projected for all regions except those at very
high latitudes, at which reductions in temperature variability bring benefts. The
largest losses are committed at lower latitudes in regions with lower cumulative
historical emissions and lower present-day income.
Science Publication: The atlas of unburnable oil for supply-side climate poli...Energy for One World
Nature Communication, Publication 2024
To limit the increase in global mean temperature to 1.5 °C, CO2 emissions must
be drastically reduced. Accordingly, approximately 97%, 81%, and 71% of
existing coal and conventional gas and oil resources, respectively, need to
remain unburned. This article develops an integrated spatial assessment
model based on estimates and locations of conventional oil resources and
socio-environmental criteria to construct a global atlas of unburnable oil. The
results show that biodiversity hotspots, richness centres of endemic species,
natural protected areas, urban areas, and the territories of Indigenous Peoples
in voluntary isolation coincide with 609 gigabarrels (Gbbl) of conventional oil
resources. Since 1524 Gbbl of conventional oil resources are required to be left
untapped in order to keep global warming under 1.5 °C, all of the above-
mentioned socio-environmentally sensitive areas can be kept entirely off-
limits to oil extraction. The model provides spatial guidelines to select
unburnable fossil fuels resources while enhancing collateral socio-
environmental benefits.
Up the Ratios Bylaws - a Comprehensive Process of Our Organizationuptheratios
Up the Ratios is a non-profit organization dedicated to bridging the gap in STEM education for underprivileged students by providing free, high-quality learning opportunities in robotics and other STEM fields. Our mission is to empower the next generation of innovators, thinkers, and problem-solvers by offering a range of educational programs that foster curiosity, creativity, and critical thinking.
At Up the Ratios, we believe that every student, regardless of their socio-economic background, should have access to the tools and knowledge needed to succeed in today's technology-driven world. To achieve this, we host a variety of free classes, workshops, summer camps, and live lectures tailored to students from underserved communities. Our programs are designed to be engaging and hands-on, allowing students to explore the exciting world of robotics and STEM through practical, real-world applications.
Our free classes cover fundamental concepts in robotics, coding, and engineering, providing students with a strong foundation in these critical areas. Through our interactive workshops, students can dive deeper into specific topics, working on projects that challenge them to apply what they've learned and think creatively. Our summer camps offer an immersive experience where students can collaborate on larger projects, develop their teamwork skills, and gain confidence in their abilities.
In addition to our local programs, Up the Ratios is committed to making a global impact. We take donations of new and gently used robotics parts, which we then distribute to students and educational institutions in other countries. These donations help ensure that young learners worldwide have the resources they need to explore and excel in STEM fields. By supporting education in this way, we aim to nurture a global community of future leaders and innovators.
Our live lectures feature guest speakers from various STEM disciplines, including engineers, scientists, and industry professionals who share their knowledge and experiences with our students. These lectures provide valuable insights into potential career paths and inspire students to pursue their passions in STEM.
Up the Ratios relies on the generosity of donors and volunteers to continue our work. Contributions of time, expertise, and financial support are crucial to sustaining our programs and expanding our reach. Whether you're an individual passionate about education, a professional in the STEM field, or a company looking to give back to the community, there are many ways to get involved and make a difference.
We are proud of the positive impact we've had on the lives of countless students, many of whom have gone on to pursue higher education and careers in STEM. By providing these young minds with the tools and opportunities they need to succeed, we are not only changing their futures but also contributing to the advancement of technology and innovation on a broader scale.
This session provides a comprehensive overview of the latest updates to the Uniform Administrative Requirements, Cost Principles, and Audit Requirements for Federal Awards (commonly known as the Uniform Guidance) outlined in the 2 CFR 200.
With a focus on the 2024 revisions issued by the Office of Management and Budget (OMB), participants will gain insight into the key changes affecting federal grant recipients. The session will delve into critical regulatory updates, providing attendees with the knowledge and tools necessary to navigate and comply with the evolving landscape of federal grant management.
Learning Objectives:
- Understand the rationale behind the 2024 updates to the Uniform Guidance outlined in 2 CFR 200, and their implications for federal grant recipients.
- Identify the key changes and revisions introduced by the Office of Management and Budget (OMB) in the 2024 edition of 2 CFR 200.
- Gain proficiency in applying the updated regulations to ensure compliance with federal grant requirements and avoid potential audit findings.
- Develop strategies for effectively implementing the new guidelines within the grant management processes of their respective organizations, fostering efficiency and accountability in federal grant administration.
Many ways to support street children.pptxSERUDS INDIA
By raising awareness, providing support, advocating for change, and offering assistance to children in need, individuals can play a crucial role in improving the lives of street children and helping them realize their full potential
Donate Us
https://serudsindia.org/how-individuals-can-support-street-children-in-india/
#donatefororphan, #donateforhomelesschildren, #childeducation, #ngochildeducation, #donateforeducation, #donationforchildeducation, #sponsorforpoorchild, #sponsororphanage #sponsororphanchild, #donation, #education, #charity, #educationforchild, #seruds, #kurnool, #joyhome
Canadian Immigration Tracker March 2024 - Key SlidesAndrew Griffith
Highlights
Permanent Residents decrease along with percentage of TR2PR decline to 52 percent of all Permanent Residents.
March asylum claim data not issued as of May 27 (unusually late). Irregular arrivals remain very small.
Study permit applications experiencing sharp decrease as a result of announced caps over 50 percent compared to February.
Citizenship numbers remain stable.
Slide 3 has the overall numbers and change.
Russian anarchist and anti-war movement in the third year of full-scale warAntti Rautiainen
Anarchist group ANA Regensburg hosted my online-presentation on 16th of May 2024, in which I discussed tactics of anti-war activism in Russia, and reasons why the anti-war movement has not been able to make an impact to change the course of events yet. Cases of anarchists repressed for anti-war activities are presented, as well as strategies of support for political prisoners, and modest successes in supporting their struggles.
Thumbnail picture is by MediaZona, you may read their report on anti-war arson attacks in Russia here: https://en.zona.media/article/2022/10/13/burn-map
Links:
Autonomous Action
http://Avtonom.org
Anarchist Black Cross Moscow
http://Avtonom.org/abc
Solidarity Zone
https://t.me/solidarity_zone
Memorial
https://memopzk.org/, https://t.me/pzk_memorial
OVD-Info
https://en.ovdinfo.org/antiwar-ovd-info-guide
RosUznik
https://rosuznik.org/
Uznik Online
http://uznikonline.tilda.ws/
Russian Reader
https://therussianreader.com/
ABC Irkutsk
https://abc38.noblogs.org/
Send mail to prisoners from abroad:
http://Prisonmail.online
YouTube: https://youtu.be/c5nSOdU48O8
Spotify: https://podcasters.spotify.com/pod/show/libertarianlifecoach/episodes/Russian-anarchist-and-anti-war-movement-in-the-third-year-of-full-scale-war-e2k8ai4
Jennifer Schaus and Associates hosts a complimentary webinar series on The FAR in 2024. Join the webinars on Wednesdays and Fridays at noon, eastern.
Recordings are on YouTube and the company website.
https://www.youtube.com/@jenniferschaus/videos
Science Publication: Many Risky Feedback Loops amplify the need for Climate Action
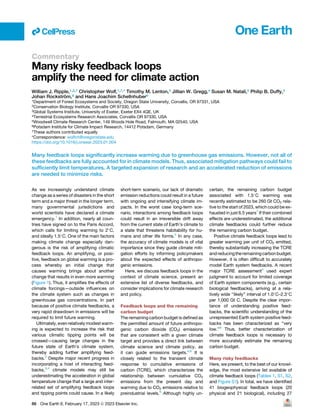
1. Commentary
Many risky feedback loops
amplify the need for climate action
William J. Ripple,1,2,7 Christopher Wolf,1,7,* Timothy M. Lenton,3 Jillian W. Gregg,4 Susan M. Natali,5 Philip B. Duffy,5
Johan Rockström,6 and Hans Joachim Schellnhuber6
1Department of Forest Ecosystems and Society, Oregon State University, Corvallis, OR 97331, USA
2Conservation Biology Institute, Corvallis OR 97330, USA
3Global Systems Institute, University of Exeter, Exeter EX4 4QE, UK
4Terrestrial Ecosystems Research Associates, Corvallis OR 97330, USA
5Woodwell Climate Research Center, 149 Woods Hole Road, Falmouth, MA 02540, USA
6Potsdam Institute for Climate Impact Research, 14412 Potsdam, Germany
7These authors contributed equally
*Correspondence: wolfch@oregonstate.edu
https://doi.org/10.1016/j.oneear.2023.01.004
Many feedback loops significantly increase warming due to greenhouse gas emissions. However, not all of
these feedbacks are fully accounted for in climate models. Thus, associated mitigation pathways could fail to
sufficiently limit temperatures. A targeted expansion of research and an accelerated reduction of emissions
are needed to minimize risks.
As we increasingly understand climate
change as a series of disasters in the short
term and a major threat in the longer term,
many governmental jurisdictions and
world scientists have declared a climate
emergency.1
In addition, nearly all coun-
tries have signed on to the Paris Accord,
which calls for limiting warming to 2
C,
and ideally 1.5
C. One of the main factors
making climate change especially dan-
gerous is the risk of amplifying climatic
feedback loops. An amplifying, or posi-
tive, feedback on global warming is a pro-
cess whereby an initial change that
causes warming brings about another
change that results in even more warming
(Figure 1). Thus, it amplifies the effects of
climate forcings—outside influences on
the climate system such as changes in
greenhouse gas concentrations. In part
because of positive climate feedbacks, a
very rapid drawdown in emissions will be
required to limit future warming.
Ultimately, evenrelatively modest warm-
ing is expected to increase the risk that
various climatic tipping points will be
crossed—causing large changes in the
future state of Earth’s climate system,
thereby adding further amplifying feed-
backs.2
Despite major recent progress in
incorporating a host of interacting feed-
backs,3,4
climate models may still be
underestimating the acceleration in global
temperature change that a large and inter-
related set of amplifying feedback loops
and tipping points could cause. In a likely
short-term scenario, our lack of dramatic
emission reductions could result in a future
with ongoing and intensifying climate im-
pacts. In the worst case long-term sce-
nario, interactions among feedback loops
could result in an irreversible drift away
from the current state of Earth’s climate to
a state that threatens habitability for hu-
mans and other life forms.5
In any case,
the accuracy of climate models is of vital
importance since they guide climate miti-
gation efforts by informing policymakers
about the expected effects of anthropo-
genic emissions.
Here, we discuss feedback loops in the
context of climate science, present an
extensive list of diverse feedbacks, and
consider implications for climate research
and policy.
Feedback loops and the remaining
carbon budget
The remaining carbon budget is defined as
the permitted amount of future anthropo-
genic carbon dioxide (CO2) emissions
that are consistent with a given climate
target and provides a direct link between
climate science and climate policy, as
it can guide emissions targets.4,6
It is
closely related to the transient climate
response to cumulative emissions of
carbon (TCRE), which characterizes the
relationship between cumulative CO2
emissions from the present day and
warming due to CO2 emissions relative to
preindustrial levels.6
Although highly un-
certain, the remaining carbon budget
associated with 1.5
C warming was
recently estimated to be 260 Gt CO2 rela-
tive to the start of 2023, which could be ex-
hausted in just 6.5 years7
If their combined
effects are underestimated, the additional
climate feedbacks could further reduce
the remaining carbon budget.
Positive climate feedback loops lead to
greater warming per unit of CO2 emitted,
thereby substantially increasing the TCRE
andreducingtheremainingcarbonbudget.
However, it is often difficult to accurately
model Earth system feedbacks. A recent
major TCRE assessment4
used expert
judgment to account for limited coverage
of Earth system components (e.g., certain
biological feedbacks), arriving at a rela-
tively wide ‘‘likely’’ interval of 1.0
C–2.3
C
per 1,000 Gt C. Despite the clear impor-
tance of understanding positive feed-
backs, the scientific understanding of the
unrepresented Earth system positive feed-
backs has been characterized as ‘‘very
low.’’6
Thus, better characterization of
climate feedback loops is necessary to
more accurately estimate the remaining
carbon budget.
Many risky feedbacks
Here, we present, to the best of our knowl-
edge, the most extensive list available of
climate feedback loops (Tables 1, S1, S2,
and Figure S1). In total, we have identified
41 biogeophysical feedback loops (20
physical and 21 biological), including 27
ll
86 One Earth 6, February 17, 2023 ª 2023 Elsevier Inc.
2. positive (reinforcing) feedback loops, 7
negative (balancing) feedback loops, and
7 uncertain feedback loops (Tables 1 and
S1). We obtained feedback strengths for
17 of these loops, including 13 strengths
in standard units of W/m2
/K (Table S1 and
FigureS2).Physicalfeedbackloopsinvolve
primarily abiotic systems. For example,
warming in the Arctic leads to melting
sea ice, which leads to further warming
because water has lower albedo (reflec-
tance) than ice (Figure S3). In contrast, bio-
logical loops involve the biosphere in some
way.Forinstance,increasingtemperatures
lead to permafrost thawing, which pro-
duces CO2 and methane (CH4) emissions,
which in turn leads to further increasing
temperatures, and so on (Figure S3). Note
that biological loops can also involve phys-
ical components. Because some loops
were discovered relatively recently, we
expect additional feedback loops to be
described in the near future, especially in
the biological category where many com-
plex interactions are possible. Given that
most of the feedback loops we identified
are positive, it seems likely that many un-
known feedbacks are also positive. Collec-
tively, these additional loops could mean
that the remaining carbon budget has
been overestimated, in which case pro-
posed mitigation pathways may be inade-
quate and net zero (human) emissions
may need to be achieved more quickly
than anticipated.6
While climate feed-
backs, the TCRE, and carbon budgets
have been partially constrained using his-
torical and paleo-climate data,4
this does
not diminish the importance of further
research. In particular, we are now seeing
greenhouse gas levels that have not
occurred in several million years, and we
lack the paleo data to understand carbon-
climate and social feedbacks on a much
warmer and more carbon-rich planet.8
Greenhouse gas emissions have been
growing rapidly during the last century,
despite several decades of warnings
from scientists that emissions must be
greatly reduced. Moreover, because
climate feedbacks can interact with each
other and exhibit temperature depen-
dence9,10
and non-linearities, currently
weak feedbacks have the potential to
become stronger, following warming
driven by other feedback loops. In a grim
scenario, interacting feedback loops
could result in a sequence of climate
tipping points being exceeded,5,11
pro-
ducing ‘‘climate cascades,’’ whereby the
net effect of reinforcing feedbacks is
greater than the sum of their individual ef-
fects under current conditions.
ow cover albedo Sea ice albedo Permafrost thawing
Peatlands smoldering
Forest dieback
Insect outbreaks
A B
C
D
E
F
G
H
I
Figure 1. Map of feedback loops
(A–I) The map shows example locations where select positive feedback loops are likely operating. The full extent of the area and locations impacted by each
feedback loop are not depicted. Feedback loop summaries: (A) sea ice melting or not forming / decreasing albedo; (B) increasing thawing and decomposition
/ increasing CO2 and CH4 emissions, loss of sequestration; (C) drying and increasing vulnerability to fire/smoldering, decreasing soil organic carbon /
increasing release of CO2 into the atmosphere and decreasing carbon sequestration; (D) increasing fire frequency and/or severity / increasing CO2 emissions,
loss of sequestration, change in albedo; (E) changing cloud distribution and optical properties / altered cloud albedo and greenhouse effect; (F) increasing
chronic aridification and hotter drought stress extremes leading to expanding deserts / decreasing CO2 sequestration, and increasing albedo; (G) dieback of
Amazon, boreal, and other forests / loss of sequestration, change in albedo, decreasing evapotranspiration; (H) changing insect distributions and abundances,
decreased host tree defense / loss of sequestration, change in albedo; (I) decreasing snow cover / decreasing albedo. See Table S1 for further feedback loop
details. Photo credits (also given in Table S3): (A) Patrick Kelley, CC BY 2.0; (B) Boris Radosavljevic, CC BY 2.0; (C) NASA’s Earth Observatory, CC BY 2.0; (D)
Nick-D, CC BY-SA 4.0; (E) Doggo19292, Public Domain; (F) David Stanley, CC BY 2.0; (G) NASA/JPL-Caltech, (H) Jonhall, CC BY 3.0, (I) Natalia_Kollegova,
Pixabay License.
Commentary
One Earth 6, February 17, 2023 87
ll
3. Table 1. Summary list of feedback loops
Feedback Effect of climate change Effect on climate change +/
20 physical feedback loops
1. Plancky
[ Temperature [ Heat loss (radiation) –
2. Water vapory
[ Increasing water vapor
content
[ Greenhouse effect +
3. Sea ice albedo*y
[ Sea ice melting or not forming Y Albedo +
4. Ice sheets*yz
[ Glacier ice sheet melting/
instability
Y Albedo +
5. Sea level risez
[ Sea levels Y Albedo ([ coastal
submergence)
+
6. Snow covery
Y Snow cover Y Albedo +
7. Cloudsy
D Cloud distribution optical
properties
D Cloud albedo greenhouse
effect
+
8. Dusty
D Dust aerosol abundance D Albedo greenhouse effect ?
9. Other aerosolsy
D Atmos. aerosol conc. D Albedo greenhouse effect ?
10. Ocean stratification [ Ocean stratification Y Carbon uptake by ocean +
11. Ocean circ.* Y Ocean circ. D Surface temperature ?
12. Solubility pumpy
[ Atmos. CO2 levels Y CO2 absorption by ocean +
13. CH4 hydrates*z
[ CH4 hydrate dissociation rates [ Release of CH4 into atmos. +
14. Lapse ratey
D Temp.-altitude relationships Y Global mean temperature –
15. Ice-elevationz
Y Ice sheet/glacier elevation [ Glacier ice sheet melting,
Y albedo
+
16. Antarctic rainfallz
Y Ice sheet extent,
[ precipitation
Y Albedo, [ deep ocean
warming
+
17. Sea ice growth Y Sea ice thickness, Y insulation [ Thin ice growth rate –
18. Ozoney
D Atmos. circ. Y Tropical lower
stratospheric ozone
?
19. Atmos. reactionsy
D Atmos. chem. reaction rates D Greenhouse effect ?
20. Chem. weatheringz
[ Chemical weathering rates [ CO2 taken out of atmosphere –
21 biological feedback loops
21. Peatlandsy
[ Drying and fire, Y Soil carbon [ Release of CO2 into atmos. +
22. Wetlandsy
[ Wetlands area ([ precipitation) [ CO2 seq., [ CH4 emissions +
23. Freshwater [ Aquatic plant growth rates [ CH4 emissions +
24. Forest dieback* [ Amazon and other forest
dieback
Y CO2 seq., D albedo +
25. Northern greening [ Boreal forest area, Arctic
vegetation
[ CO2 seq., Y albedo +
26. Insects D Insect ranges and abundances Y CO2 seq., D albedo +
27. Wildfirey
[ Fire activity in some regions [ CO2 emissions, D albedo +
28. BVOCsy
D BVOC emission rates Y Greenhouse effect,
[ tropospheric O3
–
29. Soil carbon (other) [ Loss of soil carbon [ CO2 emissions +
30. Soil nitrous oxidey
D Soil microbial activity [ Nitrous oxide emissions +
31. Permafrost*y
[ Permafrost thawing [ CO2 and CH4 emissions +
32. Soil and plant ET [ ET from soils and plants Y Latent heat flux +
33. Microbes (other) [ Microbial respiration rates [ CO2 and CH4 emissions +
34. Plant stress [ Thermal stress, [ droughts [ Plant mortality, Y CO2 seq. +
35. Desertification [ Desert area Y CO2 seq., D albedo +
36. Sahara/Sahel greening* [ Rainfall in Sahara and Sahel [ CO2 seq. by vegetation –
37. CO2 fertilization [ CO2 conc., [ NPP [ Carbon uptake by vegetation –
38. Coastal productivity [ Coastal ecosystem
degradation
Y Coastal ecosystem
carbon seq.
+
(Continued on next page)
Commentary
88 One Earth 6, February 17, 2023
ll
4. Some feedback loops may be associ-
ated with key tipping points (Tables 1
and S1) that could profoundly disrupt the
global climate system and biosphere
once critical thresholds are crossed.
Although it has been argued that most of
these tipping points are not expected to
drive large positive feedbacks, there is
deep uncertainty associated with unlikely
but extreme feedbacks and tipping
points.4
Specific concerns include slow-
ing of ocean circulation and the large-
scale loss of ice sheets, permafrost, and
forests.2
In the worst case, if positive
feedbacks are sufficiently strong, this
could result in tragic climate change
outside the control of humans.5
Based on our compilation of numerous
and potentially risky climate warming
feedback loops, we call for immediate
concurrent changes to both (1) climate
research and (2) climate policy, which
should strategically inform and guide
each other.
Climate research
While we applaud the significant accom-
plishments of feedback researchers to
date, we believe an immediate and
massive international mobilization must
occur to advance climate science with
an increase in research priorities and
funding to quickly get the impacts and in-
teractions of feedbacks better assessed
in the context of the remaining carbon
budget. We call for a faster transition to-
ward integrated Earth system science
because the climate system can only be
understood by integrating the functioning
and state of all Earth system interac-
tions.12
For example, an Earth system
science approach can provide informa-
tion on both mitigation pathways that
minimize risks associated with climate
feedbacks and the societal transforma-
tions needed to pursue these trajectories.
This will give policymakers better and
more usable scientific information, which
is needed to manage risks associated
with the climate emergency.
More research is needed to incorporate
the mechanisms and processes of diverse
feedback loops into climate models, espe-
cially biological feedback loops. These
have received comparatively little attention
and are often grouped together as ‘‘unrep-
resented feedback mechanisms.’’3,6,13
Therefore,weproposethatfeedbackloops
and tipping points as well as their possible
combined severe consequences (e.g., po-
tential runaway dynamics) receive more
attention, for example, as an IPCC special
report. Biological feedback loops involving
forest dieback, loss of soil carbon, thawing
permafrost, drying and smoldering peat-
lands, and the changing ocean biological
pump are highly uncertain and may be
large. Developing a better understanding
of these and other feedbacks will require
large-scale funding and collaboration to
coordinate data collection and synthesis
efforts.
As part of an Earth system approach,
more research is also needed to identify,
quantify,andintegratethemyriadofhuman
feedbacks (Table S2), which is compli-
cated by the inherent uncertainty in the
social system.14
Because they involve
complex social and economic systems, it
is important that analyses of human feed-
backs be conducted in an interdisciplinary
fashion, including researchers from the so-
cial sciences in all stages of the process.15
Overall, insight into the complex trajec-
tories that tie physical, biological, and so-
cial feedbacks together may be gained
through various methods. Promising ap-
proaches include simulations that can
reflect the behavior of complex adaptive
systems and artificial intelligence-based
network analysis of the matrix of feedback
loop interactions. Such insights will likely
be needed to make progress on two major
challenges facing Earth system science:
assessing the stability and resiliency of
the Earth system and fully integrating bio-
physical and human dynamics.12
Climate policy
Individual countries are not even close to
being on track to achieve the Paris emis-
sions reduction pledges that were not
enough to meet the insufficient Paris
2.0
C upper limit warming target and are
now distressingly inadequate to meet
the later 1.5
C warming limit.16
Worse still,
researchers have recently raised the likely
minimum equilibrium warming associated
with atmospheric CO2 doubling from
1.5
C (Stocker et al.17
) to a more devas-
tating 2.5
C (IPCC4
). With these troubling
developments in mind, we make two
arguments for immediate and massive re-
ductions in emissions. First, we suggest
that further small increases in short-term
warming are a big risk, considering the
suffering that we are already experiencing
from climate disasters of ‘‘unprece-
dented’’ wildfires, intense storms, coastal
flooding, permafrost thaw, and extreme
Table 1. Continued
Feedback Effect of climate change Effect on climate change +/
39. Metabolic rates [ Phytoplankton
respiration rates
[ CO2 released into atmos. +
40. Ocean bio. [ Ocean CO2, [ acidification,
[ temp.
D Ocean carbon sink ?
41. Phytoplankton-DMSy
D Plankton DMS emissions D Cloud albedo ?
Loops are divided into two categories: physical (loop numbers 1–20) and biological (loop numbers 21–41). The rightmost column shows the loop di-
rection (‘‘+’’: reinforcing, ‘‘-’’: balancing, ‘‘?’’: uncertain). Feedback loops that involve potential tipping elements are marked with asterisks (*; see sup-
plemental experimental procedures). As a rough indicator of feedbacks that are more likely to be at least partly included in some climate models, loops
that are covered in Figure TS.17 (feedbacks overview) or 5.29 (biogeochemical feedbacks) of IPCC4
are marked with daggers (y). Many of these feed-
backs will have significant effects on Earth’s climate, but others are more speculative and possibly negligible. Feedback impacts operate on time
scales ranging from short (e.g., months/years) to very long (e.g., millennia); feedbacks we believe to be exceptionally slow are marked with double
daggers (z). Symbols indicate increasing ([), decreasing (Y), and changing (D), and abbreviations correspond to circulation (circ.), concentration
(conc.), temperature (temp.), atmospheric (atmos.), chemical (chem.), sequestration (seq.), biogenic volatile organic compounds (BVOCs), ozone
(O3), evapotranspiration (ET), biological pump (bio.), and dimethyl sulfide (DMS). See supplemental experimental procedures and Table S1 for com-
plete loop descriptions, grouping order, limitations (e.g., overlapping loops and uncertain tipping elements), and selected references.
Commentary
One Earth 6, February 17, 2023 89
ll
5. weather that have occurred with just
1.1
C to 1.2
C global average warming.
Second, as part of a longer timeline,
positive feedback loops and tipping
points may pose a major threat. Given
the potential for catastrophic climate
change and the lack of complete scientific
understanding to date, policymakers
should strongly consider the potentially
dangerous effects of feedback loops,
tipping points, and climate cascades,
even if all desired scientific data are not
available at this time.
Transformative and sociallyjustchanges
in global energy and transportation, short-
lived air pollution, food production, nature
preservation, and the international econ-
omy, together with population policies
based on education and equality, are
required to address this immense problem
in both the short and the long term.1
Many
of these changes will require significant
time, research, and political support to fully
carry out. However, reductions in warming
due to mitigating methane and other short-
lived pollutant emissions can be achieved
rapidly. Equitable policies and funding
are also needed to support climate
adaptations in less wealthy regions where
knock-on effects of feedbacks or second-
ary feedback loop effects are particularly
dangerous.
The remaining carbon budget is rapidly
shrinking and waiting until 2050 to
achieve net-zero carbon emissions might
be far too late.13
The gap between pro-
jected emissions (assuming 2030 mitiga-
tion pledges are met) and emissions
consistent with 1.5
C is very large, and
time is running out to avoid the worst ef-
fects of climate change.16
Specifically,
the gap is roughly 23 Gt CO2e per year
in 2030 for 1.5
C.16
Therefore, shortened
timelines for carbon neutrality (before
2050), and more ambitious emissions
drawdown with near-term requirements
should be swiftly implemented as a
response to this emissions gap. Large
natural carbon sinks are also critical, but
they must be established strategically
with relevant biological feedback loops
in mind.
Summary
The first step in curbing the near-term
climate impacts and minimizing the risk
of an eventual catastrophic outcome is
for us to expand our awareness of the
severity of our predicament.18
Thus, we
have described an extensive set of poten-
tially harmful feedback loops to increase
our understanding, justify a more serious
response, and motivate work into less
probable but dangerously underexplored
scenarios.18
It is too late to fully prevent the pain of
climate change as severe impacts are
already being felt, but if we can have a
much better understanding of feedback
loops and make the needed transforma-
tive changes soon while prioritizing basic
human needs, there might still be time to
limit the harm. Even if it turns out that
feedbacks are already sufficiently charac-
terized, these changes will provide enor-
mous benefits to human well-being and
the entire biosphere. Conversely, if the
worst-case risks posed by feedback
loops and tipping points have been
underestimated, the future of a hospitable
planet Earth may be at stake.
EXPERIMENTAL PROCEDURES
Resource availability
Lead contact
Further information and requests should be
directed to and will be fulfilled by the co-lead con-
tacts, Christopher Wolf (wolfch@oregonstate.edu)
and William Ripple (bill.ripple@oregonstate.edu).
Materials availability
This study did not generate new unique materials.
Data and code availability
All data associated with the paper are provided in
the Supplemental Information. This paper does
not report original code.
Summary of experimental procedures
Here, we provide a summary of the experimental
procedures used to construct the tables of feed-
back loops (Table 1 and S1). Please see the Sup-
plemental Experimental Procedure section for
more detail, including limitations.
We compiled an initial set of climate feedback
loops by performing a literature review using
computerized searches. We considered standard
research articles and also review papers dealing
with feedback loops. We also examined references
cited by these papers.
We grouped the feedback loops into three gen-
eral categories: Physical (abiotic), Biological, and
Human, and we identified feedback loop ‘‘types,’’
which correspond to subcategories.
Because of the complexity of social systems, the
human feedback loops may be speculative in na-
ture and difficult to quantify. So, we present these
possible feedback loops separately from the phys-
ical and biological loops. These human loops are
intended as examples only, and this list is not
intended to be exhaustive.
We only considered feedbacks to global temper-
ature, excluding internal feedbacks. For each
climate feedback loop, we identified two pro-
cesses: the ‘‘effect of climate change’’ and the ‘‘ef-
fect on climate change.’’ For example, warming in
the Arctic causes ice to melt (effect of climate
change) and melting ice in turn leads to further
warming by decreasing albedo (effect on climate
change). We also categorized each loop as posi-
tive, negative, or uncertain direction. Lastly, we
determined estimates of feedback loop strengths
where possible. Feedback strengths are quantified
in a number of ways, although units of W/m2
/K are
standard. When available, we included uncertainty
estimates associated with strengths (e.g., stan-
dard errors).
Although each feedback loop differs from the
others in either the ‘‘effect of climate change,’’ or
the ‘‘effect on climate change,’’ there may be over-
laps among some groups of feedback loops. Given
that these feedback loops can involve many
complex and interacting systems, we viewed
some degree of overlap as unavoidable. We used
footnotes to indicate occurrences of partial overlap
(see Table S1). The strength estimates are gener-
ally separate and additive, except in cases of
overlapping feedback loops. In our feedback loops
tables, we included loops that vary in strength over
time, many of which could eventually weaken.
Likely examples include permafrost (limited capac-
ity to emit greenhouse gases), sea ice (eventually,
there may be no sea ice), and forest dieback (even-
tually, large forested areas could be fully converted
to other ecosystem types, possibly halting this
process).
The focus of our table is on feedback loops.
However, climate tipping elements and tipping
points are related concepts that are of major
importance to the Earth system. Therefore, we
identified the feedback loops in our table that might
involve tipping elements.
After constructing the preliminary tables of
feedback loops, we then had them reviewed by
more than twenty climate feedback experts (see
main paper acknowledgments section). These ex-
perts were typically authors of feedback loop pa-
pers that we cited. We invited them to propose
modifications to our tables of feedback loops,
such as adding or removing loops, improving
loop descriptions, or proposing additional refer-
ences to cite.
SUPPLEMENTAL INFORMATION
Supplemental information can be found online at
https://doi.org/10.1016/j.oneear.2023.01.004.
ACKNOWLEDGMENTS
We thank the following climate feedback special-
ists for reviewing an early draft of our feedback
loops Table 1, S1, and S2: Craig Allen, Bojana Baj-
zelj, Josep Canadell, Thomas Crowther, Joshua
Dean, Ove Hoegh-Guldberg, Lee Kump, Michael
E. Mann, Kate Marvel, Nick Obradovich, Frank Pat-
tyn, Francesco S. R. Pausata, David Romps, Chris-
tina Sch€
adel, Ted Schuur, and Detlef van Vuuren.
Contributing reviewers of a draft of this paper
include Susan Christie, Thomas H. DeLuca, Piers
Forster, Chris Huntingford, Charles Koven, Karen
Shell, and Steven Sherwood. Partial funding for
the project was provided by Roger Worthington.
REFERENCES
1. Ripple, W.J., Wolf, C., Newsome, T.M.,
Barnard, P., and Moomaw, W.R. (2019).
World scientists’ warning of a climate emer-
gency. Bioscience 70, 8–12. https://doi.org/
10.1093/biosci/biz088.
2. Lenton, T.M., Rockstrom, J., Gaffney, O.,
Rahmstorf, S., Richardson, K., Steffen, W., and
Commentary
90 One Earth 6, February 17, 2023
ll
6. Schellnhuber, H.J. (2019). Climate tipping
points—too risky to bet against. Nature 575,
592–595. https://doi.org/10.1038/d41586-019-
03595-0.
3. Sherwood, S.C., Webb, M.J., Annan, J.D.,
Armour, K.C., Forster, P.M., Hargreaves, J.C.,
Hegerl, G., Klein, S.A., Marvel, K.D., Rohling,
E.J., et al. (2020). An assessment of Earth’s
climate sensitivity using multiple lines of evi-
dence. Rev. Geophys. 58, e2019RG000678.
https://doi.org/10.1029/2019RG000678.
4. IPCC (2021). In Climate Change 2021: The
Physical Science Basis. Contribution of
Working Group I to the Sixth Assessment
Report of the Intergovernmental Panel on
Climate Change [Masson-Delmotte, V., P.
Zhai, A. Pirani, S.L. Connors, C. Péan, S.
Berger, N. Caud, Y. Chen, L. Goldfarb, M.I.
Gomis, and M. Huang, et al., eds. (Cambridge
University Press). https://doi.org/10.1017/978
1009157896.
5. Steffen, W., Rockstrom, J., Richardson, K.,
Lenton, T.M., Folke, C., Liverman, D.,
Summerhayes, C.P., Barnosky, A.D., Cornell,
S.E., Crucifix, M., et al. (2018). Trajectories of
the earth system in the Anthropocene. Proc.
Natl. Acad. Sci. USA. 115, 8252–8259. https://
doi.org/10.1073/pnas.181014111.
6. Rogelj, J., Forster, P.M., Kriegler, E., Smith,
C.J., and Séférian, R. (2019). Estimating and
tracking the remaining carbon budget for strin-
gent climate targets. Nature 571, 335–342.
https://doi.org/10.1038/s41586-019-1368-z.
7. Forster,P.,Rosen,D.,Lamboll,R.,andRogelj,J.
(2022). Guest post: what the tiny remaining 1.5C
carbonbudgetmeans for climate policy.Carbon
Brief. https://www.carbonbrief.org/guest-post-
what-the-tiny-remaining-1-5c-carbon-budget-
means-for-climate-policy/.
8. Mann, M.E. (2021). Beyond the hockey stick:
climate lessons from the Common Era. Proc.
Natl. Acad. Sci. USA. 118. e2112797118.
https://doi.org/10.1073/pnas.2112797118.
9. Bloch-Johnson, J., Pierrehumbert, R.T., and
Abbot, D.S. (2015). Feedback temperature
dependence determines the risk of high warm-
ing. Geophys. Res. Lett. 42, 4973–4980.
https://doi.org/10.1002/2015GL064240.
10. Forster, P., et al. (2021). The Earth’s energy
budget, climate feedbacks, and climate
sensitivity. In Climate Change 2021: The
Physical Science Basis. Contribution of
Working Group I to the Sixth Assessment
Report of the Intergovernmental Panel on
Climate Change [Masson-Delmotte, V.., P.
Zhai, A. Pirani, S.L. Connors, C. Péan, S.
Berger, N. Caud, Y. Chen, L. Goldfarb, M.I.
Gomis, and M. Huang, et al., eds. (Cambridge
University Press). https://doi.org/10.1017/978
1009157896.009.
11. Wunderling, N., Donges, J.F., Kurths, J., and
Winkelmann, R. (2021). Interacting tipping ele-
ments increase risk of climate domino effects
under global warming. Earth Syst. Dynam.
12, 601–619. https://doi.org/10.5194/esd-12-
601-2021.
12. Steffen, W., Richardson, K., Rockstrom, J.,
Schellnhuber, H.J., Dube, O.P., Dutreuil, S.,
Lenton, T.M., and Lubchenco, J. (2020).
The emergence and evolution of earth
system science. Nat. Rev. Earth Environ. 1,
54–63. https://doi.org/10.1038/s43017-019-0
005-6.
13. Rogelj, J., Shindell, D., Jiang, K., Fifita, S.,
Forster, P., Ginzburg, V., Handa, C., Kheshgi,
H., Kobayashi, S., Kriegler, E., et al. (2018).
Mitigation pathways compatible with 1.5
C in
the context of sustainable development.
Special Report on the impacts of global warm-
ing of 1.5
C (Intergovernmental Panel on
Climate Change). https://doi.org/10.1017/
9781009157940.004.
14. Van Vuuren, D.P., Batlle Bayer, L., Chuwah, C.,
Ganzeveld, L., Hazeleger, W., van den Hurk, B.,
van Noije, T., O’Neill, B., and Strengers, B.J.
(2012). A comprehensive view on climate
change: coupling of earth system and inte-
grated assessment models. Environ. Res. Lett.
7, 024012. https://doi.org/10.1088/1748-9326/
7/2/024012.
15. Brondizio, E.S., O’Brien, K., Bai, X.,
Biermann, F., Steffen, W., Berkhout, F.,
Cudennec, C., Lemos, M.C., Wolfe, A.,
Palma-Oliveira, J., and Chen, C.T.A. (2016).
Re-conceptualizing the Anthropocene: a call
for collaboration. Global Environ. Change 39,
318–327. https://doi.org/10.1016/j.gloenvcha.
2016.02.006.
16. United Nations Environment Programme
(2022). Emissions Gap Report 2022: The
Closing Window — Climate Crisis Calls for
Rapid Transformation of Societies (Nairobi).
17. IPCC (2013). Climate Change 2013: The
Physical Science Basis. In Contribution of
Working Group I to the Fifth Assessment
Report of the Intergovernmental Panel on
Climate Change, T.F. Stocker, D. Qin, G.-K.
Plattner, M. Tignor, S.K. Allen, J. Boschung,
A. Nauels, Y. Xia, V. Bex, and P.M. Midgley,
eds., p. 1535.
18. Kemp, L., Xu, C., Depledge, J., Ebi, K.L., Gibbins,
G., Kohler, T.A., Rockstrom, J., Scheffer, M.,
Schellnhuber, H.J., Steffen, W., and Lenton,
T.M. (2022). Climate Endgame: Exploring cata-
strophic climate change scenarios. Proc. Natl.
Acad. Sci. USA. 119, e2108146119. https://doi.
org/10.1073/pnas.2108146119.
Commentary
One Earth 6, February 17, 2023 91
ll