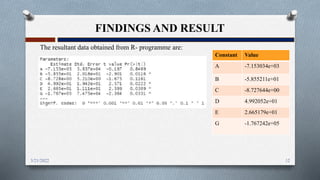
(1) The study estimated the above-ground biomass of Milanchowk Community Forest in Nepal using field inventory data and satellite imagery. (2) A regression model was developed between above-ground biomass measured in 20 sample plots and vegetation indices derived from a Sentinel 2 image. (3) The maximum, minimum and average biomass estimates from the sample plots were 2164 kg, 422 kg and 1263 kg respectively. The regression model was validated and found to accurately estimate biomass across 10 additional plots.
Making FCC Erdas from AWiFS/LISS-III individual bands dataSonal Aggarwal
This presentation shows how to make False Color composite (FCC) in Erdas from AWiFS/LISS-III individual bands data. AWiFS/LISS-III data can be obtained through NRSC Open EO Data Archive (NOEDA) in Bhuvan website.
Digital Elevation Model (DEM) is the digital representation of the land surface elevation with respect to any reference datum. DEM is frequently used to refer to any digital representation of a topographic surface. DEM is the simplest form of digital representation of topography. GIS applications depend mainly on DEMs, today.
Application of remote sensing in forest ecosystemaliya nasir
Established remote sensing systems provide opportunities to develop and apply new measurements of ecosystem function across landscapes, regions and continents.
New efforts to predict the consequences of ecosystem function change, both natural and human- induced, on the regional and global distributions and abundances of species should be a high research priority
To meet the various information requirements in forest management, different data sources like field survey, aerial photography, and satellite imagery is used, depending on the level of detail required and the extension of the area under study.
Remote Sensing Data Acquisition,Scanning/Imaging systemsdaniyal rustam
full of concepts about RS data acquisition scanning and imaging systems. Best for students of remote sensing. in this presentation we briefly explained the concept of scanning in remote sensing.
hyperspectral remote sensing and its geological applicationsabhijeet_banerjee
this is an introductory presentation on hyperspectral remote sensing, which essential deals with the distinguishing features, imaging spectrometers and its types, and some of the geological applications of hyperspectral remote sensing.
This document help you to prepare Triangulation Network (TIN), Hillshade Map, Slope map, interpolation and Digital Elevation Model (DEM) in a area and how to interpret them.
A remote sensing system uses a detector to sense the reflected or emitted energy from the earth's surface, perhaps modified by the intervening atmosphere. The sensor can be on a satellite, aircraft, or drone. The sensor turns the energy into a voltage, which an analog to digital converter turns into a single integer value (called the Digital Number, or DN) for the energy. Alternatively a digital detector can store the DN directly. We can then display this value with an appropriate color to build up an image of the region sensed by the system. The DN represents the energy sensed by the sensor in a particular part of the electromagnetic spectrum, emitted or reflected from a particular region. The principles can also be applied to sonar imagery, especially useful in water where sound penetrates readily whereas electromagnetic energy attenuates rapidly.
Definitions,
Remote sensing systems can be active or passive: active systems put out their own source of energy (a large "flash bulb") whereas passive systems use solar energy reflected from the surface or thermal energy emitted by the surface. Active systems can achieve higher resolution.
Satellite resolution considers four things: spatial, spectral, radiometric, and temporal resolution.
Electromagnetic radiation and the atmosphere control many aspects of a remote sensing system.
Satellite orbits determine many characteristics of the imagery, what the satellite sees, and how often it revisits an area.
The signal to noise ratio is important for the design of remote sensing systems.
Satellite band tradeoffs.
Interpreting satellite reflectance patterns and images uses various statistical measures to assess surface properties in the image.
The colors used on the display are gray shading for single bands, and RGB for multi-band composites. We can also perform image merge and sharpening to combine the advantages of both panchromatic (higher spatial resolution) and color imagery (better differentiation of surface materials).
Keys for image analysis
Hyperspectral imagery
Spectral reflectance library--different materials reflect radiation differently
Presentation at workshop: Reducing the costs of GHG estimates in agriculture to inform low emissions development
November 10-12, 2014
Sponsored by the CGIAR Research Program on Climate Change, Agriculture and Food Security (CCAFS) and the Food and Agriculture Organization of the United Nations (FAO)
CAN CROP MANAGEMENT IMPROVE EMISSIONS SAVINGS?: PRELIMINARY RESULTS OF THE OP...Bioenergy Crops
Several studies suggest that lignocellulosic energy crops for electricity production may have a better performance compared to those crops for liquid biofuels production, when assessing GHG savings with respect to fossil references. Winter cereal residues and some annual winter grasses, as dedicated energy crops, are currently being grown in Spain and harvested as bales to be burned for electricity production in biomass power plants. Previous studies of our group analyzed GHG emissions and energy balances of winter cereals for electricity production by means of Life Cycle Assessment. We selected highly productive genotypes of three annual winter cereals (rye, triticale and oat) and compared them with Spanish electricity produced using natural gas. This paper compares effects of the use of different crop management practices for rye growing in the assessment of energy balances and GHG emissions. We analyzed the effects of six different management practices consisting of two different sowing doses (suboptimal and normal) combined with three top fertilization doses (zero, 30 and 80kgN ha-1). We made a characterization analysis of biomasses to estimate the nitrogen uptake of the crops in order to compare it with the nitrogen provided by the fertilizers. This comparison evaluates if lower fertilization doses are sustainable for the soil nitrogen stocks. Our results suggest that there is trade-off between soil nitrogen and emission savings. The use of zero or low top fertilization doses (30 kg N ha-1) improves GHG emissions and energy balances even with a yield reduction. Nevertheless the use of these doses imply an annual lose in soil nitrogen stocks for the majority all of our trials. Using suboptimal sowing doses resulted in yield decreases that did not compensate the lower input consumed.
Keywords: electricity, energy balance, energy crops, greenhouse gases (GHG), life cycle assessment (LCA), sustainability criteria
Characterization of excitation source LEDs and sensors without filters for me...TELKOMNIKA JOURNAL
This paper presents the characterization of excitation source LEDs and sensors without filters for measuring fluorescence in fluorescein and green leaf extract. For this purpose, eight light-emitting diodes (LEDs) were used with the following characteristics: one blue, one green, one red, one infrared, and four violets. The first four LEDs were used as sensors without filters to detect fluorescence induced by the other four violet LEDs in 11 samples of different fluorescein concentrations and in 14 samples of different dilutions of green leaf extract. The results show that infrared LEDs can detect the red emission of green leaf extract and red and infrared LEDs detect the fluorescence of fluorescein in concentrations of up to 1.8 μM. The developed system allows and facilitates teaching optical spectroscopy in basic education without incurring high costs.
Soil Carbon Sequestration Potential of Mangroves at Katunggan it IbajayASU-CHARRM
The Katunggan it Ibajay (KII) Eco Park is home to one of the most diverse mangrove forests in the Philippines. It is a 44.22 hectares protected park in the town of Ibajay in Aklan which boasts a total of 28 true species of mangroves or 80 percent out of the total 35 Philippine mangrove species. The forest is also a home to some species of birds and other wildlife like mud lobsters, fiddler crabs, mudskippers and other fauna. Recent studies have been conducted in the area which includes the identification of mollusk species, behaviours and activities of fiddler crabs. However, there is a lack of information on studies regarding Carbon storage and sequestration potential of mangrove species in KII.
Therefore, considering the vital role of mangrove species there is a need to conduct this study to provide a wide array of information about the total C-stock and sequestration potential of selected mangrove species in KII. Likewise, it will help local folks, LGU-officials and future researchers to increase their awareness to protect and preserve KII Eco-Park; to help reduce increasing negative impact of global warming in the environment.
Statistical Modelling of the Energy Content of Municipal Solid Wastes in Nort...AZOJETE UNIMAID
The ability to predict the quantity of energy to be produced is of paramount importance in every country. It would assist in setting up a waste management plan which will lead to a sustainable energy policy. This paper presents the development of a statistical linear regression mathematical model to predict the amount of energy contained in municipal solid wastes from the knowledge of such characteristics of the wastes as physical composition and/or moisture content. Major cities of Kano, Katsina, Dutse, Damaturu, Maiduguri, Bauchi, Birnin Kebbi, Gusau and Sokoto in Northern Nigeria, with high population densities and intense industrial activities constituted the area of study. Ten kilogram each, of the municipal solid waste was collected from the government designated refuse dumping sites in both highly dense populated low income areas and government residential areas, during the hottest months of February, March and April and during the rainy season in the month of August for three years. The waste material was prepared for the determination of its physical characteristics by sifting through. Proximate, ultimate analyses and calorific values were determined using ASTM analytical techniques and formulas from the literature. An empirical linear regression based mathematical model was developed using statistical methods and experimental data. Comparison between experimental and predicted values of the calorific values showed an agreement of about 70% with an average deviation of 5.03% while the standard deviation was found to be 5.29%.
Similar to Forest Biomass Estimation using GIS.pptx (20)
Macroeconomics- Movie Location
This will be used as part of your Personal Professional Portfolio once graded.
Objective:
Prepare a presentation or a paper using research, basic comparative analysis, data organization and application of economic information. You will make an informed assessment of an economic climate outside of the United States to accomplish an entertainment industry objective.
Francesca Gottschalk - How can education support child empowerment.pptxEduSkills OECD
Francesca Gottschalk from the OECD’s Centre for Educational Research and Innovation presents at the Ask an Expert Webinar: How can education support child empowerment?
Model Attribute Check Company Auto PropertyCeline George
In Odoo, the multi-company feature allows you to manage multiple companies within a single Odoo database instance. Each company can have its own configurations while still sharing common resources such as products, customers, and suppliers.
A Strategic Approach: GenAI in EducationPeter Windle
Artificial Intelligence (AI) technologies such as Generative AI, Image Generators and Large Language Models have had a dramatic impact on teaching, learning and assessment over the past 18 months. The most immediate threat AI posed was to Academic Integrity with Higher Education Institutes (HEIs) focusing their efforts on combating the use of GenAI in assessment. Guidelines were developed for staff and students, policies put in place too. Innovative educators have forged paths in the use of Generative AI for teaching, learning and assessments leading to pockets of transformation springing up across HEIs, often with little or no top-down guidance, support or direction.
This Gasta posits a strategic approach to integrating AI into HEIs to prepare staff, students and the curriculum for an evolving world and workplace. We will highlight the advantages of working with these technologies beyond the realm of teaching, learning and assessment by considering prompt engineering skills, industry impact, curriculum changes, and the need for staff upskilling. In contrast, not engaging strategically with Generative AI poses risks, including falling behind peers, missed opportunities and failing to ensure our graduates remain employable. The rapid evolution of AI technologies necessitates a proactive and strategic approach if we are to remain relevant.
Palestine last event orientationfvgnh .pptxRaedMohamed3
An EFL lesson about the current events in Palestine. It is intended to be for intermediate students who wish to increase their listening skills through a short lesson in power point.
Introduction to AI for Nonprofits with Tapp NetworkTechSoup
Dive into the world of AI! Experts Jon Hill and Tareq Monaur will guide you through AI's role in enhancing nonprofit websites and basic marketing strategies, making it easy to understand and apply.
June 3, 2024 Anti-Semitism Letter Sent to MIT President Kornbluth and MIT Cor...Levi Shapiro
Letter from the Congress of the United States regarding Anti-Semitism sent June 3rd to MIT President Sally Kornbluth, MIT Corp Chair, Mark Gorenberg
Dear Dr. Kornbluth and Mr. Gorenberg,
The US House of Representatives is deeply concerned by ongoing and pervasive acts of antisemitic
harassment and intimidation at the Massachusetts Institute of Technology (MIT). Failing to act decisively to ensure a safe learning environment for all students would be a grave dereliction of your responsibilities as President of MIT and Chair of the MIT Corporation.
This Congress will not stand idly by and allow an environment hostile to Jewish students to persist. The House believes that your institution is in violation of Title VI of the Civil Rights Act, and the inability or
unwillingness to rectify this violation through action requires accountability.
Postsecondary education is a unique opportunity for students to learn and have their ideas and beliefs challenged. However, universities receiving hundreds of millions of federal funds annually have denied
students that opportunity and have been hijacked to become venues for the promotion of terrorism, antisemitic harassment and intimidation, unlawful encampments, and in some cases, assaults and riots.
The House of Representatives will not countenance the use of federal funds to indoctrinate students into hateful, antisemitic, anti-American supporters of terrorism. Investigations into campus antisemitism by the Committee on Education and the Workforce and the Committee on Ways and Means have been expanded into a Congress-wide probe across all relevant jurisdictions to address this national crisis. The undersigned Committees will conduct oversight into the use of federal funds at MIT and its learning environment under authorities granted to each Committee.
• The Committee on Education and the Workforce has been investigating your institution since December 7, 2023. The Committee has broad jurisdiction over postsecondary education, including its compliance with Title VI of the Civil Rights Act, campus safety concerns over disruptions to the learning environment, and the awarding of federal student aid under the Higher Education Act.
• The Committee on Oversight and Accountability is investigating the sources of funding and other support flowing to groups espousing pro-Hamas propaganda and engaged in antisemitic harassment and intimidation of students. The Committee on Oversight and Accountability is the principal oversight committee of the US House of Representatives and has broad authority to investigate “any matter” at “any time” under House Rule X.
• The Committee on Ways and Means has been investigating several universities since November 15, 2023, when the Committee held a hearing entitled From Ivory Towers to Dark Corners: Investigating the Nexus Between Antisemitism, Tax-Exempt Universities, and Terror Financing. The Committee followed the hearing with letters to those institutions on January 10, 202
June 3, 2024 Anti-Semitism Letter Sent to MIT President Kornbluth and MIT Cor...
Forest Biomass Estimation using GIS.pptx
1. Forest Biomass Estimation using GIS
A Group Presentation on
GIS Application in Natural Resources FSE (701)
Group: Syntax
S.N. Name Class Roll no. S.N. Name Class Roll no.
1. Binita K.C. 5 5. Rabin Thapa 25
2. Kusum Saru 15 6. Santosh Ghimire 34
3. Niranjan Paudel 19 7. Susmita Khanal 39
4. Prabesh Adhikari 22 8. Yamuna Paudel 43
Submitted to: Assistant Professor Jeetendra Gautam
2. OUTLINE OF THE PRESENTATION
INTRODUCTION
OBJECTIVES
METHODOLOGY
FINDINGS AND RESULT
CONCLUSION
REFERENCES
1
3/21/2022
3. INTRODUCTION
Biomass is defined as mass of live or dead organic matter that includes the above-
ground and below-ground living biomass, dead mass, and litter (GTOS, 2009).
The largest carbon pool are typically stored in the above-ground living biomass. Thus
estimating above-ground forest biomass (AGB) is the most important step in
quantifying carbon stocks from forests (Gibbs et al., 2007).
The most accurate ways of calculating biomass data is based on field measurement
through destructive sampling or allometric equations method (Englhart et al., 2011).
However, these methods are often cost and time consuming, labor intensive, have
limited spatial distribution, and impractical especially in remote areas (Englhart et al.,
2011).
Remote sensing techniques have the capacity to overcome the limitations of
conventional field measurement methods and have now become the primary source in
estimating AGB (Lu, 2006).
2
3/21/2022
4. INTRODUCTION
These methods have been explored in terms of biomass and its changes to increase our
understanding of the role of forests in the carbon cycle for greenhouse gas inventories
and terrestrial carbon accounting (Muukkonen & Heiskanen, 2007).
Although much research has explored biomass estimation using remote sensing
technology methods to select suitable variables from remote sensing data and develop
estimation models suitable for specific studies are still poorly understood.
It is crucial to summarize the current status of remote sensing-based biomass
estimation techniques and discuss potential solutions to improve biomass estimation
performance.
3
3/21/2022
5. OBJECTIVES
General Objective:
To estimate the biomass of forest using GIS.
Specific Objective:
To calculate above ground biomass of Milanchowk CF from field inventory.
To establish a regression model between aboveground biomass and Sentinel 2
image.
4
3/21/2022
6. METHODOLOGY
Study Area:
The study was carried out in the
Milanchowk Community Forest, located
in Chitlang, Makawapur District.
It is extended from 27.34'52" N to
27.40'59"N and 85.01'21"E to 85.12'20"E
The average annual rainfall has been
recorded as 1863mm/year.
The dominant species of the study area
are Pinus and Quercus species.
5
3/21/2022
7. METHODOLOGY
Methodology Steps:
1) Download Sentinel 2 imaginary from USGS Earth Explorer.
2) Add Sentinel 2 imaginary data in Arc GIS 10.8 and calculate NDVI value.
3) Add boundary and sample plot point of CF.
4) Calculate Red band, Green bend, Blue band, NIR and NDVI value of
sample point.
5) Develop equation (Biomass vs Red, Green, Blue, NIR, NDVI Value) from
R-Studio programming software.
6) Validation Analysis using Paired t-test.
6
3/21/2022
8. METHODOLOGY
Data Collection:
7
3/21/2022
S.N. Data collection Activities
1. Primary data
collection
The systematic sampling method with 10m * 10m sample plot
is used for field measurement.
The biomass is estimated by using the equation: AGB =
0.0509 * pD2H (Where, AGB = above-ground tree biomass
[kg]; p = wood specific gravity [g/cm3; D = tree diameter at
breast height [cm]; and H = tree height [m])
Sentinel 2 image is used to calculated NDVI Value.
2. Secondary data
collection
Books
Journals
Article
Reports
9. FINDINGS AND RESULT
8
3/21/2022
Sample plot Biomass (kg)
1 1602
2 1429
3 1490
4 948
5 2164
6 1956
7 1253
8 572
9 1479
10 1080
11 1094
12 653
13 723
14 1814
15 1118
16 1113
17 845
18 422
19 1669
20 1847
Out of 30 sample plots, biomass estimation is done
from 20 sample plots which are used to generate the
biomass equation.
The maximum, minimum and average biomass
estimates from 20 sample plot of Milanchowk C.F.
are 2164 kg, 422 kg and 1263 kg respectively.
Biomass estimation
10. FINDINGS AND RESULT
9
3/21/2022
NDVI Value:
The high, low and average
NDVI value of Milanchowk
C.F. are 0.38033, 0.23325 and
0.322 respectively.
12. FINDINGS AND RESULT
Equation formulation:
To develop the biomass equation, five independent variables are used i.e.
(Biomass ~ Red band, Green band, Blue band, NIR, NDVI value).
Linear regression equation is used to fit dependent variable with independent
variables.
The fit regression equation derived from biomass modelling is:
Biomass ~ A + B * Red + C * Green + D * Blue + E * NIR + G * NDVI
11
3/21/2022
13. FINDINGS AND RESULT
The resultant data obtained from R- programme are:
12
3/21/2022
Constant Value
A -7.153034e+03
B -5.855211e+01
C -8.727644e+00
D 4.992052e+01
E 2.665179e+01
G -1.767242e+05
14. FINDINGS AND RESULT
13
3/21/2022
Equation Validation Analysis:
Ten sample plots are used for equation
validation analysis.
The resultant p value obtained from paired t–
test is p=0.08756 > 0.05, which indicates
above biomass equation is valid.
15. CONCLUSION
The maximum, minimum and average biomass are estimated as 2164 kg, 422 kg and
1263 kg respectively.
The high, low and average NDVI value are 0.38033, 0.23325 and 0.322 respectively.
The best fitted regression equation derived from biomass modelling is Biomass ~ A +
B * Red + C * Green + D * Blue + E * NIR + G * NDVI .
The biomass equation developed from this study can be used by the relevant
institutions, organizations and academics for research purposes as well as forest
management authorities.
14
3/21/2022
16. REFERENCES
Englhart, S., Keuck, V. & Siegert, F. (2011). Aboveground biomass retrieval in tropical
forest. Remote Sensing of Environment 115, pp. 1260-1271.
Gibbs, H.K., Brown, S., Niles, J.O. & Foley, J.A. (2007). Monitoring and estimating
tropical forest carbon stocks: making REDD a reality. Environmental Research Letters 2
(4), 13pp.
GTOS (Global Terrestrial Observing System). (2009). Assessment of the status of the
development of the standards for the terrestrial essential climate variables: Biomass.
Report FAO.
Lu, D.S. (2006). The potential and challenge of remote sensing-based biomass
estimation. International Journal of Remote Sensing, 27 (7), pp. 1297-1328.
Muukkonen, P. & Heiskanen, J. (2007). Biomass estimation over a large area based on
standwise forest inventory data and ASTER and MODIS satellite data: A possibility to
verify carbon inventories. Remote Sensing of Environment, 107(4), 617-624.
15
3/21/2022