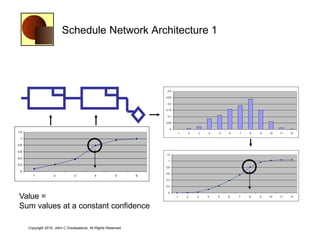
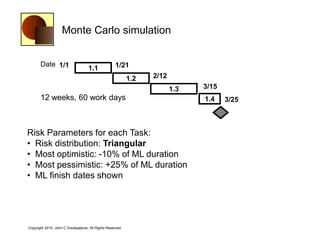
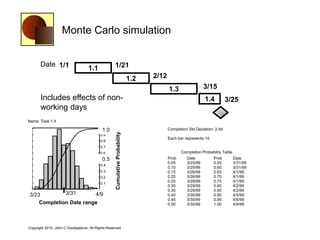
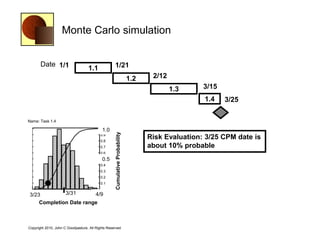
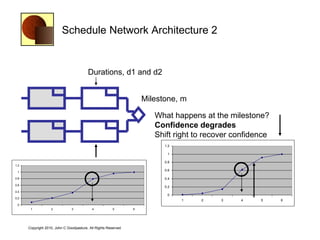
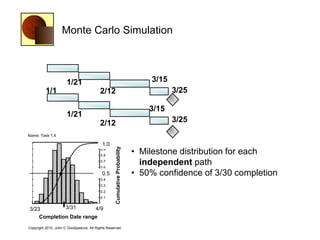
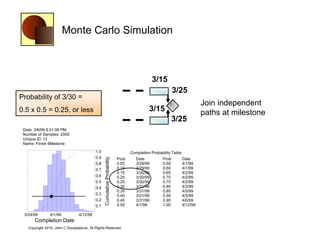
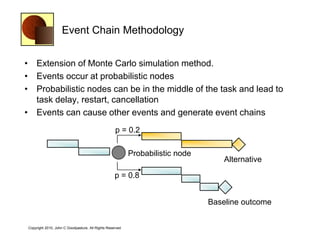
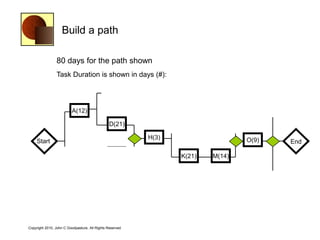
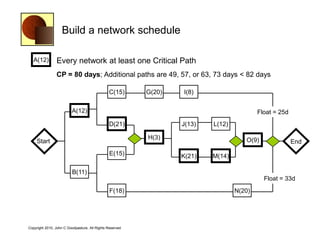
SlideShare a Scribd company logo
Mitigating Risk in Schedules
                      Quantitative Methods in Project Management


                                                     Produced by
                                              Square Peg Consulting, LLC
                                                 John C. Goodpasture
                                                  Managing Principal
                                                          www.sqpegconsulting.com


Copyright 2010, John C Goodpasture, All Rights Reserved
                                                                                    1
About Confidence

• Likelihood an event will occur within a range
• A number from 0 to 1
• Cumulative summation of probabilities within the range


Copyright 2010, John C Goodpasture, All Rights Reserved
Confidence ―S‖ Curve


                                                                              1
                   Cumulative
                   Probability


                                                                       0.75


                                                                         0.5


                                                                       0.25


                                                                              0
                                 -3.5     -3 -2.5         -2 -1.5   -1 -0.5       0   0.5   1   1.5   2   2.5   3   3.5


                                                    Normalized value
                                               Value / Standard deviation, σ

                         Normalized cumulative probability from ‗bell‘ curve
Copyright 2010, John C Goodpasture, All Rights Reserved
Confidence ―S‖ Curve


                        1. 68% confidence: value between -1 to +1
                        2. 16% confidence: value > 1
                        3. 84% confidence: value < 1
                                                            2
                                                                              1
                   Cumulative
                   Probability


                                                                       0.75


                                                                         0.5                      1
                                                                       0.25


                                                                              0
                                 -3.5     -3 -2.5         -2 -1.5   -1 -0.5       0   0.5   1   1.5   2       2.5   3   3.5


                                                 3                                1                       2


Copyright 2010, John C Goodpasture, All Rights Reserved
Generating Confidence


                                             Probability Distribution

                                                                f(v)

                                                                         Area = Height (probability) X
                    Probability


                                  p                                    f(v)
                                                                         width (Δ Value)
                                                  Δ value


                                      0.0   0.5           1.0          1.5     2.0      2.5     3.0      3.5

                                                     Normalized random variable value


                         Calculate each ―Area increment‖
                         Δ value x p


Copyright 2010, John C Goodpasture, All Rights Reserved
Sum & Plot area increments


                                                              F(v) = 1 is the limiting value
                                      f(v)Δv

                  F(v)
                                                          Area increments summed


                                                Value

                                F(v) is the area under the f(v) curve


Copyright 2010, John C Goodpasture, All Rights Reserved
Schedule Network Architecture 1


                                                               What is to be expected at the milestone?


0.45
 0.4
0.35
 0.3
0.25
 0.2
0.15
 0.1
0.05
  0
         1          2          3         4          5      6


 Copyright 2010, John C Goodpasture, All Rights Reserved
Schedule Network Architecture 1


                                                                                          EV
                                                                0.3

                                                               0.25

                                                                0.2

                                                               0.15

                                                                0.1

                                                               0.05

                                                                 0
                                                                      1   2   3   4   5   6    7   8   9   10   11   12


                                                                Convolved task probabilities
0.45
 0.4
0.35
 0.3                       EV
0.25
 0.2
                                                                      EVmilestone = Sum (EV in tandem)
0.15
 0.1
0.05
  0
         1          2          3         4          5      6


 Copyright 2010, John C Goodpasture, All Rights Reserved
Schedule Network Architecture 1


                                                                     0.3

                                                                    0.25

                                                                     0.2

                                                                    0.15

                                                                     0.1

                                                                    0.05

                                                                          0
1.2                                                                               1   2   3   4   5   6   7   8   9   10   11   12

 1

0.8

0.6
                                                                    1.2
0.4
                                                                     1
0.2
                                                                    0.8
 0
                                                                    0.6
        1            2           3           4           5      6
                                                                    0.4

                                                                    0.2

                                                                     0

 Value =                                                                      1       2   3   4   5   6   7   8   9   10   11   12


 Sum values at a constant confidence

      Copyright 2010, John C Goodpasture, All Rights Reserved
Monte Carlo simulation


       Date 1/1                                    1/21
                                   1.1
                                                          1.2   2/12
                                                                       1.3   3/15
       12 weeks, 60 work days                                                1.4    3/25


Risk Parameters for each Task:
• Risk distribution: Triangular
• Most optimistic: -10% of ML duration
• Most pessimistic: +25% of ML duration
• ML finish dates shown


Copyright 2010, John C Goodpasture, All Rights Reserved
Monte Carlo simulation


                       Date 1/1                                    1/21
                                                   1.1
                                                                                             1.2   2/12
                                                                                                          1.3                 3/15
                       Includes effects of non-                                                                               1.4          3/25
                       working days 10:30:27 PM
                                Date: 3/9/99


                Name: Task 1.4
               170                                        1.0
                                                           1.0                                            Completion Std Deviation: 2.4d
                                                                    Cumulative Probability


               153                                        0.9
                                                                                                          Each bar represents 1d.
               136                                        0.8
               119                                        0.7
               102                                        0.6                                                    Completion Probability Table
Sample Count


               85                                          0.5
                                                          0.5                                             Prob      Date            Prob        Date
                                                                                                          0.05      3/25/99         0.55        3/31/99
               68                                         0.4
                                                                                                          0.10      3/25/99         0.60        3/31/99
               51                                         0.3                                             0.15      3/26/99         0.65        4/1/99
               34                                         0.2                                             0.20      3/26/99         0.70        4/1/99
                                                                                                          0.25      3/29/99         0.75        4/1/99
               17                                         0.1
                                                                                                          0.30      3/29/99         0.80        4/2/99
                3/23/99         3/31/99              4/9/99                                               0.35      3/29/99         0.85        4/2/99
                 3/23         3/31       4/9                                                              0.40      3/30/99         0.90        4/5/99
                                                                                                          0.45      3/30/99         0.95        4/6/99
                     Completion Date range                                                                0.50      3/30/99         1.00        4/9/99


                Copyright 2010, John C Goodpasture, All Rights Reserved
Monte Carlo simulation


                       Date 1/1                                    1/21
                                                   1.1
                                                                                             1.2    2/12
                                                                                                           1.3     3/15
                                                                                                                   1.4    3/25
                                           Date: 3/9/99 10:30:27 PM


                Name: Task 1.4
               170                                        1.0
                                                           1.0
                                                                    Cumulative Probability


               153                                        0.9
               136                                        0.8
                                                                                                   Risk Evaluation: 3/25 CPM date is
               119                                        0.7                                      about 10% probable
               102                                        0.6
Sample Count


               85                                          0.5
                                                          0.5
               68                                         0.4
               51                                         0.3
               34                                         0.2
               17                                         0.1

                3/23/99         3/31/99
                              3/31                   4/9/99
                 3/23                    4/9
                     Completion Date range


                Copyright 2010, John C Goodpasture, All Rights Reserved
Budgets?


• Are the effects on budget totals any different when adding up a
  string of $budgets from the WBS work packages?


Copyright 2010, John C Goodpasture, All Rights Reserved
Schedule Network Architecture 2


                                                                  What happens at the milestone?


 0.45
  0.4
 0.35
  0.3
 0.25
  0.2
 0.15
  0.1
 0.05
    0
            1           2           3          4          5   6


Copyright 2010, John C Goodpasture, All Rights Reserved
Schedule Network Architecture 2


                                                          What happens at the milestone?
                                                          Lots of combinations—36 possible outcomes

                                                             0.2
                                                            0.18
                                                            0.16
                                                            0.14
                                                            0.12
                                                             0.1                                                                 Series1
                                                            0.08
                                                            0.06
                                                            0.04
                                                            0.02
                                                               0
                                                                   1   2   3   4   5   6   8   9 10 12 15 16 18 20 24 25 30 36
    Duration value
    ‗12‘ combo  milestone value could be 4 or 6
Copyright 2010, John C Goodpasture, All Rights Reserved
Schedule Network Architecture 2


                                         Durations, d1 and d2


                                                                    Milestone, m

                                                                       What happens at the milestone?
                                                                       •Confidence at the milestone is
                                                                       the product of the confidences
                                                                       of the joining paths
1.2

 1

0.8

0.6

0.4

0.2

 0
       1           2           3           4            5       6


      Copyright 2010, John C Goodpasture, All Rights Reserved
Schedule Network Architecture 2


                                         Durations, d1 and d2


                                                                    Milestone, m

                                                                       What happens at the milestone?
                                                                       Confidence degrades
                                                                       Shift right to recover confidence
                                                                          1.2

                                                                           1

                                                                          0.8
1.2
                                                                          0.6
 1

0.8                                                                       0.4
0.6
                                                                          0.2
0.4
                                                                           0
0.2
                                                                                1   2     3    4     5     6
 0
       1           2           3           4            5       6


      Copyright 2010, John C Goodpasture, All Rights Reserved
Schedule Network Architecture 2


                                   Durations, d1 and d2


                                                                Milestone, m

                                                                     What happens at the milestone?
                                                                     Probability ‗center of gravity‘ shifts right
                                                                     EV increases from 3.6 to 4.2
                                                                     Critical path may change
                                                          0.6

                                                          0.5                   EV
                                                          0.4

                                                          0.3

                                                          0.2

                                                          0.1

                                                           0
                                                                 1        2       3      4       5      6
Copyright 2010, John C Goodpasture, All Rights Reserved
Monte Carlo Simulation


                                      1/21                                                       3/15
                          1/1                             2/12                                          3/25

                                                                                                 3/15
                                      1/21
                                                          2/12
                                           Date: 3/9/99 10:30:27 PM                                     3/25
                Name: Task 1.4
               170                                        1.0
                                                           1.0
                                                                                             • Milestone distribution for each
                                                                    Cumulative Probability


               153                                        0.9
               136                                        0.8
               119
               102
                                                          0.7
                                                          0.6
                                                                                               independent path
Sample Count


               85                                          0.5
                                                          0.5                                • 50% confidence of 3/30 completion
               68                                         0.4
               51                                         0.3
               34                                         0.2
               17                                         0.1

                3/23/99         3/31/99
                              3/31                   4/9/99
                 3/23                    4/9
                     Completion Date range
                Copyright 2010, John C Goodpasture, All Rights Reserved
Monte Carlo Simulation


                                                                                              3/15
                                                                                                         3/25
Probability of 3/30 =
                                                                                                                          Join independent
0.5 x 0.5 = 0.25, or less                                                                  3/15                           paths at milestone
                                                                                                       3/25
 Date: 3/8/99 9:31:06 PM
 Number of Samples: 2000
 Unique ID: 12
 Name: Finish Milestone
                                           1.0                                   Completion Probability Table
                                           0.9
                                                 Cumulative Probability


                                                                          Prob      Date          Prob          Date
                                           0.8                            0.05      3/29/99       0.55          4/1/99
                                           0.7                            0.10      3/29/99       0.60          4/1/99
                                                                          0.15      3/30/99       0.65          4/2/99
                                           0.6                            0.20      3/30/99       0.70          4/2/99
                                           0.5                            0.25      3/30/99       0.75          4/2/99
                                           0.4                            0.30      3/31/99       0.80          4/2/99
                                                                          0.35      3/31/99       0.85          4/5/99
                                           0.3                            0.40      3/31/99       0.90          4/5/99
                                           0.2                            0.45      3/31/99       0.95          4/6/99
                                           0.1                            0.50      4/1/99        1.00          4/12/99

 3/24/99       4/1/99           4/12/99
      Completion Date
   Copyright 2010, John C Goodpasture, All Rights Reserved
Event Chain Methodology


• Extension of Monte Carlo simulation method.
• Events occur at probabilistic nodes
• Probabilistic nodes can be in the middle of the task and lead to
  task delay, restart, cancellation
• Events can cause other events and generate event chains
                                                   p = 0.2

                                                          Probabilistic node
                                                                                   Alternative

                                                   p = 0.8


                                                                               Baseline outcome


Copyright 2010, John C Goodpasture, All Rights Reserved
Build a path

                80 days for the path shown
                Task Duration is shown in days (#):

                                               C(15)      G(20)   I(8)

                         A(12)                                                            Float = 25d
                                               D(21)              J(13)   L(12)

                                                          H(3)                       O(9)
    Start                                                                                               End
                                                E(15)             K(21)   M(14)

                         B(11)
                                                                                            Float = 33d
                                                F(18)                             N(20)


Copyright 2010, John C Goodpasture, All Rights Reserved
Build a network schedule

   A(12)        Every network at least one Critical Path
                CP = 80 days; Additional paths are 49, 57, or 63, 73 days < 82 days

                                               C(15)      G(20)   I(8)

                         A(12)                                                            Float = 25d
                                               D(21)              J(13)   L(12)

                                                          H(3)                       O(9)
    Start                                                                                               End
                                                E(15)             K(21)   M(14)

                         B(11)
                                                                                            Float = 33d
                                                F(18)                             N(20)


Copyright 2010, John C Goodpasture, All Rights Reserved
Critical path shifts with variation

   B(11)        Critical path is 81.5 days
                Former path at 50%; new path at 80%

                                               C(15)      G(20)   I(8)

                         A(12)                                                            Float = 25d
                                               D(21)              J(13)   L(12)

                                                          H(3)                       O(10)
    Start                                                                                               End
                                                E(17)             K(23)   M(16)

                         B(12)
                                                                                             Float = 33d
                                                F(18)                             N(20)


Copyright 2010, John C Goodpasture, All Rights Reserved
Critical path shifts with variation

                Three milestones will shift the END & change CP probabilities


                                               C(15)      G(20)   I(8)

                         A(12)                                                            Float = 25d
                                               D(21)              J(13)   L(12)

                                                          H(3)                       O(10)
    Start                                                                                               End
                                                E(17)             K(23)   M(16)

                         B(12)
                                                                                             Float = 33d
                                                F(18)                             N(20)


Copyright 2010, John C Goodpasture, All Rights Reserved
―Critical Chain‖ buffers uncertainty


                      10 days                                                       Project Buffer


                                                                                   Project buffer
                                                              15 days    10 days
                                                                                   protects final
                                                                                   milestone
                                                                                   from variation
                                                 Task on the critical path


Critical chain is a concept developed in the book
Critical Chain (Goldratt, 1997)

    Copyright 2010, John C Goodpasture, All Rights Reserved
―Critical Chain‖ buffers uncertainty
                                                              1           2

                      10 days                        11 days            12 days   Buffer     Project Buffer


                                                                                            Path buffer mitigates
                                                              15 days             10 days
                                                                                            “shift right” at the
                                                                                            milestone of joining
                                                                                            path
                                                 Task on the critical path

                                                 Task with risky duration, not on critical path


Critical chain is a concept developed in the book
Critical Chain (Goldratt, 1997)

    Copyright 2010, John C Goodpasture, All Rights Reserved
Resources on the CP


            Rule # 1: CP work begins at project beginning

        Task 1                  20d                       30d   Critical Path = 50d


        Task 2             5d               15d


Copyright 2010, John C Goodpasture, All Rights Reserved
Resources on the CP


            Rule # 2: Resource CP first and then level

        Task 1              Mary 20d                      John 30d                 Critical Path = 65d


                                                  Mary                  John 15d
        Task 2                                     5d

                                                                     Float


Copyright 2010, John C Goodpasture, All Rights Reserved
CP responds to constraints


            Rule # 3: Reorganize the network logic

                                         Mary 20d         John 30d   Critical Path = 55d
     Task 1


                         Mary
     Task 2                            John 15d
                          5d

            Work does not begin first on the CP


Copyright 2010, John C Goodpasture, All Rights Reserved
Resource consequences


• Resource dependencies
  lengthen the schedule
• In fact, any loss of
  independence from any
  cause will lengthen the
  schedule!
• Resource constraints may
  require work begin off the CP


Copyright 2010, John C Goodpasture, All Rights Reserved
Project manager’s mission:
To defeat an unfavorable forecast and deliver
customer value, taking reasonable risks to do so


Copyright 2010, John C Goodpasture, All Rights Reserved
Graphic Earned Schedule, ES


Value
Cumulative


                                                                 ES Variance

                                     Schedule                    AT = actual time
                                                          ES = earned schedule


Copyright 2010, John C Goodpasture, All Rights Reserved
Graphic Earned Schedule, ES

                   • ES will never be 0 for a late project
                   • EV schedule variance, EV – PV, will
                     always be 0 for a completed project                     EV = PV


Value
Cumulative


                                                          ES Variance

                                     Schedule                                   AT

                                                                        ES


Copyright 2010, John C Goodpasture, All Rights Reserved
What‘s been learned?


• Confidence expresses probability over a range
• Confidence is based on the cumulative probability, a.k.a. the ‗area
  under the curve‘
• Confidence is constant in tandem strings, whether budget or
  schedule, but degrades rapidly at a parallel join
• Monte Carlo simulations give results very close to calculated
  ‗ideals‘
• Earned schedule will not have a 0 variance when all value is
  earned


Copyright 2010, John C Goodpasture, All Rights Reserved

More Related Content

Similar to Quantitative methods schedule

SPICE MODEL of PBYR10100 (Standard Model) in SPICE PARK
SPICE MODEL of PBYR10100 (Standard Model) in SPICE PARKSPICE MODEL of PBYR10100 (Standard Model) in SPICE PARK
SPICE MODEL of PBYR10100 (Standard Model) in SPICE PARK
Tsuyoshi Horigome
 
DCT_TR802
DCT_TR802DCT_TR802
DCT_TR802
aniruddh Tyagi
 
DCT_TR802
DCT_TR802DCT_TR802
DCT_TR802
Aniruddh Tyagi
 
DCT_TR802
DCT_TR802DCT_TR802
DCT_TR802
aniruddh Tyagi
 
Southwest Airlines
Southwest AirlinesSouthwest Airlines
Southwest Airlines
jdslrc81
 
Метрики покрытия. Прагматичный подход
Метрики покрытия. Прагматичный подходМетрики покрытия. Прагматичный подход
Метрики покрытия. Прагматичный подход
SQALab
 
Reaching for yield
Reaching for yieldReaching for yield
Reaching for yield
Yichuan Wang
 
SPICE MODEL of 11EQ10 (Standard Model) in SPICE PARK
SPICE MODEL of 11EQ10 (Standard Model) in SPICE PARKSPICE MODEL of 11EQ10 (Standard Model) in SPICE PARK
SPICE MODEL of 11EQ10 (Standard Model) in SPICE PARK
Tsuyoshi Horigome
 
Commercial Real Retate Outlook21 July 2009
Commercial Real Retate Outlook21 July 2009Commercial Real Retate Outlook21 July 2009
Commercial Real Retate Outlook21 July 2009
May15thProphecy
 
SPICE MODEL of 1N5819 (Standard Model) in SPICE PARK
SPICE MODEL of 1N5819 (Standard Model) in SPICE PARKSPICE MODEL of 1N5819 (Standard Model) in SPICE PARK
SPICE MODEL of 1N5819 (Standard Model) in SPICE PARK
Tsuyoshi Horigome
 
Session 5
Session 5Session 5
Session 5
vivek_shaw
 
SPICE MODEL of 1SS377 (Standard Model) in SPICE PARK
SPICE MODEL of 1SS377 (Standard Model) in SPICE PARKSPICE MODEL of 1SS377 (Standard Model) in SPICE PARK
SPICE MODEL of 1SS377 (Standard Model) in SPICE PARK
Tsuyoshi Horigome
 
SPICE MODEL of C4D15120A LTspice Model (Professional Model) in SPICE PARK
SPICE MODEL of C4D15120A LTspice Model (Professional Model) in SPICE PARKSPICE MODEL of C4D15120A LTspice Model (Professional Model) in SPICE PARK
SPICE MODEL of C4D15120A LTspice Model (Professional Model) in SPICE PARK
Tsuyoshi Horigome
 
C4 d15120a p
C4 d15120a pC4 d15120a p
C4 d15120a p
Tsuyoshi Horigome
 
C4 d15120a p
C4 d15120a pC4 d15120a p
C4 d15120a p
Tsuyoshi Horigome
 
C4 d15120a p
C4 d15120a pC4 d15120a p
C4 d15120a p
Tsuyoshi Horigome
 
SPICE MODEL of SCS110AG , TC=125degree , LTspice (Standard Model) in SPICE PARK
SPICE MODEL of SCS110AG , TC=125degree , LTspice (Standard Model) in SPICE PARKSPICE MODEL of SCS110AG , TC=125degree , LTspice (Standard Model) in SPICE PARK
SPICE MODEL of SCS110AG , TC=125degree , LTspice (Standard Model) in SPICE PARK
Tsuyoshi Horigome
 
National Forum, Montreal 2009
National Forum, Montreal 2009National Forum, Montreal 2009
National Forum, Montreal 2009
JanneEricsson
 
SPICE MODEL of C4D20120D LTspice Model (Professional Model) in SPICE PARK
SPICE MODEL of C4D20120D LTspice Model (Professional Model) in SPICE PARKSPICE MODEL of C4D20120D LTspice Model (Professional Model) in SPICE PARK
SPICE MODEL of C4D20120D LTspice Model (Professional Model) in SPICE PARK
Tsuyoshi Horigome
 
SPICE MODEL of SCS110AG , TC=25degree , LTspice (Professional Model) in SPICE...
SPICE MODEL of SCS110AG , TC=25degree , LTspice (Professional Model) in SPICE...SPICE MODEL of SCS110AG , TC=25degree , LTspice (Professional Model) in SPICE...
SPICE MODEL of SCS110AG , TC=25degree , LTspice (Professional Model) in SPICE...
Tsuyoshi Horigome
 

Similar to Quantitative methods schedule (20)

SPICE MODEL of PBYR10100 (Standard Model) in SPICE PARK
SPICE MODEL of PBYR10100 (Standard Model) in SPICE PARKSPICE MODEL of PBYR10100 (Standard Model) in SPICE PARK
SPICE MODEL of PBYR10100 (Standard Model) in SPICE PARK
 
DCT_TR802
DCT_TR802DCT_TR802
DCT_TR802
 
DCT_TR802
DCT_TR802DCT_TR802
DCT_TR802
 
DCT_TR802
DCT_TR802DCT_TR802
DCT_TR802
 
Southwest Airlines
Southwest AirlinesSouthwest Airlines
Southwest Airlines
 
Метрики покрытия. Прагматичный подход
Метрики покрытия. Прагматичный подходМетрики покрытия. Прагматичный подход
Метрики покрытия. Прагматичный подход
 
Reaching for yield
Reaching for yieldReaching for yield
Reaching for yield
 
SPICE MODEL of 11EQ10 (Standard Model) in SPICE PARK
SPICE MODEL of 11EQ10 (Standard Model) in SPICE PARKSPICE MODEL of 11EQ10 (Standard Model) in SPICE PARK
SPICE MODEL of 11EQ10 (Standard Model) in SPICE PARK
 
Commercial Real Retate Outlook21 July 2009
Commercial Real Retate Outlook21 July 2009Commercial Real Retate Outlook21 July 2009
Commercial Real Retate Outlook21 July 2009
 
SPICE MODEL of 1N5819 (Standard Model) in SPICE PARK
SPICE MODEL of 1N5819 (Standard Model) in SPICE PARKSPICE MODEL of 1N5819 (Standard Model) in SPICE PARK
SPICE MODEL of 1N5819 (Standard Model) in SPICE PARK
 
Session 5
Session 5Session 5
Session 5
 
SPICE MODEL of 1SS377 (Standard Model) in SPICE PARK
SPICE MODEL of 1SS377 (Standard Model) in SPICE PARKSPICE MODEL of 1SS377 (Standard Model) in SPICE PARK
SPICE MODEL of 1SS377 (Standard Model) in SPICE PARK
 
SPICE MODEL of C4D15120A LTspice Model (Professional Model) in SPICE PARK
SPICE MODEL of C4D15120A LTspice Model (Professional Model) in SPICE PARKSPICE MODEL of C4D15120A LTspice Model (Professional Model) in SPICE PARK
SPICE MODEL of C4D15120A LTspice Model (Professional Model) in SPICE PARK
 
C4 d15120a p
C4 d15120a pC4 d15120a p
C4 d15120a p
 
C4 d15120a p
C4 d15120a pC4 d15120a p
C4 d15120a p
 
C4 d15120a p
C4 d15120a pC4 d15120a p
C4 d15120a p
 
SPICE MODEL of SCS110AG , TC=125degree , LTspice (Standard Model) in SPICE PARK
SPICE MODEL of SCS110AG , TC=125degree , LTspice (Standard Model) in SPICE PARKSPICE MODEL of SCS110AG , TC=125degree , LTspice (Standard Model) in SPICE PARK
SPICE MODEL of SCS110AG , TC=125degree , LTspice (Standard Model) in SPICE PARK
 
National Forum, Montreal 2009
National Forum, Montreal 2009National Forum, Montreal 2009
National Forum, Montreal 2009
 
SPICE MODEL of C4D20120D LTspice Model (Professional Model) in SPICE PARK
SPICE MODEL of C4D20120D LTspice Model (Professional Model) in SPICE PARKSPICE MODEL of C4D20120D LTspice Model (Professional Model) in SPICE PARK
SPICE MODEL of C4D20120D LTspice Model (Professional Model) in SPICE PARK
 
SPICE MODEL of SCS110AG , TC=25degree , LTspice (Professional Model) in SPICE...
SPICE MODEL of SCS110AG , TC=25degree , LTspice (Professional Model) in SPICE...SPICE MODEL of SCS110AG , TC=25degree , LTspice (Professional Model) in SPICE...
SPICE MODEL of SCS110AG , TC=25degree , LTspice (Professional Model) in SPICE...
 

More from John Goodpasture

Five tools for managing projects
Five tools for managing projectsFive tools for managing projects
Five tools for managing projects
John Goodpasture
 
Risk management short course
Risk management short courseRisk management short course
Risk management short course
John Goodpasture
 
Agile in the waterfall
Agile in the waterfall Agile in the waterfall
Agile in the waterfall
John Goodpasture
 
RFP template
RFP templateRFP template
RFP template
John Goodpasture
 
Agile earned value exercise
Agile earned value exerciseAgile earned value exercise
Agile earned value exercise
John Goodpasture
 
Agile 103 - the three big questions
Agile 103  - the three big questionsAgile 103  - the three big questions
Agile 103 - the three big questions
John Goodpasture
 
Agile for project managers - a sailing analogy-UPDATE
Agile for project managers  - a sailing analogy-UPDATEAgile for project managers  - a sailing analogy-UPDATE
Agile for project managers - a sailing analogy-UPDATE
John Goodpasture
 
Feature driven design FDD
Feature driven design FDDFeature driven design FDD
Feature driven design FDD
John Goodpasture
 
Dynamic Systems Development, DSDM
Dynamic Systems Development, DSDMDynamic Systems Development, DSDM
Dynamic Systems Development, DSDM
John Goodpasture
 
Agile for project managers - A presentation for PMI
Agile for project managers  - A presentation for PMIAgile for project managers  - A presentation for PMI
Agile for project managers - A presentation for PMI
John Goodpasture
 
Five risk management rules for the project manager
Five risk management rules for the project managerFive risk management rules for the project manager
Five risk management rules for the project manager
John Goodpasture
 
Building Your Personal Brand
Building Your Personal BrandBuilding Your Personal Brand
Building Your Personal Brand
John Goodpasture
 
Portfolio management and agile: a look at risk and value
Portfolio management and agile: a look at risk and valuePortfolio management and agile: a look at risk and value
Portfolio management and agile: a look at risk and value
John Goodpasture
 
Project examples for sampling and the law of large numbers
Project examples for sampling and the law of large numbersProject examples for sampling and the law of large numbers
Project examples for sampling and the law of large numbers
John Goodpasture
 
Agile for project managers - a sailing analogy
Agile for project managers  - a sailing analogyAgile for project managers  - a sailing analogy
Agile for project managers - a sailing analogy
John Goodpasture
 
Risk management with virtual teams
Risk management with virtual teamsRisk management with virtual teams
Risk management with virtual teams
John Goodpasture
 
Bayes Theorem and Inference Reasoning for Project Managers
Bayes Theorem and Inference Reasoning for Project ManagersBayes Theorem and Inference Reasoning for Project Managers
Bayes Theorem and Inference Reasoning for Project Managers
John Goodpasture
 
Business value and kano chart
Business value and kano chartBusiness value and kano chart
Business value and kano chart
John Goodpasture
 
Agile for Business Analysts
Agile for Business AnalystsAgile for Business Analysts
Agile for Business Analysts
John Goodpasture
 
Time centric Earned Value
Time centric Earned ValueTime centric Earned Value
Time centric Earned Value
John Goodpasture
 

More from John Goodpasture (20)

Five tools for managing projects
Five tools for managing projectsFive tools for managing projects
Five tools for managing projects
 
Risk management short course
Risk management short courseRisk management short course
Risk management short course
 
Agile in the waterfall
Agile in the waterfall Agile in the waterfall
Agile in the waterfall
 
RFP template
RFP templateRFP template
RFP template
 
Agile earned value exercise
Agile earned value exerciseAgile earned value exercise
Agile earned value exercise
 
Agile 103 - the three big questions
Agile 103  - the three big questionsAgile 103  - the three big questions
Agile 103 - the three big questions
 
Agile for project managers - a sailing analogy-UPDATE
Agile for project managers  - a sailing analogy-UPDATEAgile for project managers  - a sailing analogy-UPDATE
Agile for project managers - a sailing analogy-UPDATE
 
Feature driven design FDD
Feature driven design FDDFeature driven design FDD
Feature driven design FDD
 
Dynamic Systems Development, DSDM
Dynamic Systems Development, DSDMDynamic Systems Development, DSDM
Dynamic Systems Development, DSDM
 
Agile for project managers - A presentation for PMI
Agile for project managers  - A presentation for PMIAgile for project managers  - A presentation for PMI
Agile for project managers - A presentation for PMI
 
Five risk management rules for the project manager
Five risk management rules for the project managerFive risk management rules for the project manager
Five risk management rules for the project manager
 
Building Your Personal Brand
Building Your Personal BrandBuilding Your Personal Brand
Building Your Personal Brand
 
Portfolio management and agile: a look at risk and value
Portfolio management and agile: a look at risk and valuePortfolio management and agile: a look at risk and value
Portfolio management and agile: a look at risk and value
 
Project examples for sampling and the law of large numbers
Project examples for sampling and the law of large numbersProject examples for sampling and the law of large numbers
Project examples for sampling and the law of large numbers
 
Agile for project managers - a sailing analogy
Agile for project managers  - a sailing analogyAgile for project managers  - a sailing analogy
Agile for project managers - a sailing analogy
 
Risk management with virtual teams
Risk management with virtual teamsRisk management with virtual teams
Risk management with virtual teams
 
Bayes Theorem and Inference Reasoning for Project Managers
Bayes Theorem and Inference Reasoning for Project ManagersBayes Theorem and Inference Reasoning for Project Managers
Bayes Theorem and Inference Reasoning for Project Managers
 
Business value and kano chart
Business value and kano chartBusiness value and kano chart
Business value and kano chart
 
Agile for Business Analysts
Agile for Business AnalystsAgile for Business Analysts
Agile for Business Analysts
 
Time centric Earned Value
Time centric Earned ValueTime centric Earned Value
Time centric Earned Value
 

Quantitative methods schedule

  • 1. Mitigating Risk in Schedules Quantitative Methods in Project Management Produced by Square Peg Consulting, LLC John C. Goodpasture Managing Principal www.sqpegconsulting.com Copyright 2010, John C Goodpasture, All Rights Reserved 1
  • 2. About Confidence • Likelihood an event will occur within a range • A number from 0 to 1 • Cumulative summation of probabilities within the range Copyright 2010, John C Goodpasture, All Rights Reserved
  • 3. Confidence ―S‖ Curve 1 Cumulative Probability 0.75 0.5 0.25 0 -3.5 -3 -2.5 -2 -1.5 -1 -0.5 0 0.5 1 1.5 2 2.5 3 3.5 Normalized value Value / Standard deviation, σ Normalized cumulative probability from ‗bell‘ curve Copyright 2010, John C Goodpasture, All Rights Reserved
  • 4. Confidence ―S‖ Curve 1. 68% confidence: value between -1 to +1 2. 16% confidence: value > 1 3. 84% confidence: value < 1 2 1 Cumulative Probability 0.75 0.5 1 0.25 0 -3.5 -3 -2.5 -2 -1.5 -1 -0.5 0 0.5 1 1.5 2 2.5 3 3.5 3 1 2 Copyright 2010, John C Goodpasture, All Rights Reserved
  • 5. Generating Confidence Probability Distribution f(v) Area = Height (probability) X Probability p f(v) width (Δ Value) Δ value 0.0 0.5 1.0 1.5 2.0 2.5 3.0 3.5 Normalized random variable value Calculate each ―Area increment‖ Δ value x p Copyright 2010, John C Goodpasture, All Rights Reserved
  • 6. Sum & Plot area increments F(v) = 1 is the limiting value f(v)Δv F(v) Area increments summed Value F(v) is the area under the f(v) curve Copyright 2010, John C Goodpasture, All Rights Reserved
  • 7. Schedule Network Architecture 1 What is to be expected at the milestone? 0.45 0.4 0.35 0.3 0.25 0.2 0.15 0.1 0.05 0 1 2 3 4 5 6 Copyright 2010, John C Goodpasture, All Rights Reserved
  • 8. Schedule Network Architecture 1 EV 0.3 0.25 0.2 0.15 0.1 0.05 0 1 2 3 4 5 6 7 8 9 10 11 12 Convolved task probabilities 0.45 0.4 0.35 0.3 EV 0.25 0.2 EVmilestone = Sum (EV in tandem) 0.15 0.1 0.05 0 1 2 3 4 5 6 Copyright 2010, John C Goodpasture, All Rights Reserved
  • 9. Schedule Network Architecture 1 0.3 0.25 0.2 0.15 0.1 0.05 0 1.2 1 2 3 4 5 6 7 8 9 10 11 12 1 0.8 0.6 1.2 0.4 1 0.2 0.8 0 0.6 1 2 3 4 5 6 0.4 0.2 0 Value = 1 2 3 4 5 6 7 8 9 10 11 12 Sum values at a constant confidence Copyright 2010, John C Goodpasture, All Rights Reserved
  • 10. Monte Carlo simulation Date 1/1 1/21 1.1 1.2 2/12 1.3 3/15 12 weeks, 60 work days 1.4 3/25 Risk Parameters for each Task: • Risk distribution: Triangular • Most optimistic: -10% of ML duration • Most pessimistic: +25% of ML duration • ML finish dates shown Copyright 2010, John C Goodpasture, All Rights Reserved
  • 11. Monte Carlo simulation Date 1/1 1/21 1.1 1.2 2/12 1.3 3/15 Includes effects of non- 1.4 3/25 working days 10:30:27 PM Date: 3/9/99 Name: Task 1.4 170 1.0 1.0 Completion Std Deviation: 2.4d Cumulative Probability 153 0.9 Each bar represents 1d. 136 0.8 119 0.7 102 0.6 Completion Probability Table Sample Count 85 0.5 0.5 Prob Date Prob Date 0.05 3/25/99 0.55 3/31/99 68 0.4 0.10 3/25/99 0.60 3/31/99 51 0.3 0.15 3/26/99 0.65 4/1/99 34 0.2 0.20 3/26/99 0.70 4/1/99 0.25 3/29/99 0.75 4/1/99 17 0.1 0.30 3/29/99 0.80 4/2/99 3/23/99 3/31/99 4/9/99 0.35 3/29/99 0.85 4/2/99 3/23 3/31 4/9 0.40 3/30/99 0.90 4/5/99 0.45 3/30/99 0.95 4/6/99 Completion Date range 0.50 3/30/99 1.00 4/9/99 Copyright 2010, John C Goodpasture, All Rights Reserved
  • 12. Monte Carlo simulation Date 1/1 1/21 1.1 1.2 2/12 1.3 3/15 1.4 3/25 Date: 3/9/99 10:30:27 PM Name: Task 1.4 170 1.0 1.0 Cumulative Probability 153 0.9 136 0.8 Risk Evaluation: 3/25 CPM date is 119 0.7 about 10% probable 102 0.6 Sample Count 85 0.5 0.5 68 0.4 51 0.3 34 0.2 17 0.1 3/23/99 3/31/99 3/31 4/9/99 3/23 4/9 Completion Date range Copyright 2010, John C Goodpasture, All Rights Reserved
  • 13. Budgets? • Are the effects on budget totals any different when adding up a string of $budgets from the WBS work packages? Copyright 2010, John C Goodpasture, All Rights Reserved
  • 14. Schedule Network Architecture 2 What happens at the milestone? 0.45 0.4 0.35 0.3 0.25 0.2 0.15 0.1 0.05 0 1 2 3 4 5 6 Copyright 2010, John C Goodpasture, All Rights Reserved
  • 15. Schedule Network Architecture 2 What happens at the milestone? Lots of combinations—36 possible outcomes 0.2 0.18 0.16 0.14 0.12 0.1 Series1 0.08 0.06 0.04 0.02 0 1 2 3 4 5 6 8 9 10 12 15 16 18 20 24 25 30 36 Duration value ‗12‘ combo  milestone value could be 4 or 6 Copyright 2010, John C Goodpasture, All Rights Reserved
  • 16. Schedule Network Architecture 2 Durations, d1 and d2 Milestone, m What happens at the milestone? •Confidence at the milestone is the product of the confidences of the joining paths 1.2 1 0.8 0.6 0.4 0.2 0 1 2 3 4 5 6 Copyright 2010, John C Goodpasture, All Rights Reserved
  • 17. Schedule Network Architecture 2 Durations, d1 and d2 Milestone, m What happens at the milestone? Confidence degrades Shift right to recover confidence 1.2 1 0.8 1.2 0.6 1 0.8 0.4 0.6 0.2 0.4 0 0.2 1 2 3 4 5 6 0 1 2 3 4 5 6 Copyright 2010, John C Goodpasture, All Rights Reserved
  • 18. Schedule Network Architecture 2 Durations, d1 and d2 Milestone, m What happens at the milestone? Probability ‗center of gravity‘ shifts right EV increases from 3.6 to 4.2 Critical path may change 0.6 0.5 EV 0.4 0.3 0.2 0.1 0 1 2 3 4 5 6 Copyright 2010, John C Goodpasture, All Rights Reserved
  • 19. Monte Carlo Simulation 1/21 3/15 1/1 2/12 3/25 3/15 1/21 2/12 Date: 3/9/99 10:30:27 PM 3/25 Name: Task 1.4 170 1.0 1.0 • Milestone distribution for each Cumulative Probability 153 0.9 136 0.8 119 102 0.7 0.6 independent path Sample Count 85 0.5 0.5 • 50% confidence of 3/30 completion 68 0.4 51 0.3 34 0.2 17 0.1 3/23/99 3/31/99 3/31 4/9/99 3/23 4/9 Completion Date range Copyright 2010, John C Goodpasture, All Rights Reserved
  • 20. Monte Carlo Simulation 3/15 3/25 Probability of 3/30 = Join independent 0.5 x 0.5 = 0.25, or less 3/15 paths at milestone 3/25 Date: 3/8/99 9:31:06 PM Number of Samples: 2000 Unique ID: 12 Name: Finish Milestone 1.0 Completion Probability Table 0.9 Cumulative Probability Prob Date Prob Date 0.8 0.05 3/29/99 0.55 4/1/99 0.7 0.10 3/29/99 0.60 4/1/99 0.15 3/30/99 0.65 4/2/99 0.6 0.20 3/30/99 0.70 4/2/99 0.5 0.25 3/30/99 0.75 4/2/99 0.4 0.30 3/31/99 0.80 4/2/99 0.35 3/31/99 0.85 4/5/99 0.3 0.40 3/31/99 0.90 4/5/99 0.2 0.45 3/31/99 0.95 4/6/99 0.1 0.50 4/1/99 1.00 4/12/99 3/24/99 4/1/99 4/12/99 Completion Date Copyright 2010, John C Goodpasture, All Rights Reserved
  • 21. Event Chain Methodology • Extension of Monte Carlo simulation method. • Events occur at probabilistic nodes • Probabilistic nodes can be in the middle of the task and lead to task delay, restart, cancellation • Events can cause other events and generate event chains p = 0.2 Probabilistic node Alternative p = 0.8 Baseline outcome Copyright 2010, John C Goodpasture, All Rights Reserved
  • 22. Build a path 80 days for the path shown Task Duration is shown in days (#): C(15) G(20) I(8) A(12) Float = 25d D(21) J(13) L(12) H(3) O(9) Start End E(15) K(21) M(14) B(11) Float = 33d F(18) N(20) Copyright 2010, John C Goodpasture, All Rights Reserved
  • 23. Build a network schedule A(12) Every network at least one Critical Path CP = 80 days; Additional paths are 49, 57, or 63, 73 days < 82 days C(15) G(20) I(8) A(12) Float = 25d D(21) J(13) L(12) H(3) O(9) Start End E(15) K(21) M(14) B(11) Float = 33d F(18) N(20) Copyright 2010, John C Goodpasture, All Rights Reserved
  • 24. Critical path shifts with variation B(11) Critical path is 81.5 days Former path at 50%; new path at 80% C(15) G(20) I(8) A(12) Float = 25d D(21) J(13) L(12) H(3) O(10) Start End E(17) K(23) M(16) B(12) Float = 33d F(18) N(20) Copyright 2010, John C Goodpasture, All Rights Reserved
  • 25. Critical path shifts with variation Three milestones will shift the END & change CP probabilities C(15) G(20) I(8) A(12) Float = 25d D(21) J(13) L(12) H(3) O(10) Start End E(17) K(23) M(16) B(12) Float = 33d F(18) N(20) Copyright 2010, John C Goodpasture, All Rights Reserved
  • 26. ―Critical Chain‖ buffers uncertainty 10 days Project Buffer Project buffer 15 days 10 days protects final milestone from variation Task on the critical path Critical chain is a concept developed in the book Critical Chain (Goldratt, 1997) Copyright 2010, John C Goodpasture, All Rights Reserved
  • 27. ―Critical Chain‖ buffers uncertainty 1 2 10 days 11 days 12 days Buffer Project Buffer Path buffer mitigates 15 days 10 days “shift right” at the milestone of joining path Task on the critical path Task with risky duration, not on critical path Critical chain is a concept developed in the book Critical Chain (Goldratt, 1997) Copyright 2010, John C Goodpasture, All Rights Reserved
  • 28. Resources on the CP Rule # 1: CP work begins at project beginning Task 1 20d 30d Critical Path = 50d Task 2 5d 15d Copyright 2010, John C Goodpasture, All Rights Reserved
  • 29. Resources on the CP Rule # 2: Resource CP first and then level Task 1 Mary 20d John 30d Critical Path = 65d Mary John 15d Task 2 5d Float Copyright 2010, John C Goodpasture, All Rights Reserved
  • 30. CP responds to constraints Rule # 3: Reorganize the network logic Mary 20d John 30d Critical Path = 55d Task 1 Mary Task 2 John 15d 5d Work does not begin first on the CP Copyright 2010, John C Goodpasture, All Rights Reserved
  • 31. Resource consequences • Resource dependencies lengthen the schedule • In fact, any loss of independence from any cause will lengthen the schedule! • Resource constraints may require work begin off the CP Copyright 2010, John C Goodpasture, All Rights Reserved
  • 32. Project manager’s mission: To defeat an unfavorable forecast and deliver customer value, taking reasonable risks to do so Copyright 2010, John C Goodpasture, All Rights Reserved
  • 33. Graphic Earned Schedule, ES Value Cumulative ES Variance Schedule AT = actual time ES = earned schedule Copyright 2010, John C Goodpasture, All Rights Reserved
  • 34. Graphic Earned Schedule, ES • ES will never be 0 for a late project • EV schedule variance, EV – PV, will always be 0 for a completed project EV = PV Value Cumulative ES Variance Schedule AT ES Copyright 2010, John C Goodpasture, All Rights Reserved
  • 35. What‘s been learned? • Confidence expresses probability over a range • Confidence is based on the cumulative probability, a.k.a. the ‗area under the curve‘ • Confidence is constant in tandem strings, whether budget or schedule, but degrades rapidly at a parallel join • Monte Carlo simulations give results very close to calculated ‗ideals‘ • Earned schedule will not have a 0 variance when all value is earned Copyright 2010, John C Goodpasture, All Rights Reserved