Download as PDF, PPTX


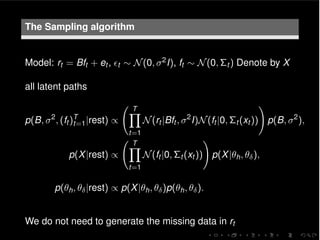

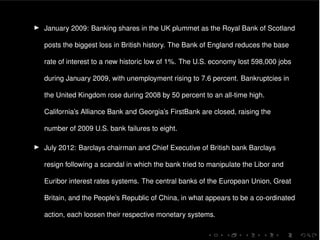
![O(K2) computation for the K-factor MSV model
I ft ⇠ N(0, ⌃t ), ⌃t = Ut ⇤t UT
t , Ut =
Q K(K 1)
2
j=1
Gjt
log MSV(ft ) =
K
2
log(2⇡)
1
2
KX
i=1
hit
1
2
vT
t vt , (1)
where vt = ⇤
1
2
t UT
t ft and where we used that log |⌃t | = log |⇤t | =
PK
i=1 hit .
I Given vt the above expression takes O(K) time to compute.
I Gij (!ji,t )T ft takes O(1) time to compute since all of its elements are equal to the
corresponding ones from the vector ft apart from the i-th and j-th elements that
become ft [i] cos(!ji,t ) ft [i] sin(!ji,t ) and ft [j] sin(!ji,t ) + ft [j] cos(!ji,t ),
respectively.
I Similarly rht
log MSV and r!ij,t
log MSV are calculated in O(K2) time.](https://image.slidesharecdn.com/syrtodellaportas-160226110956/85/Scalable-inference-for-a-full-multivariate-stochastic-volatility-16-320.jpg)
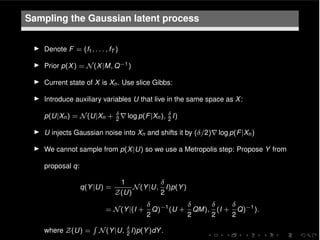
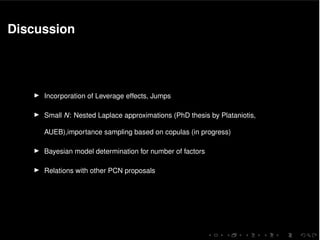
![O(N2) computation for the MSV model
Initialize vt = ft .
for i = 1 to N 1 do
for j = i + 1 to N do
c = cos(!ji,t ), s = sin(!ji,t )
t1 = vt [i], t2 = vt [j]
vt [i] c ⇤ t1 s ⇤ t2
vt [j] s ⇤ t1 + c ⇤ t2
end for
end for
vt = vt diag(⇤
1
2
t ) (elementwise product)](https://image.slidesharecdn.com/syrtodellaportas-160226110956/85/Scalable-inference-for-a-full-multivariate-stochastic-volatility-17-320.jpg)
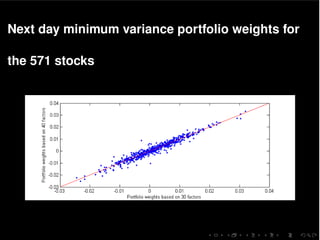
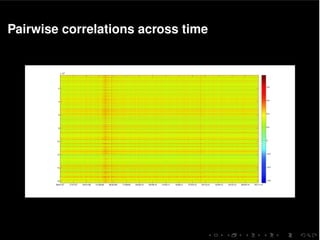
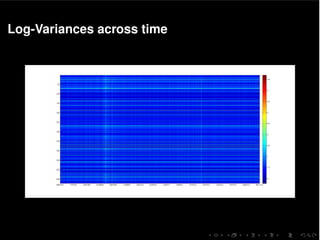


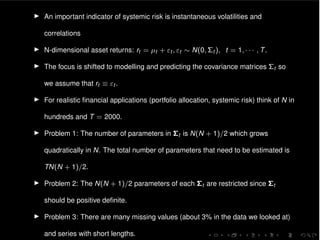
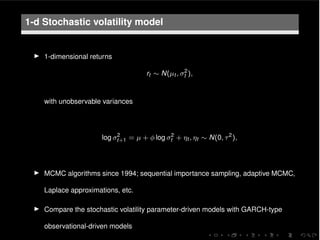
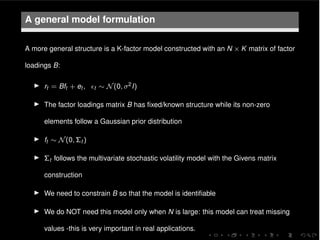
The document discusses a multivariate stochastic volatility model aimed at assessing systemic risk through the modeling and prediction of covariance matrices of asset returns. It highlights challenges including parameter estimation, handling missing values, and computational efficiency while exploring methodologies such as MCMC algorithms for improving scalability. The study uses empirical data from the European STOXX 600 index to validate the model, contributing to the understanding of financial stability and risk management.