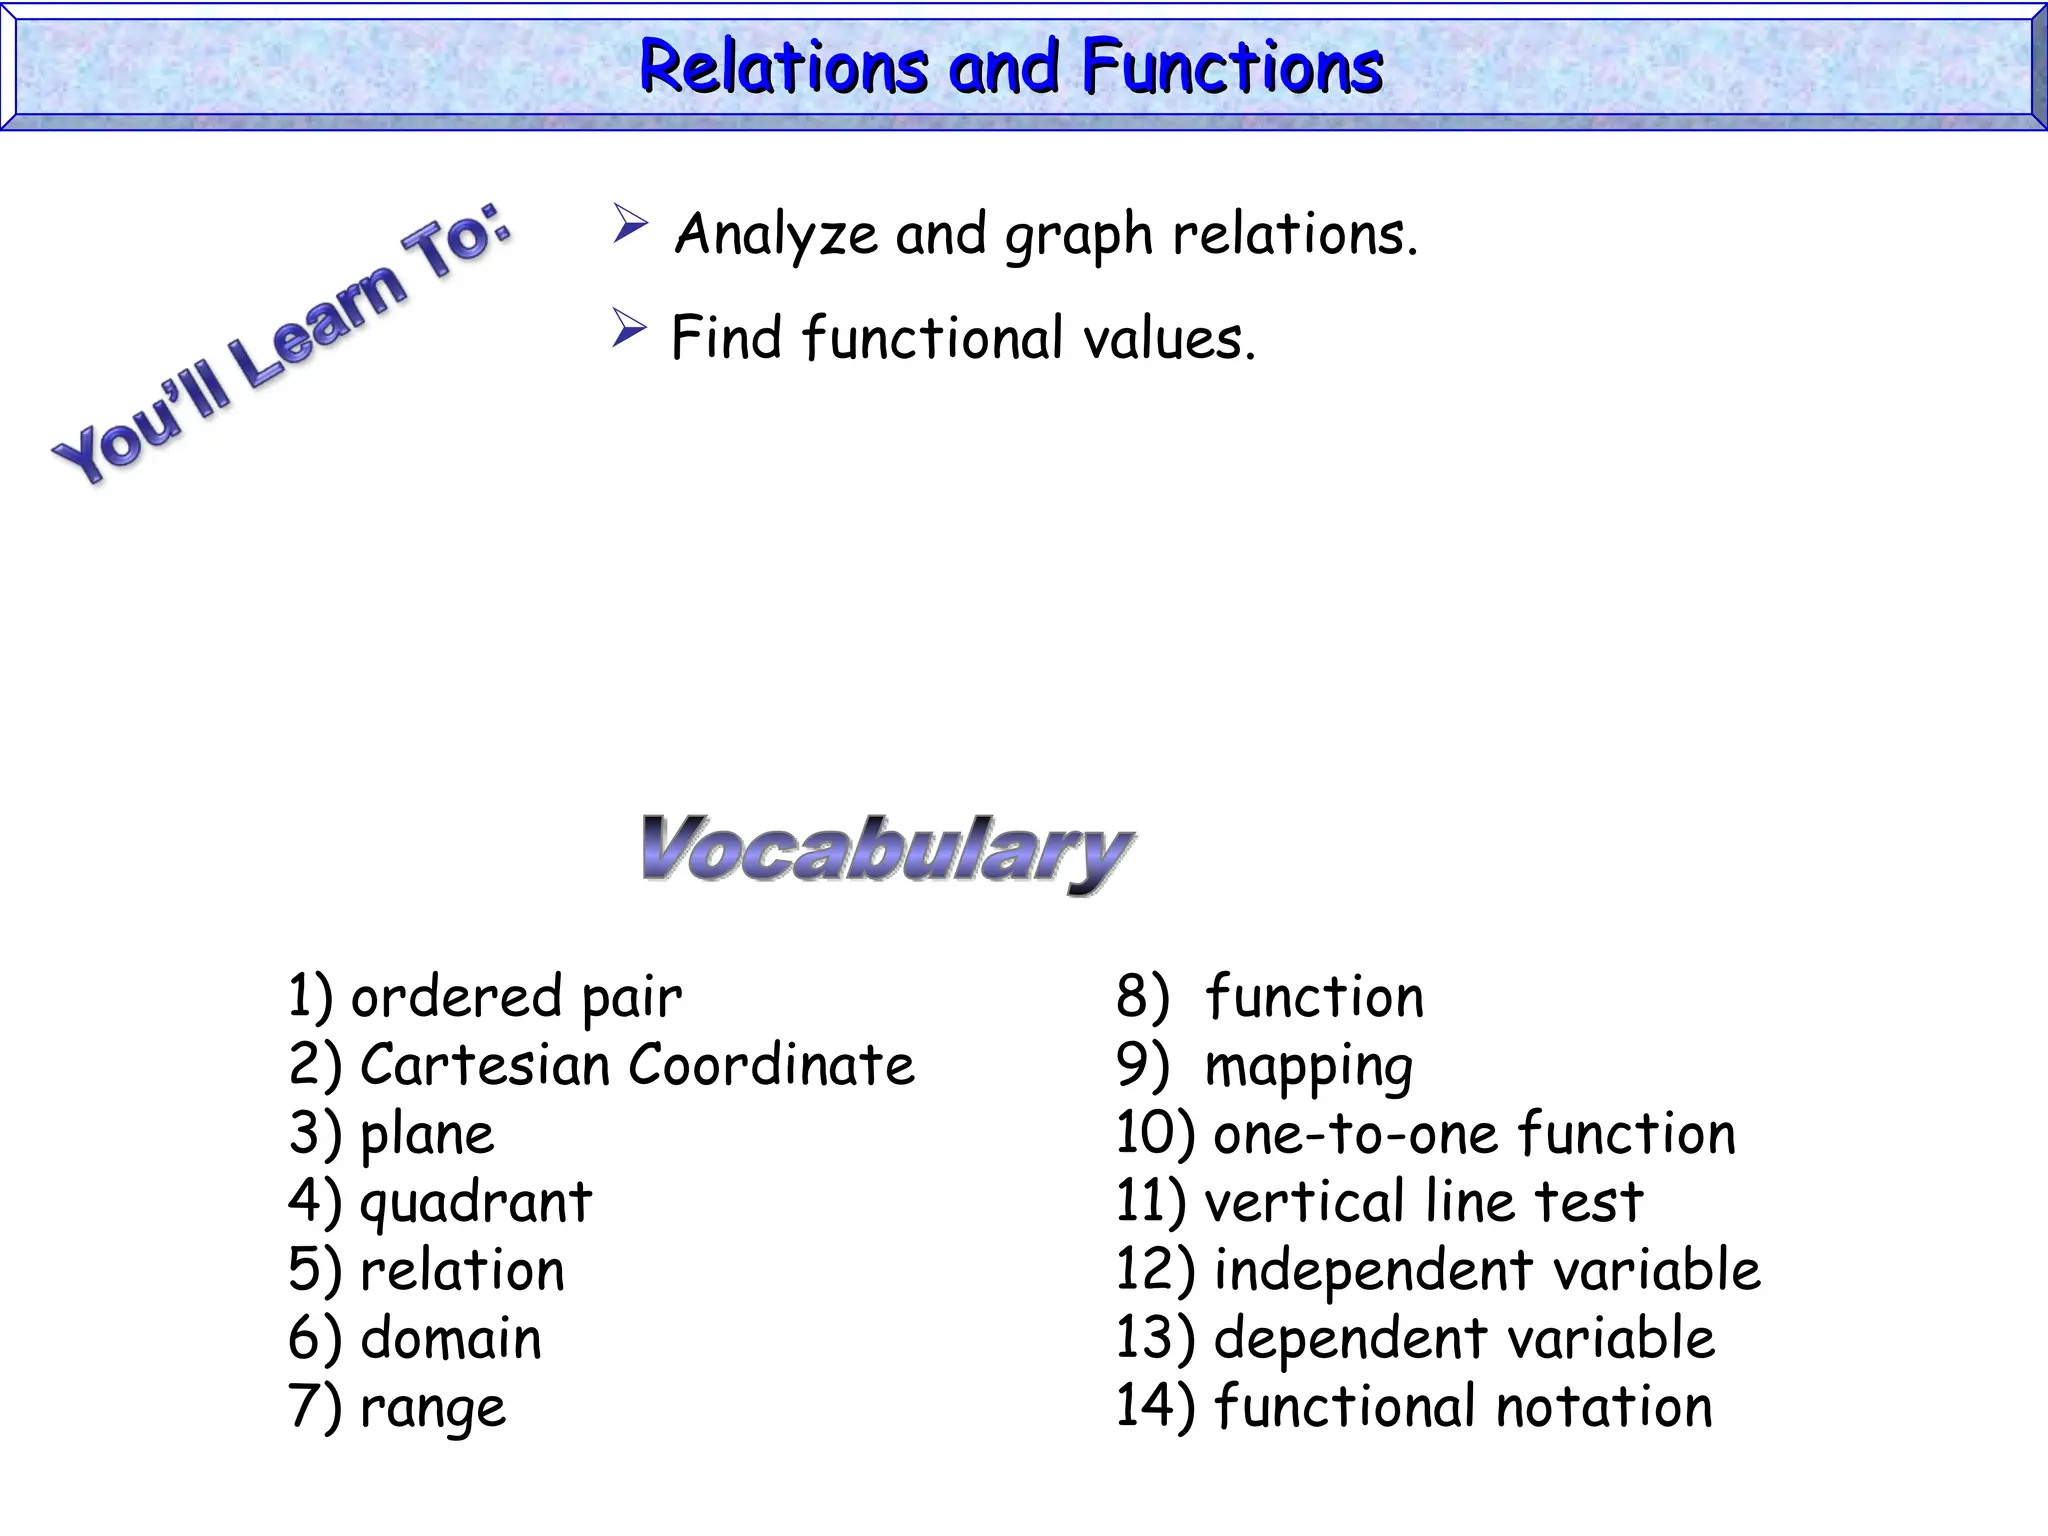
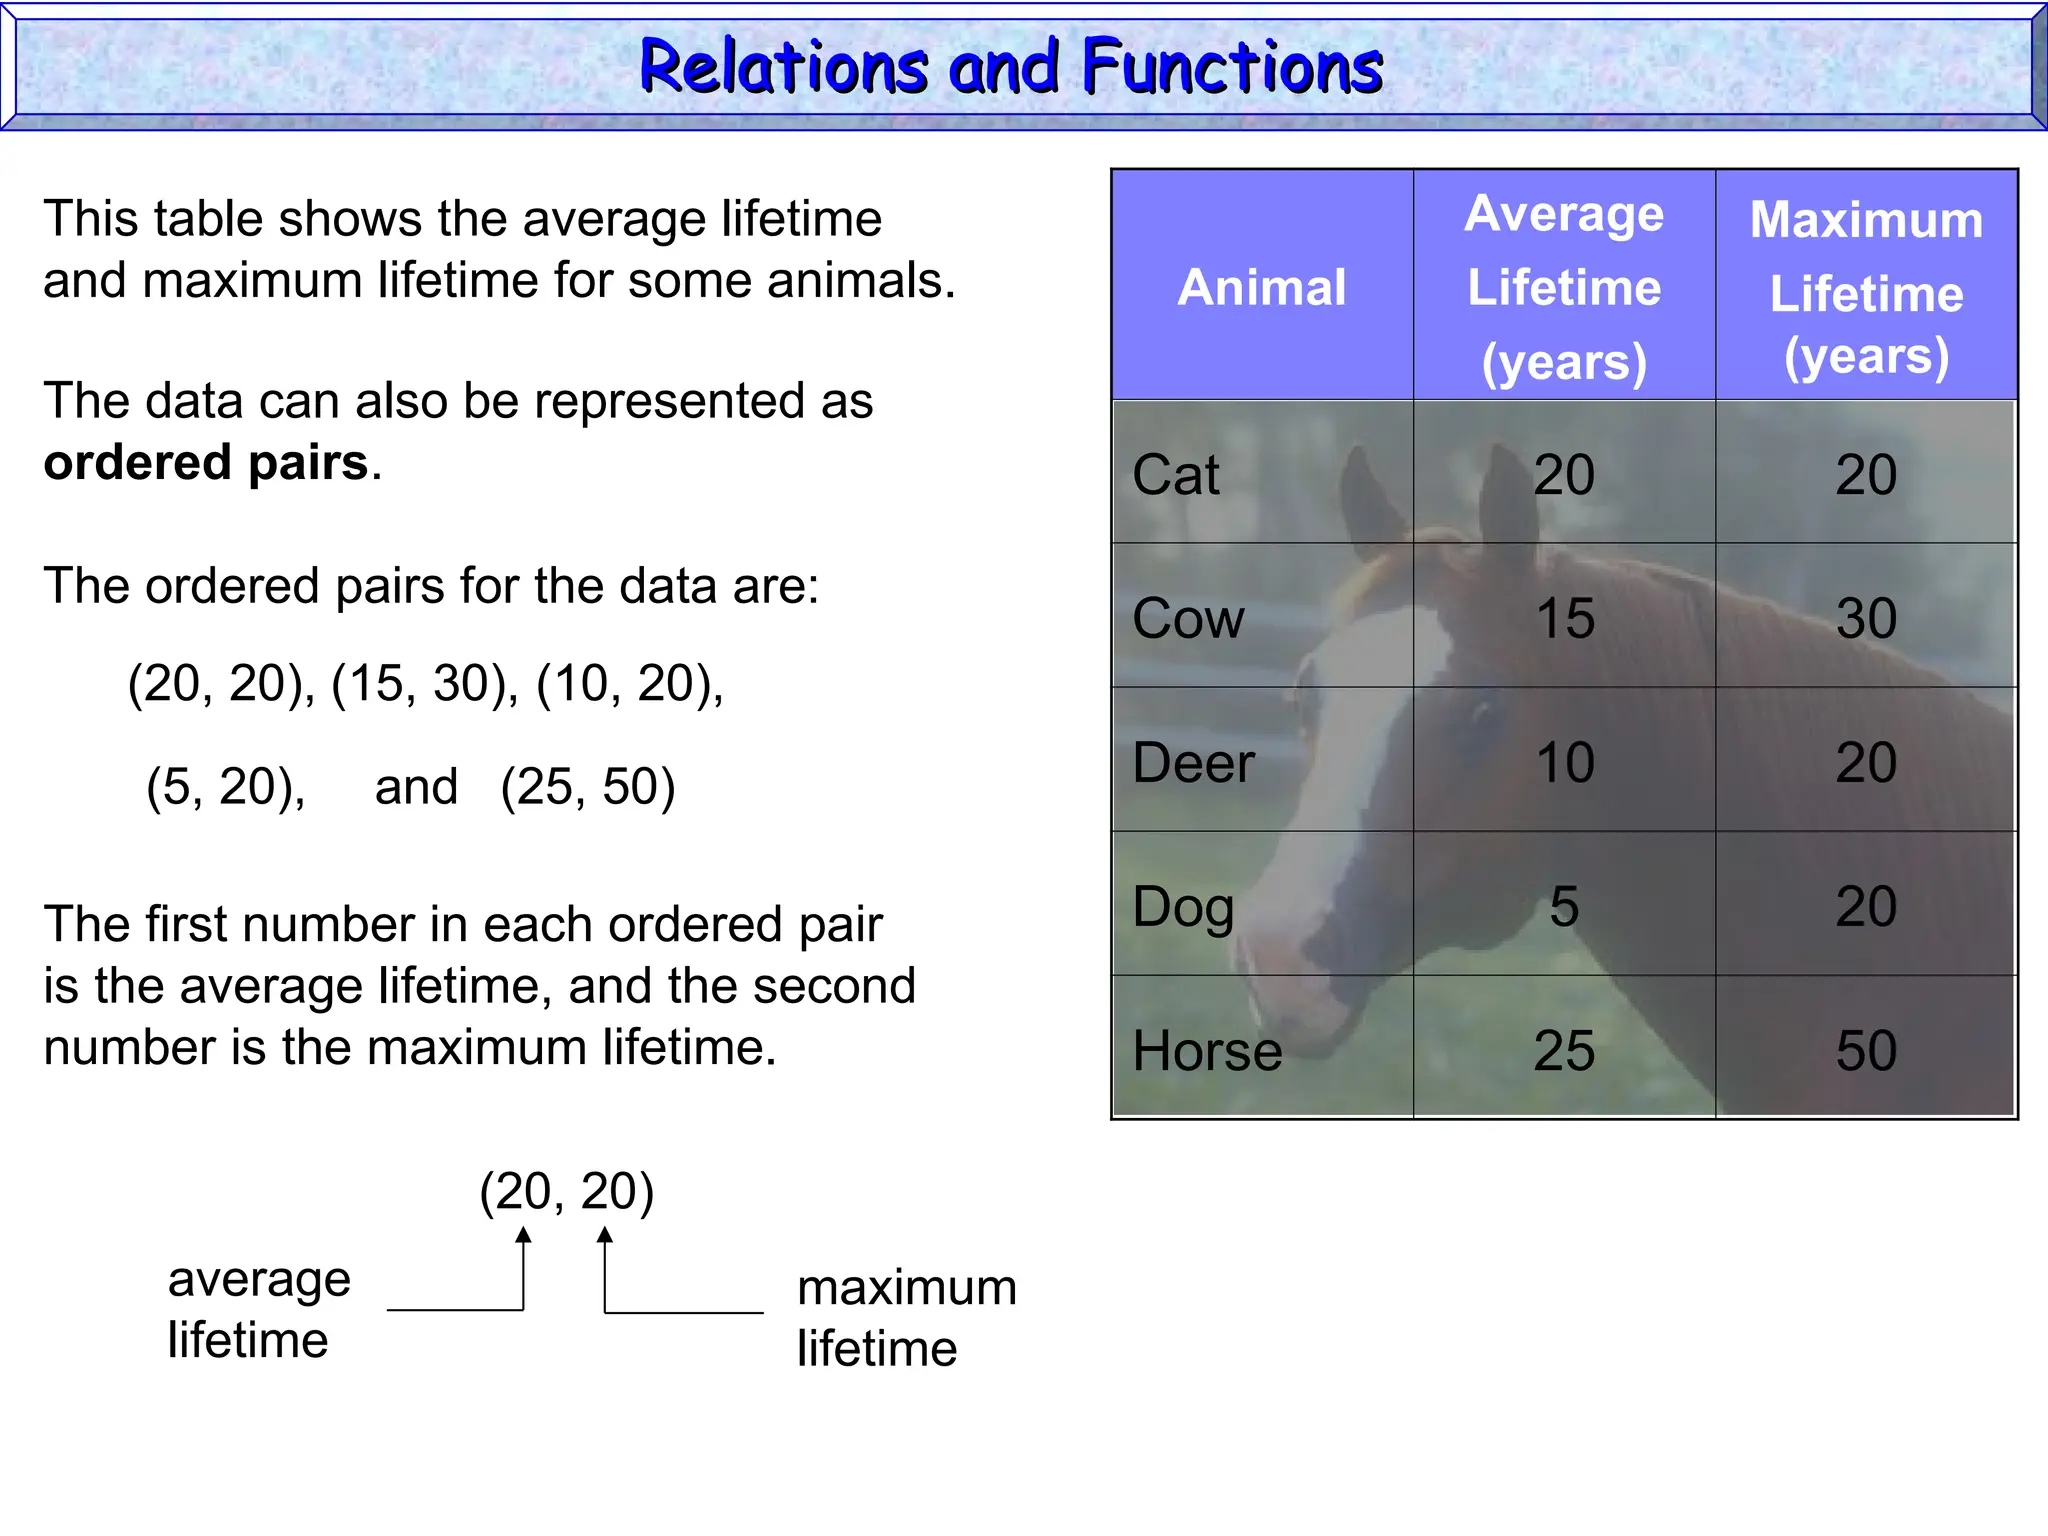
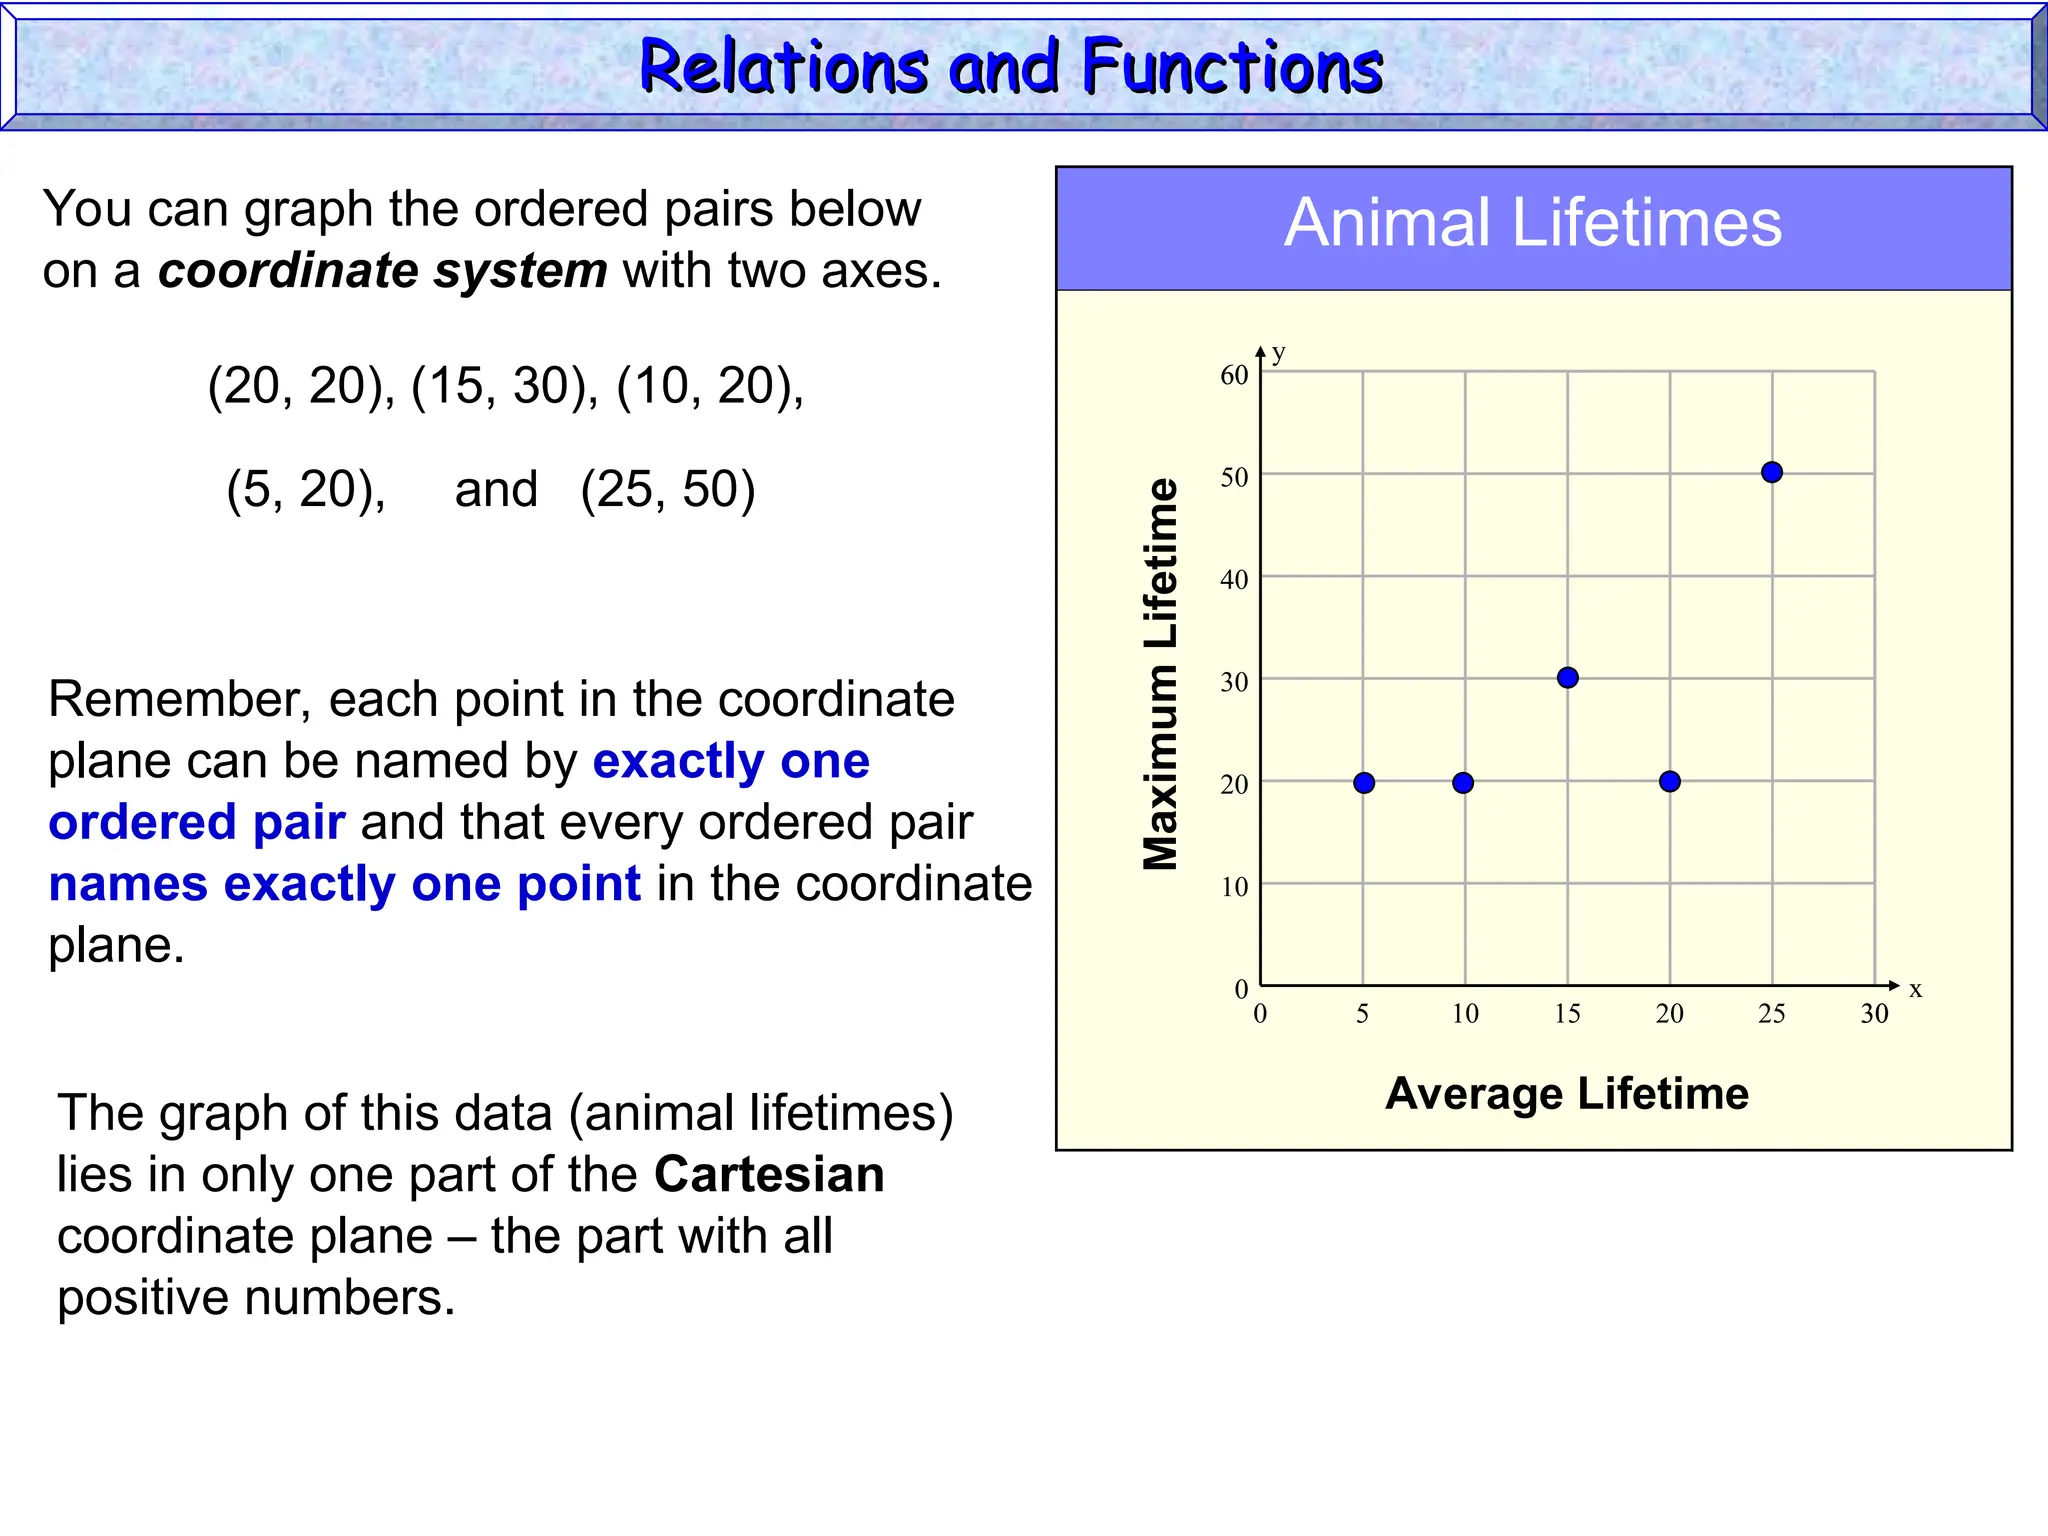
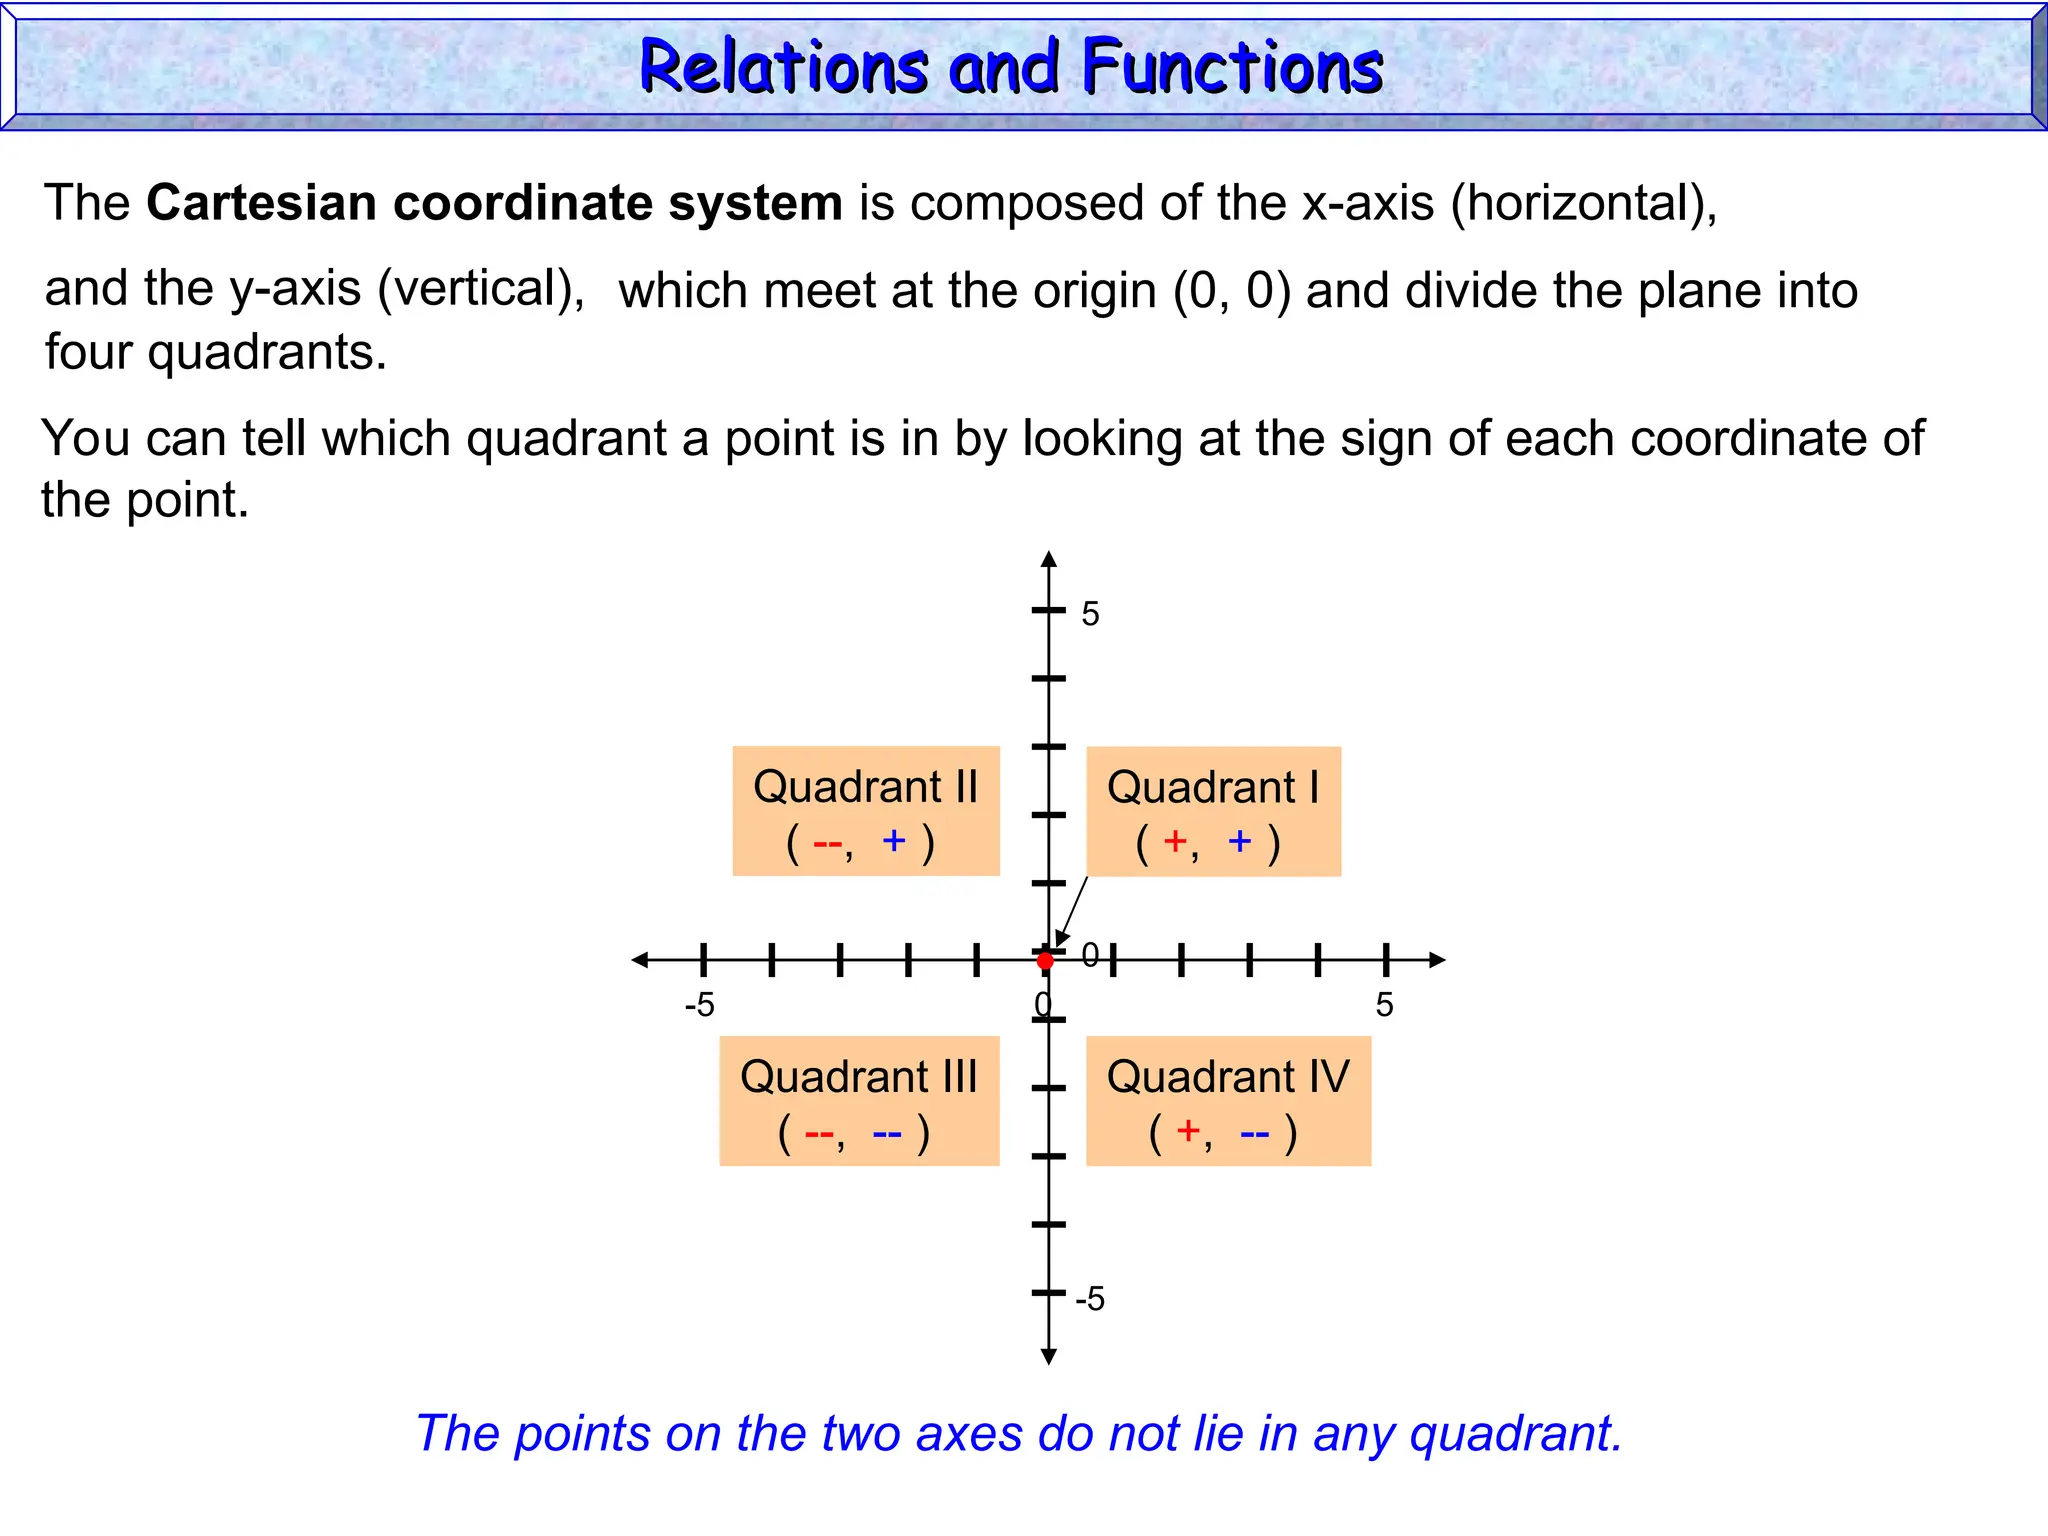
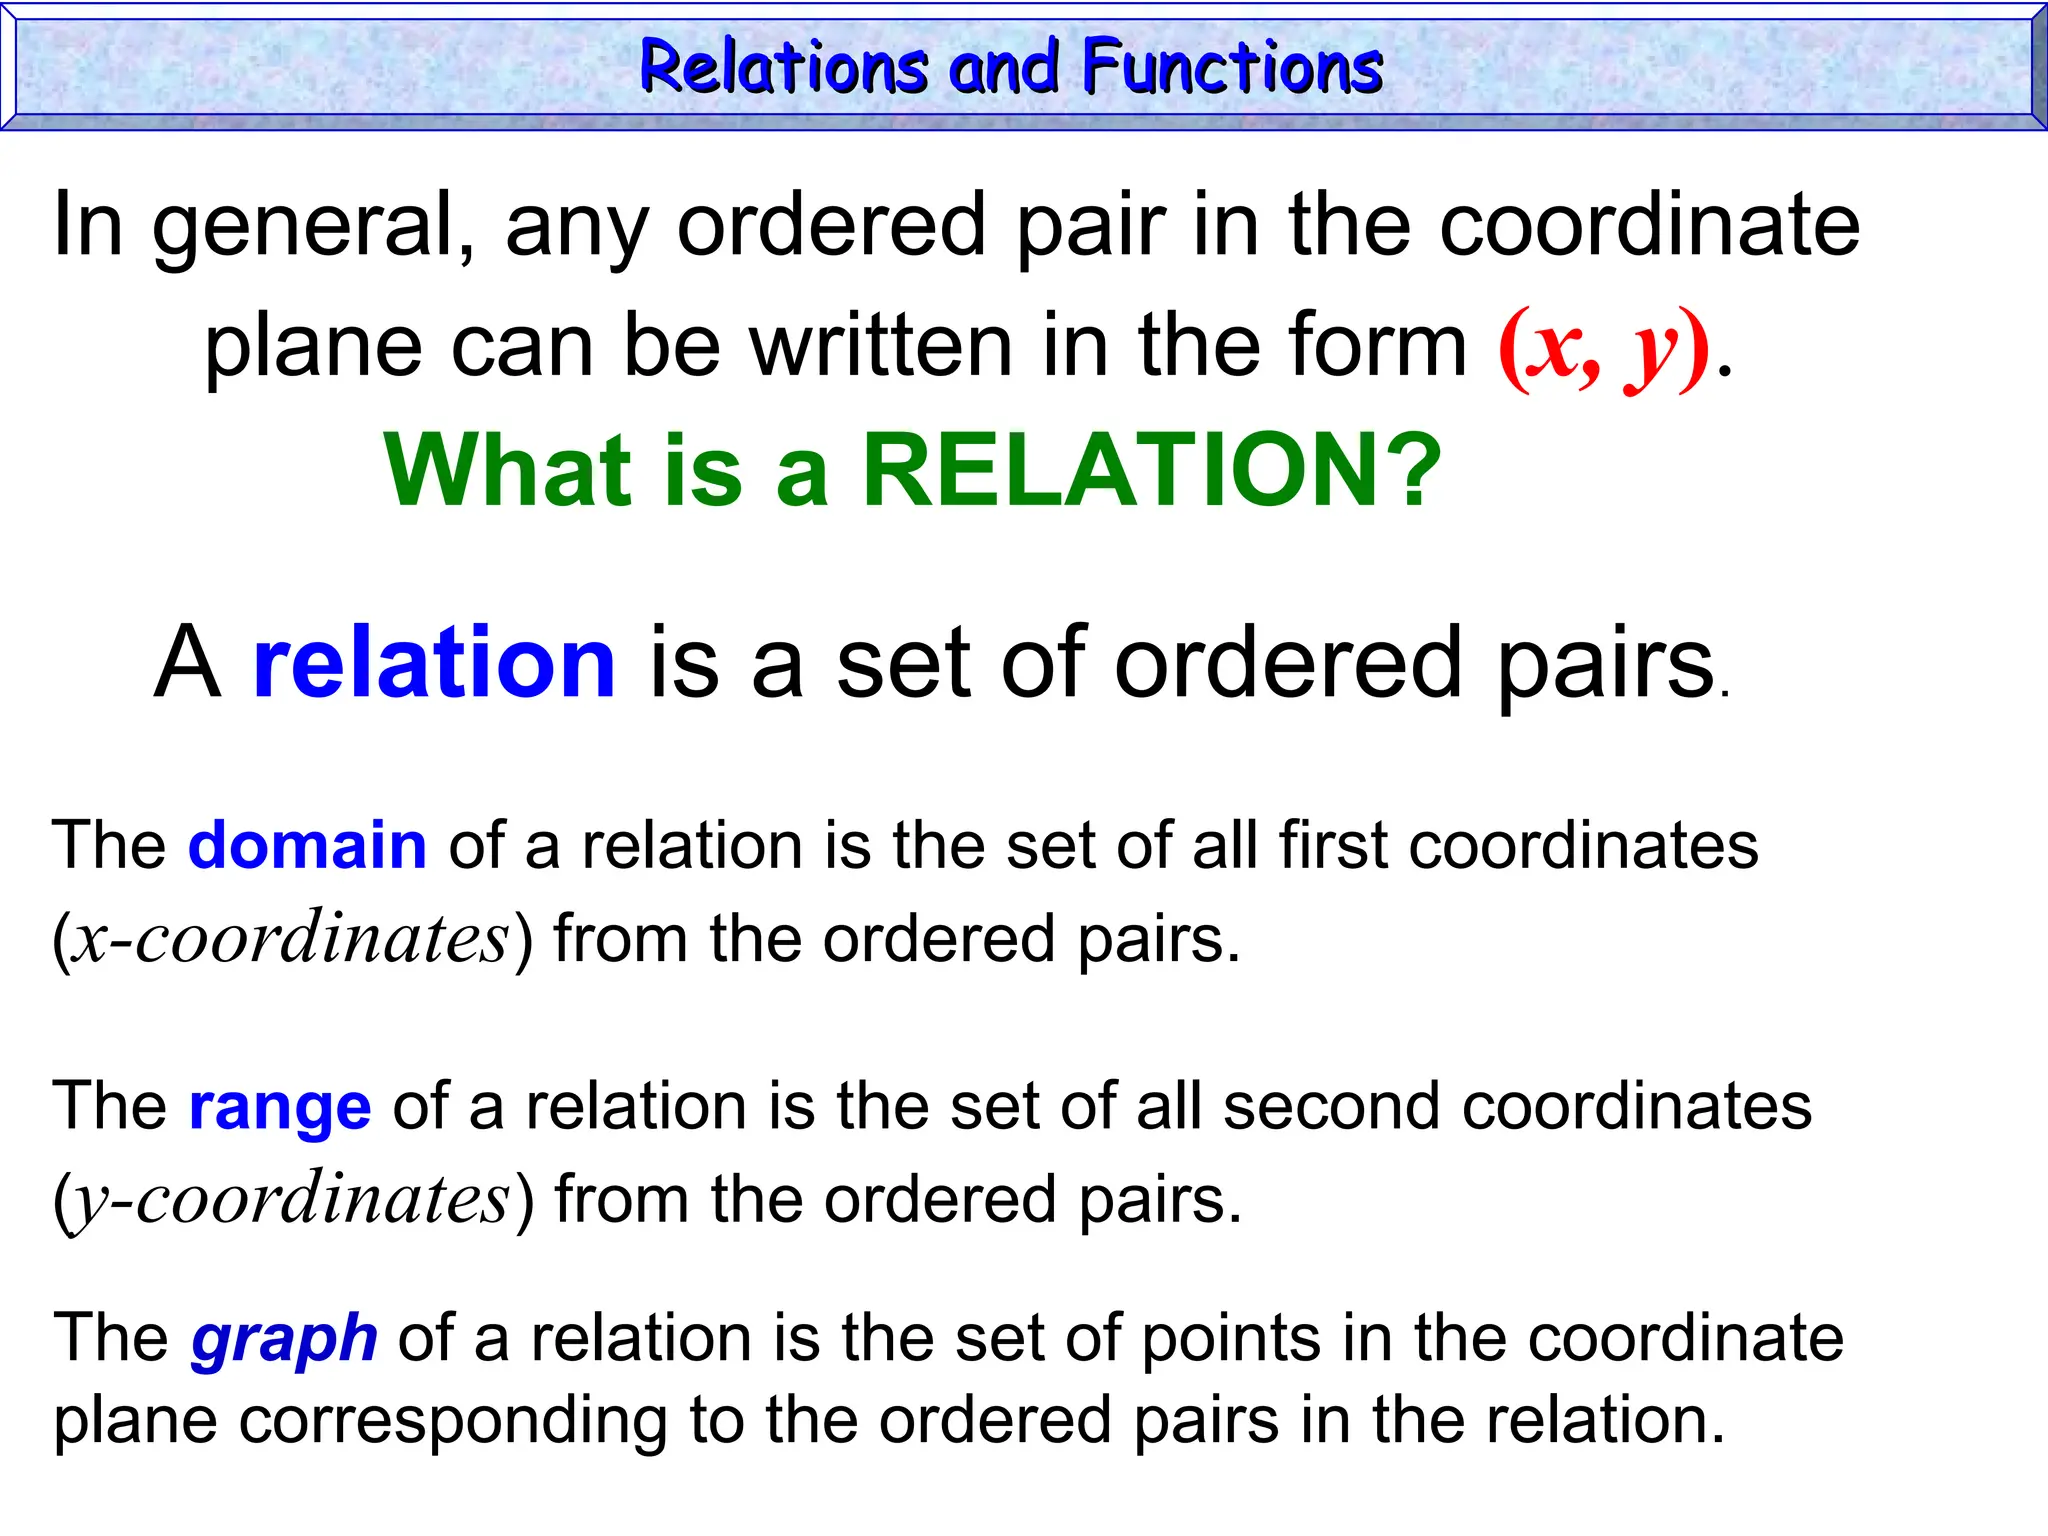
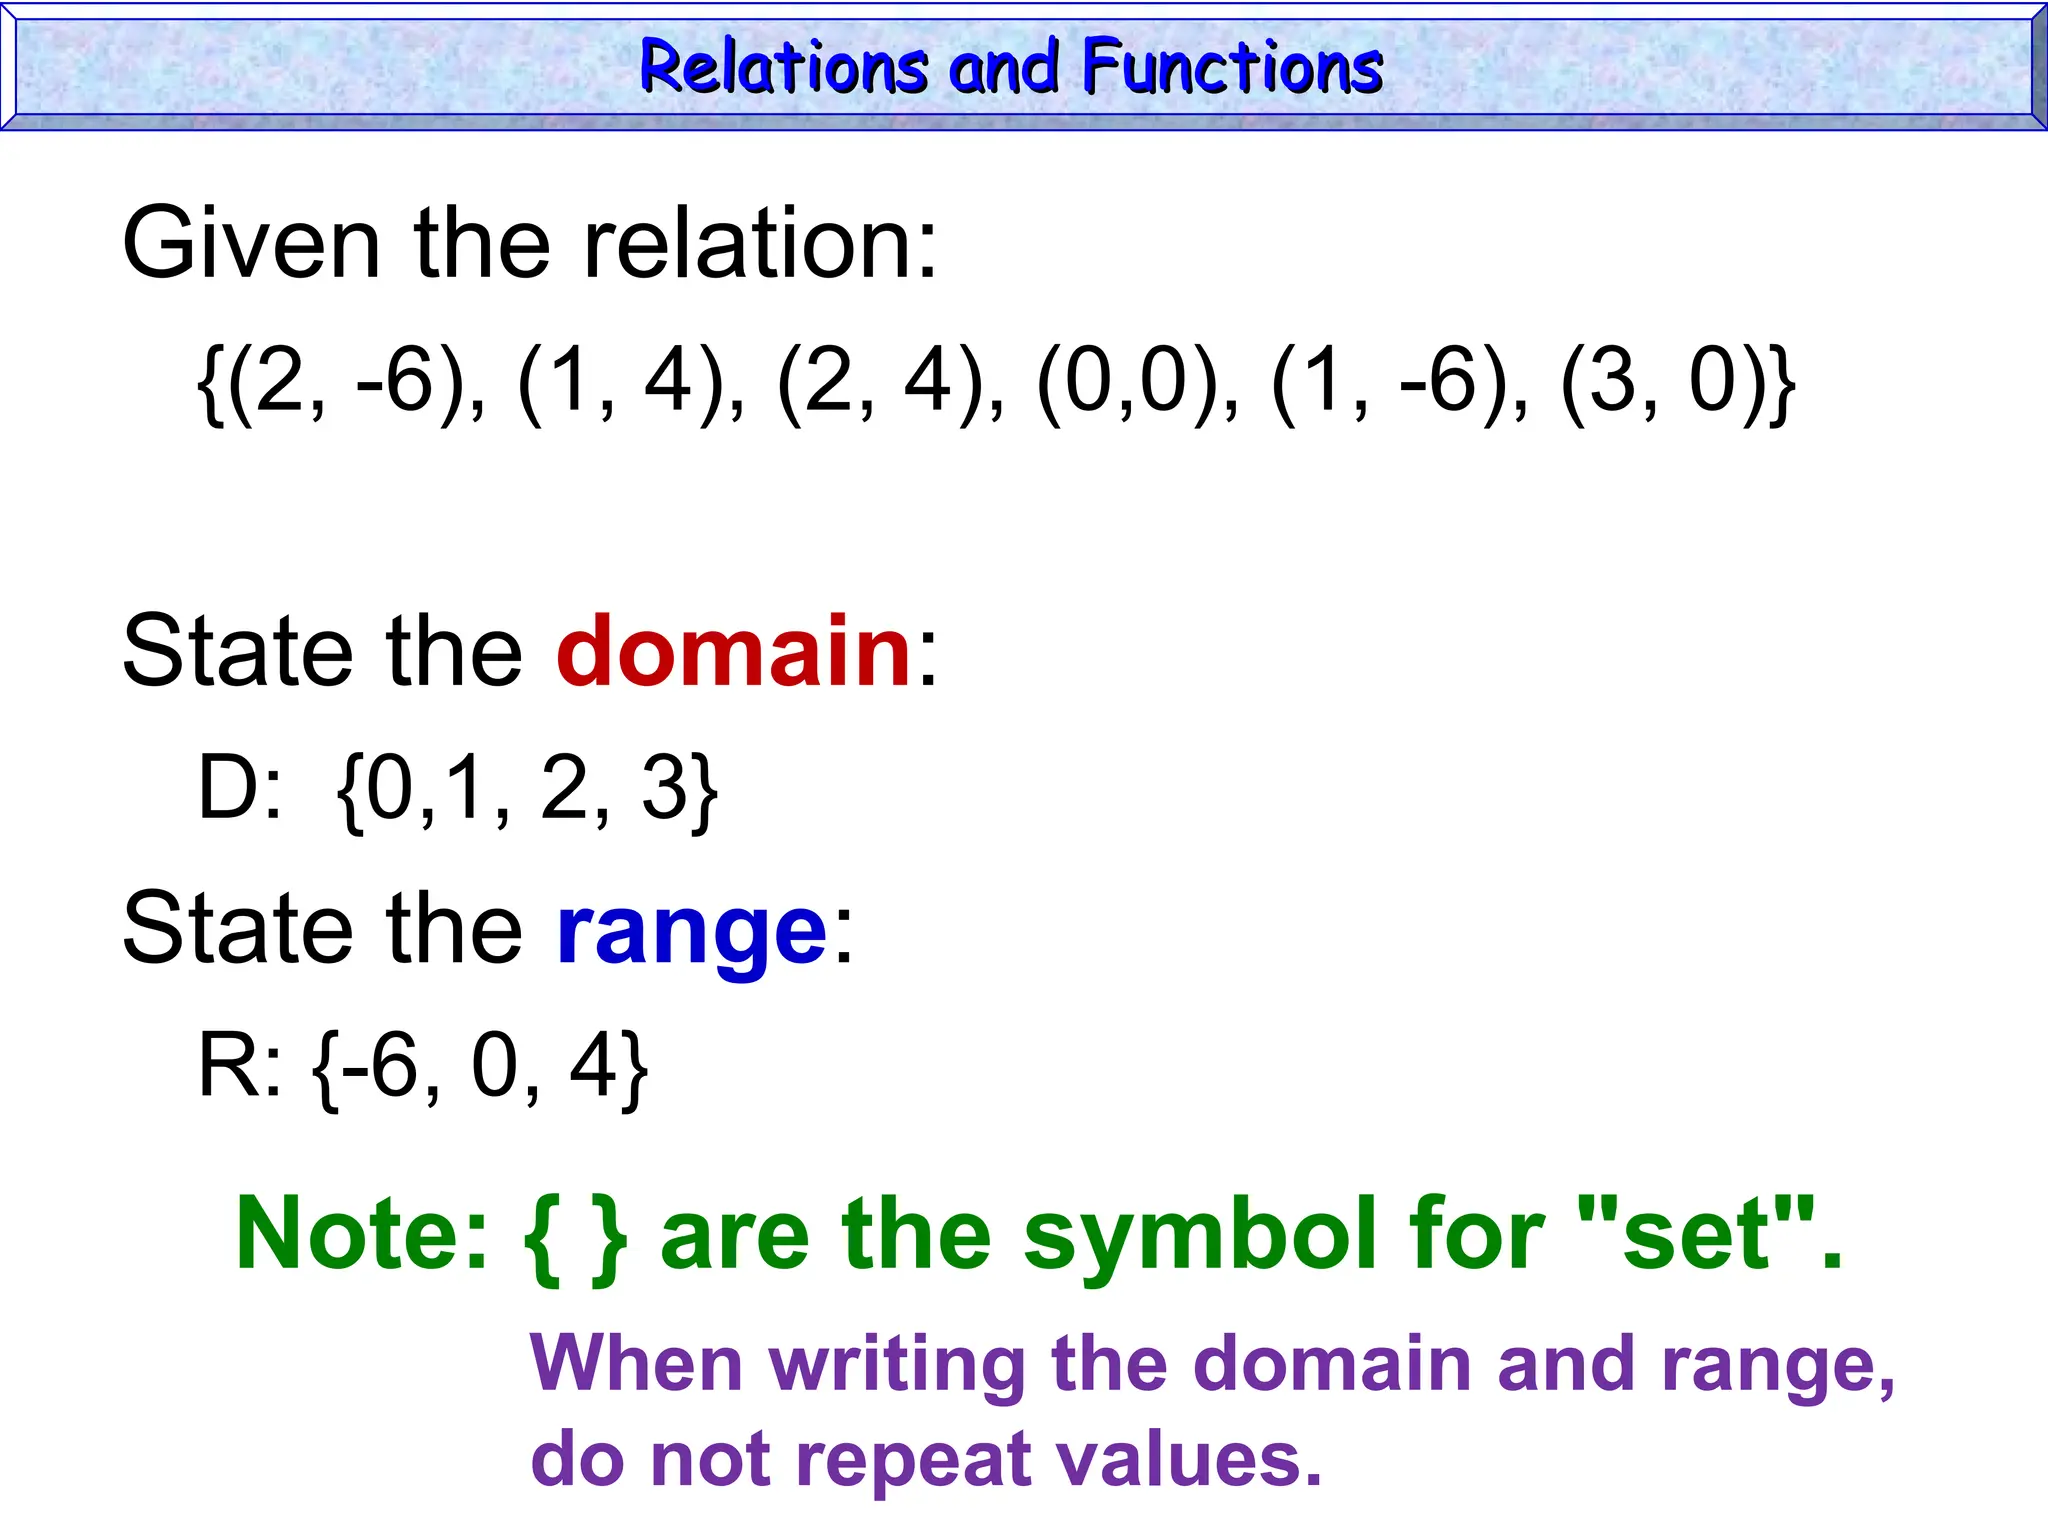
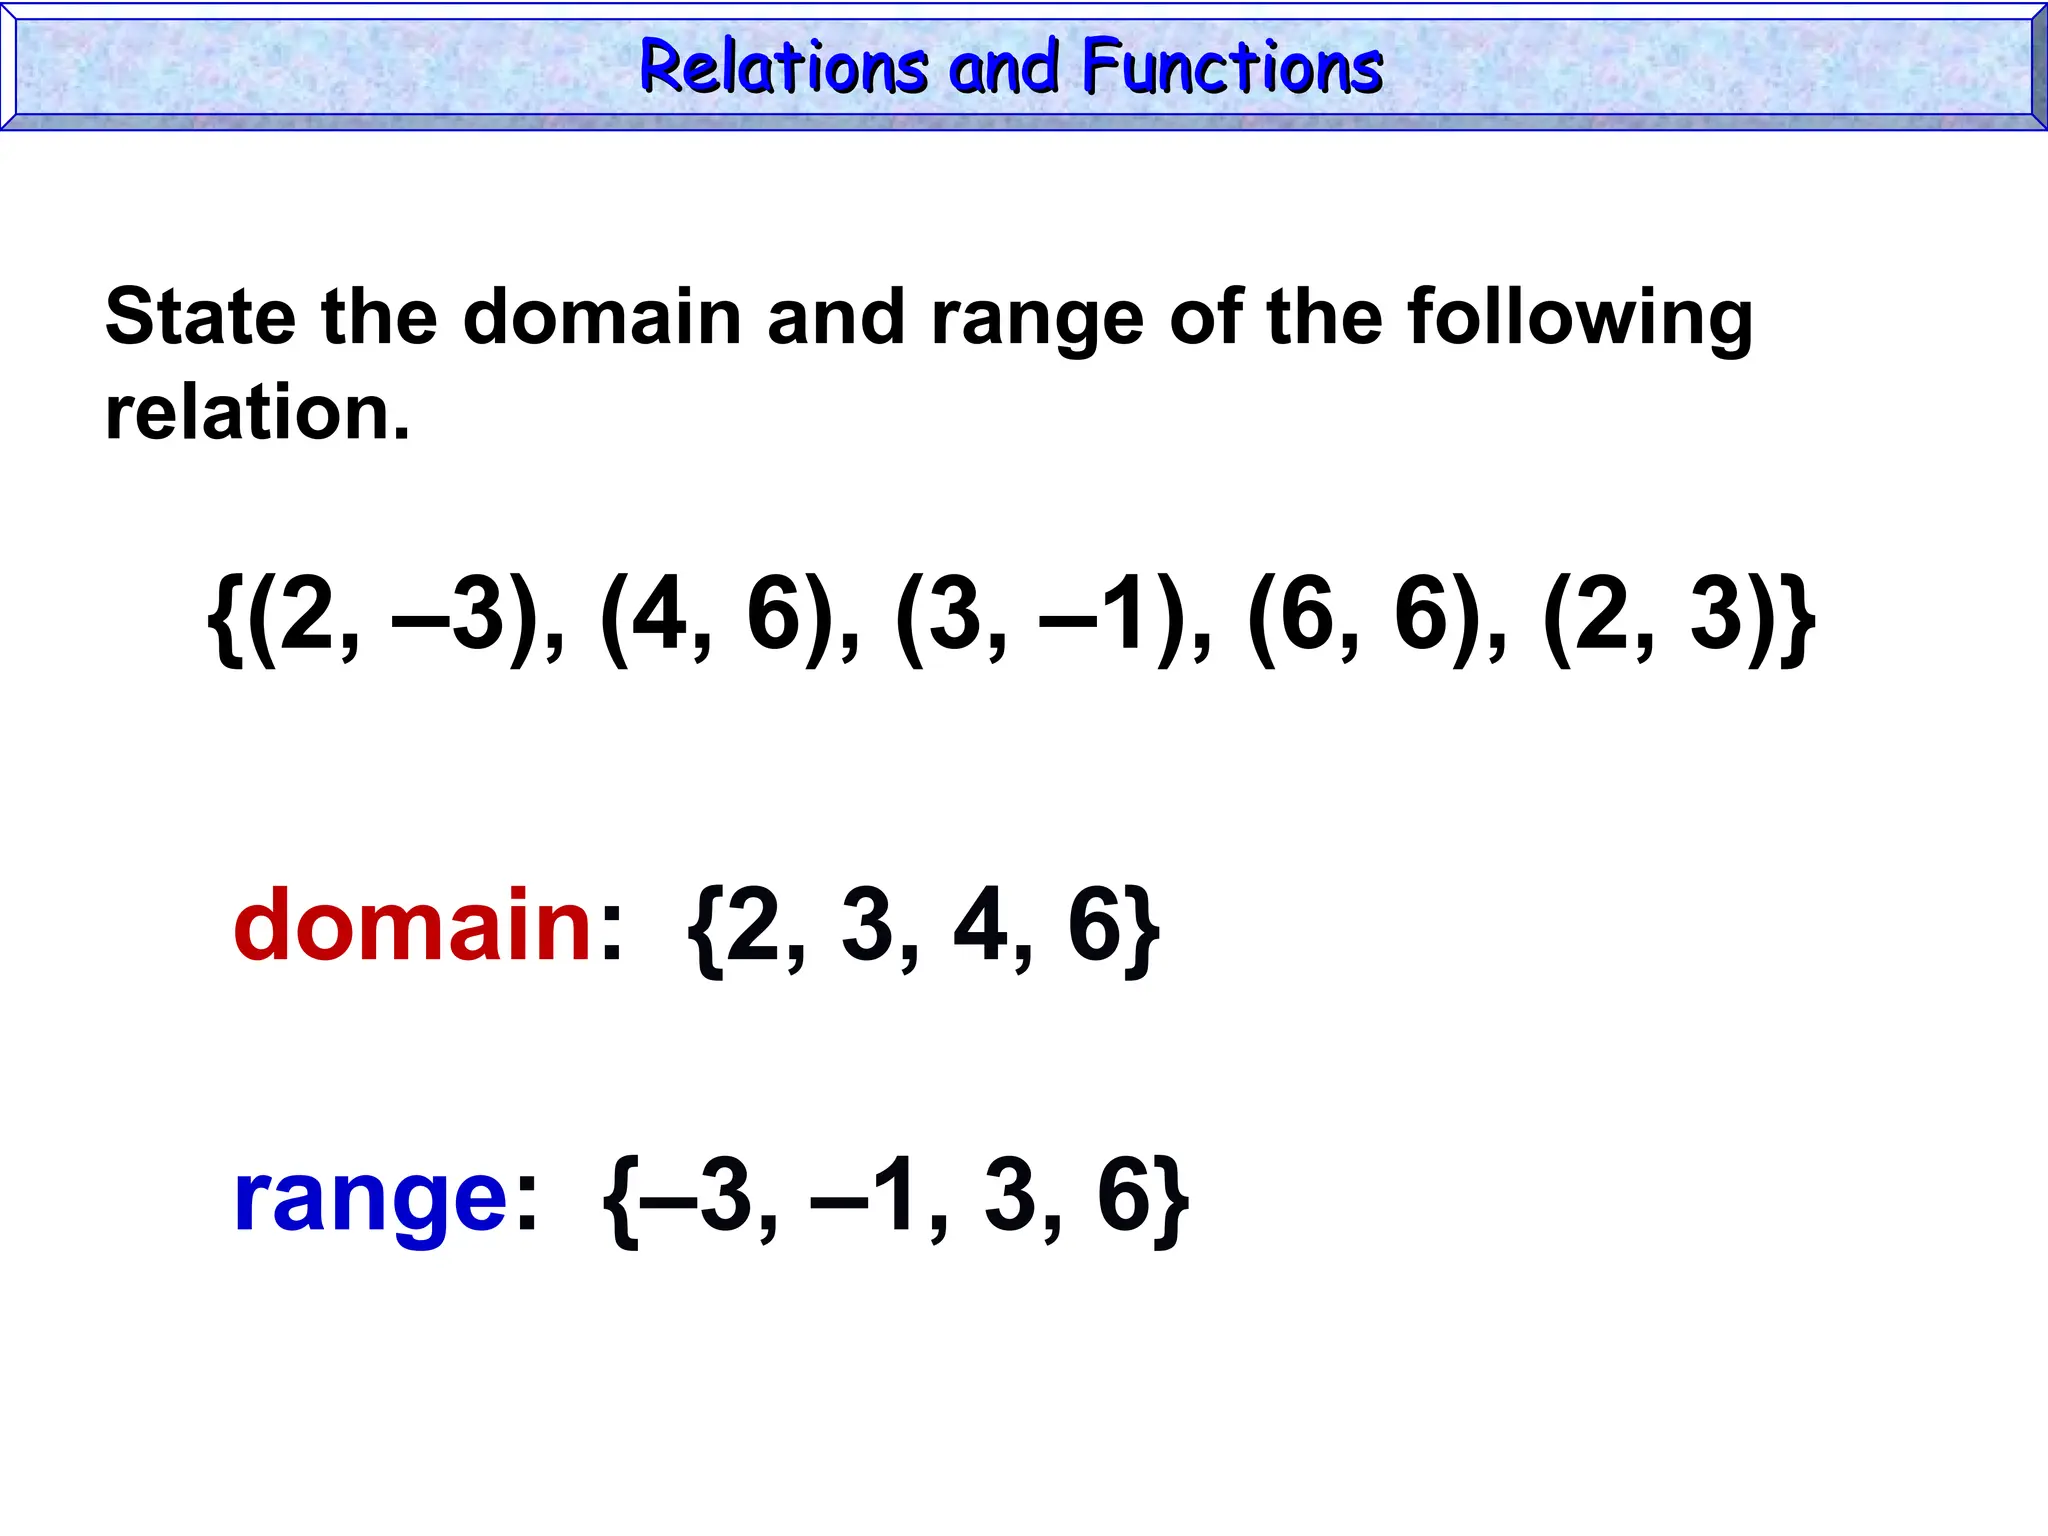
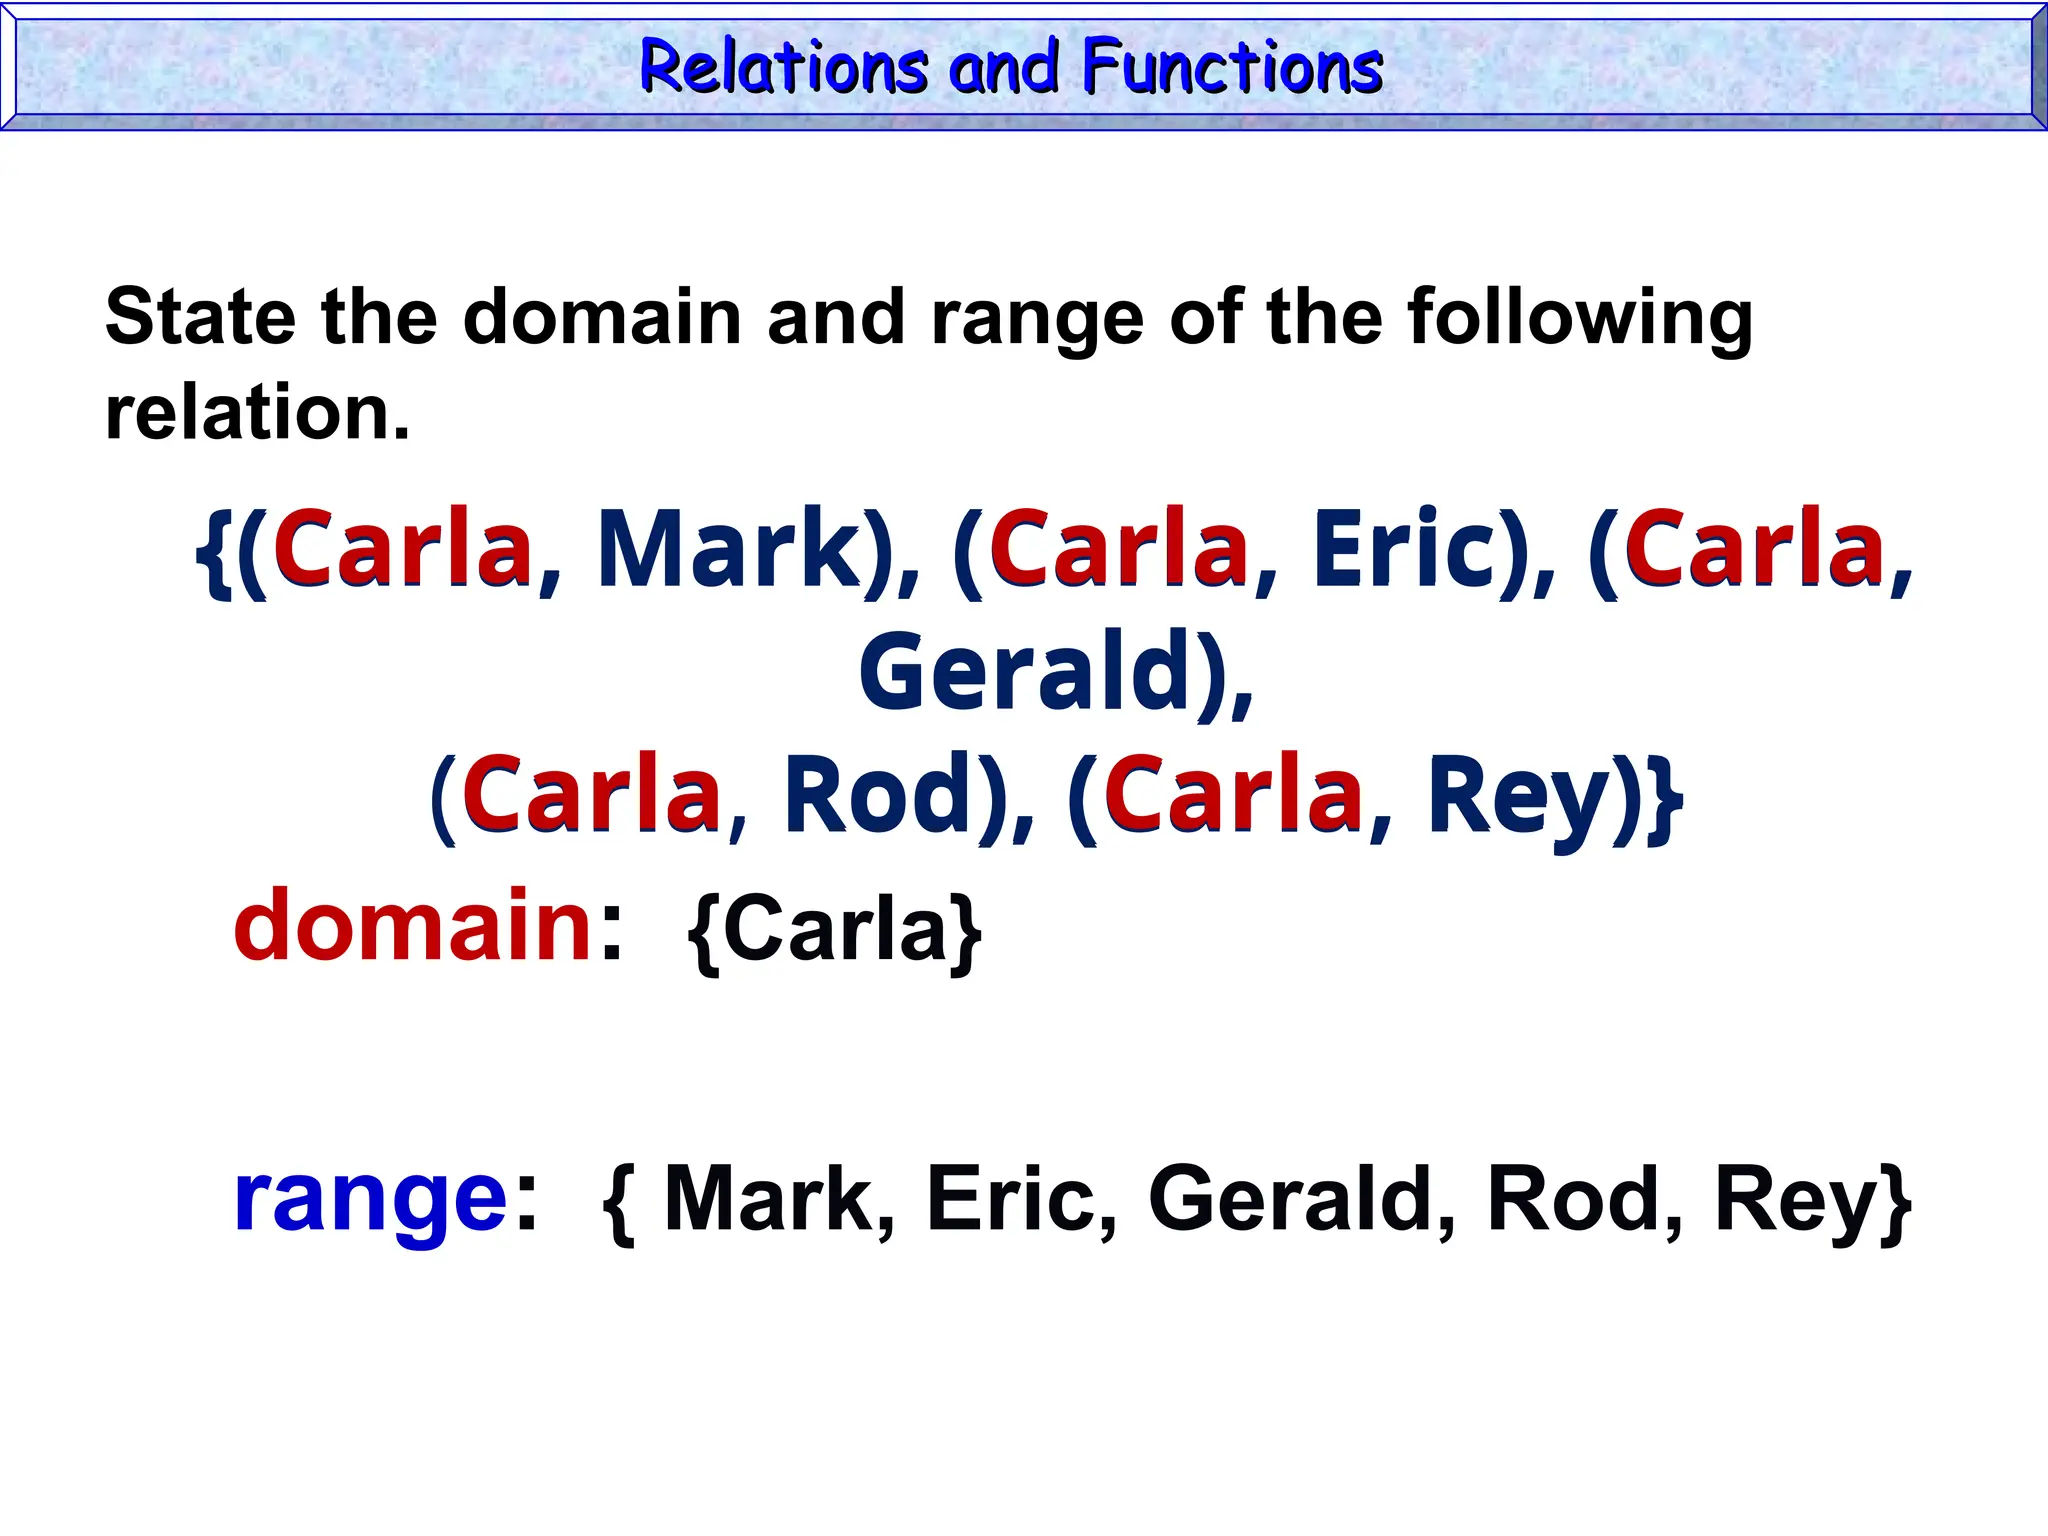
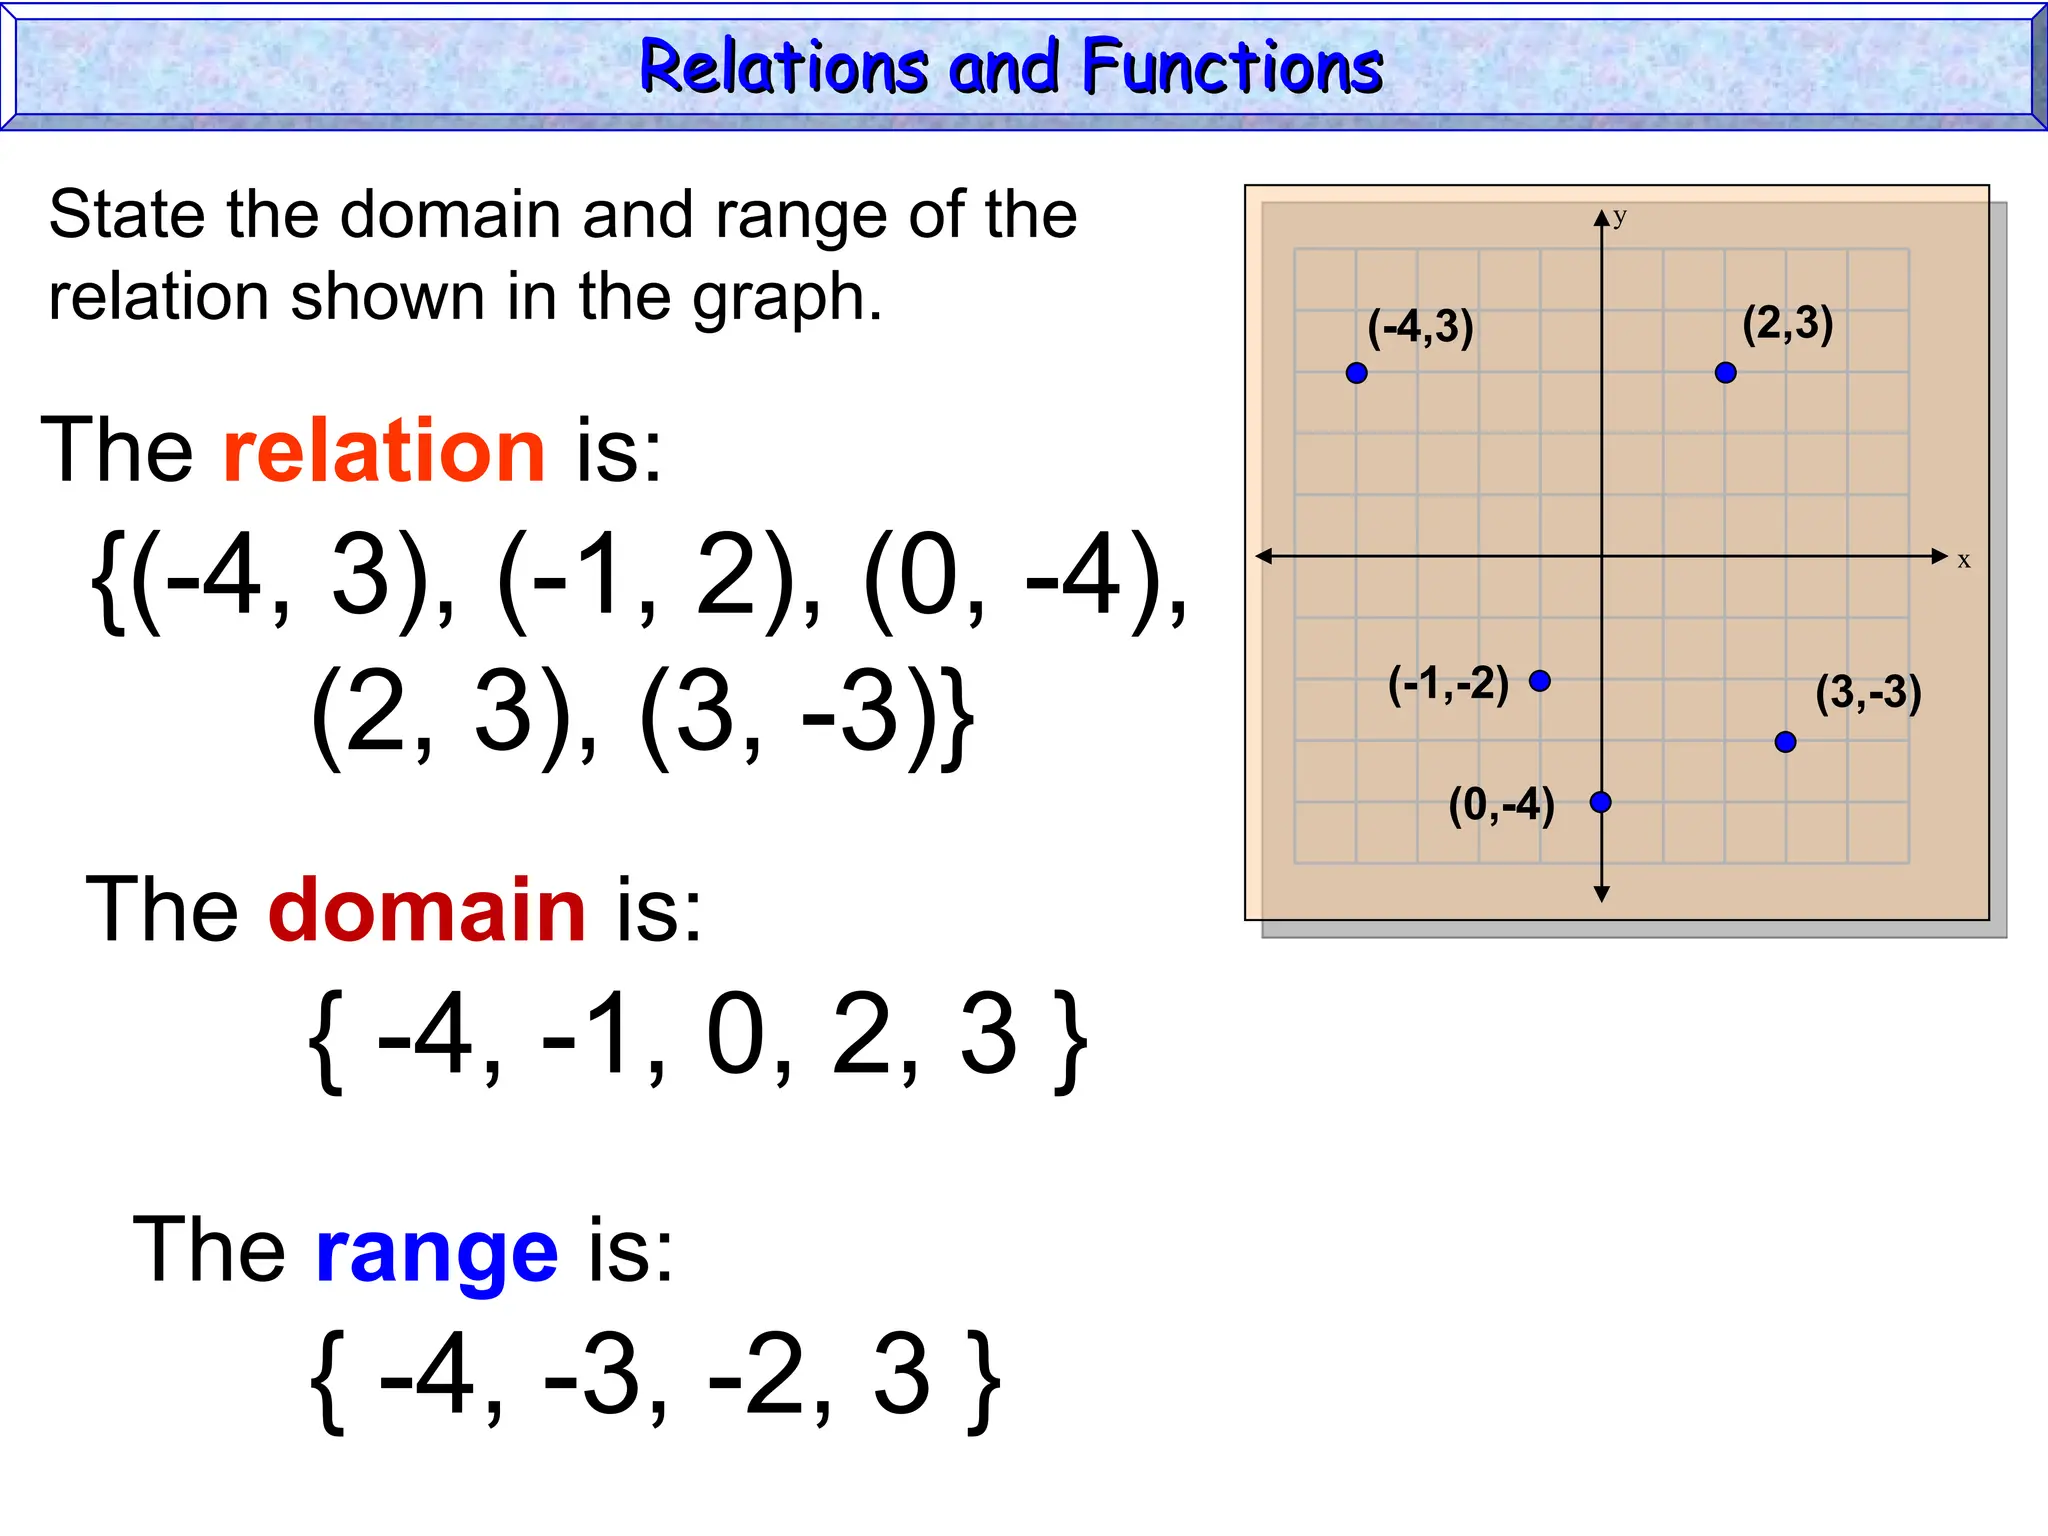
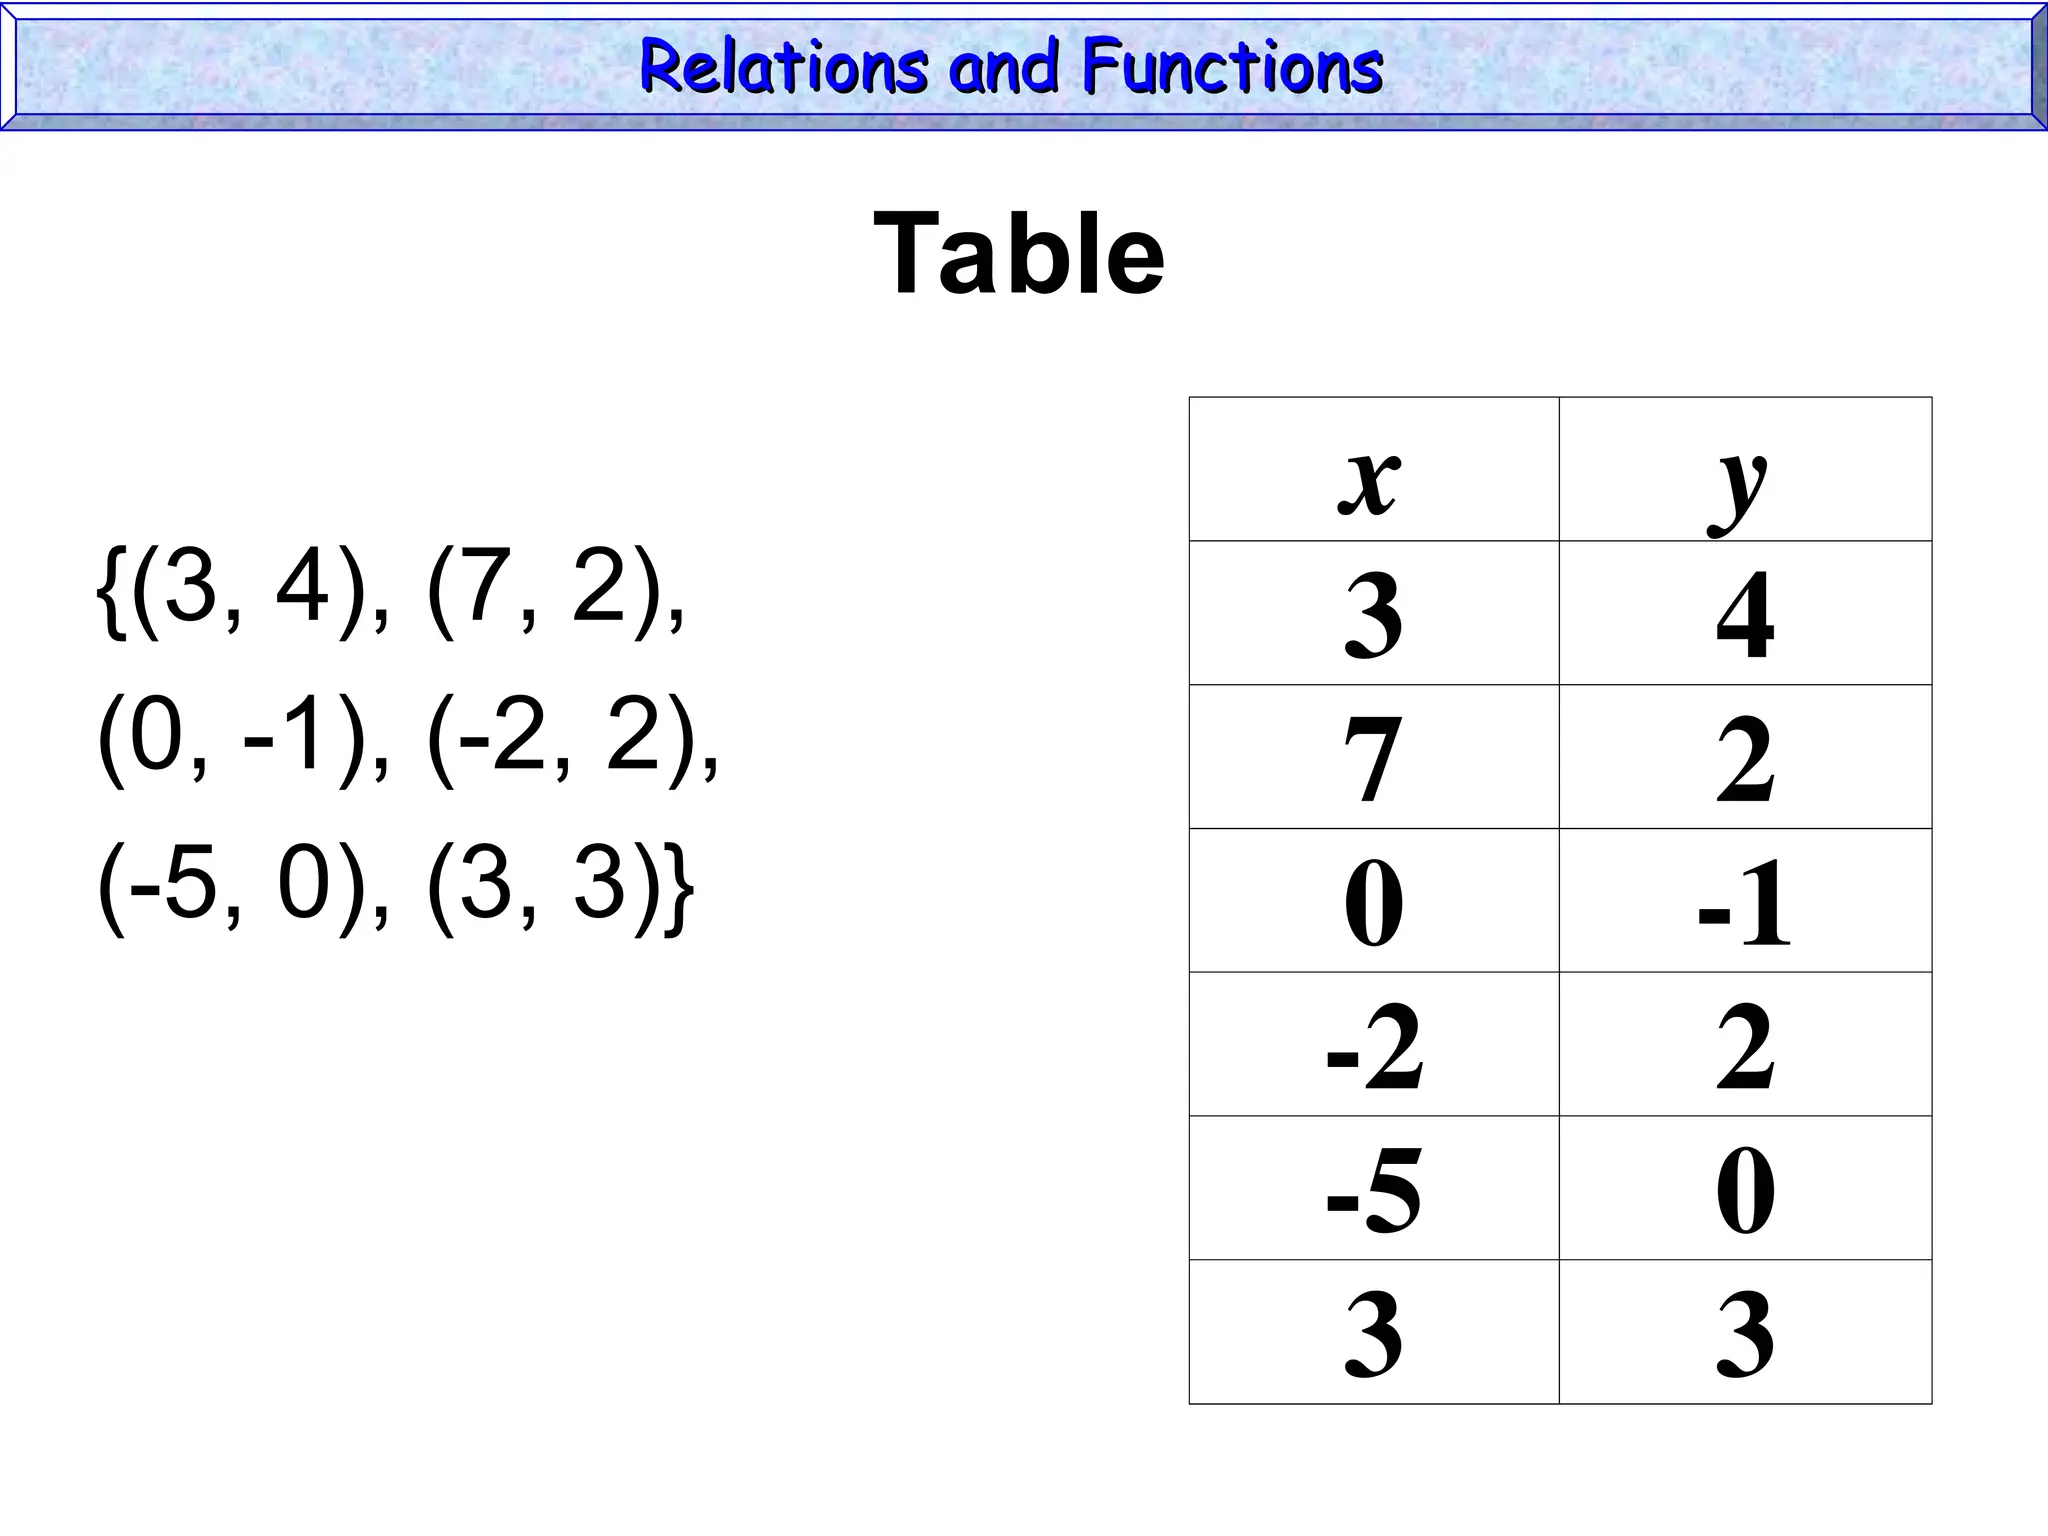
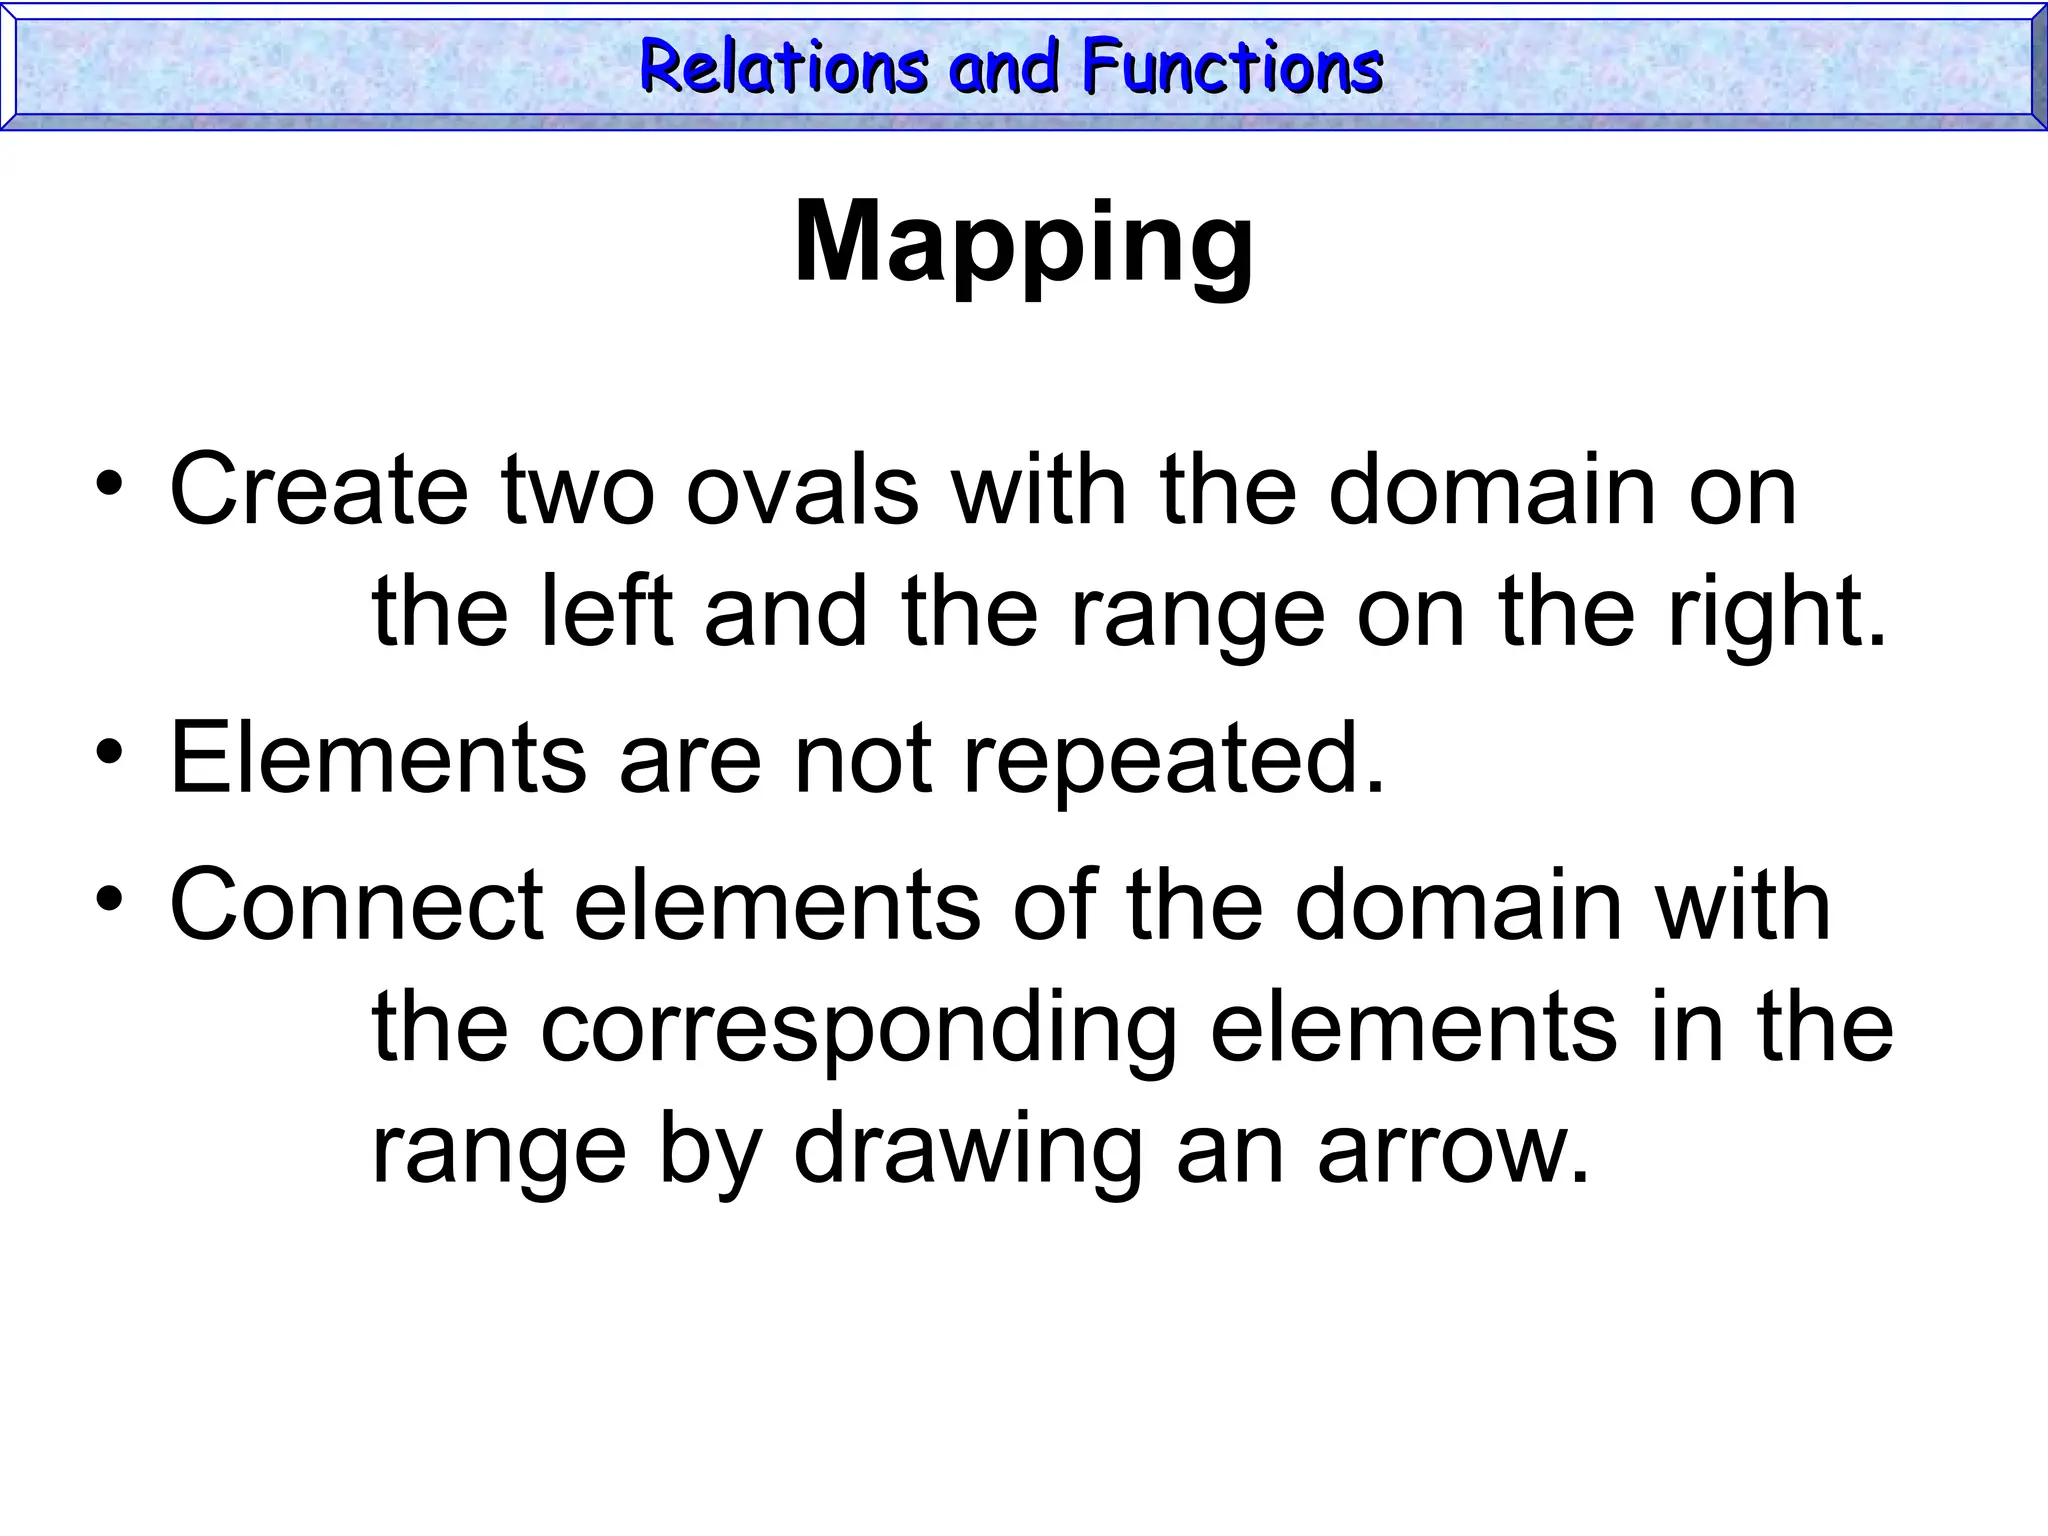
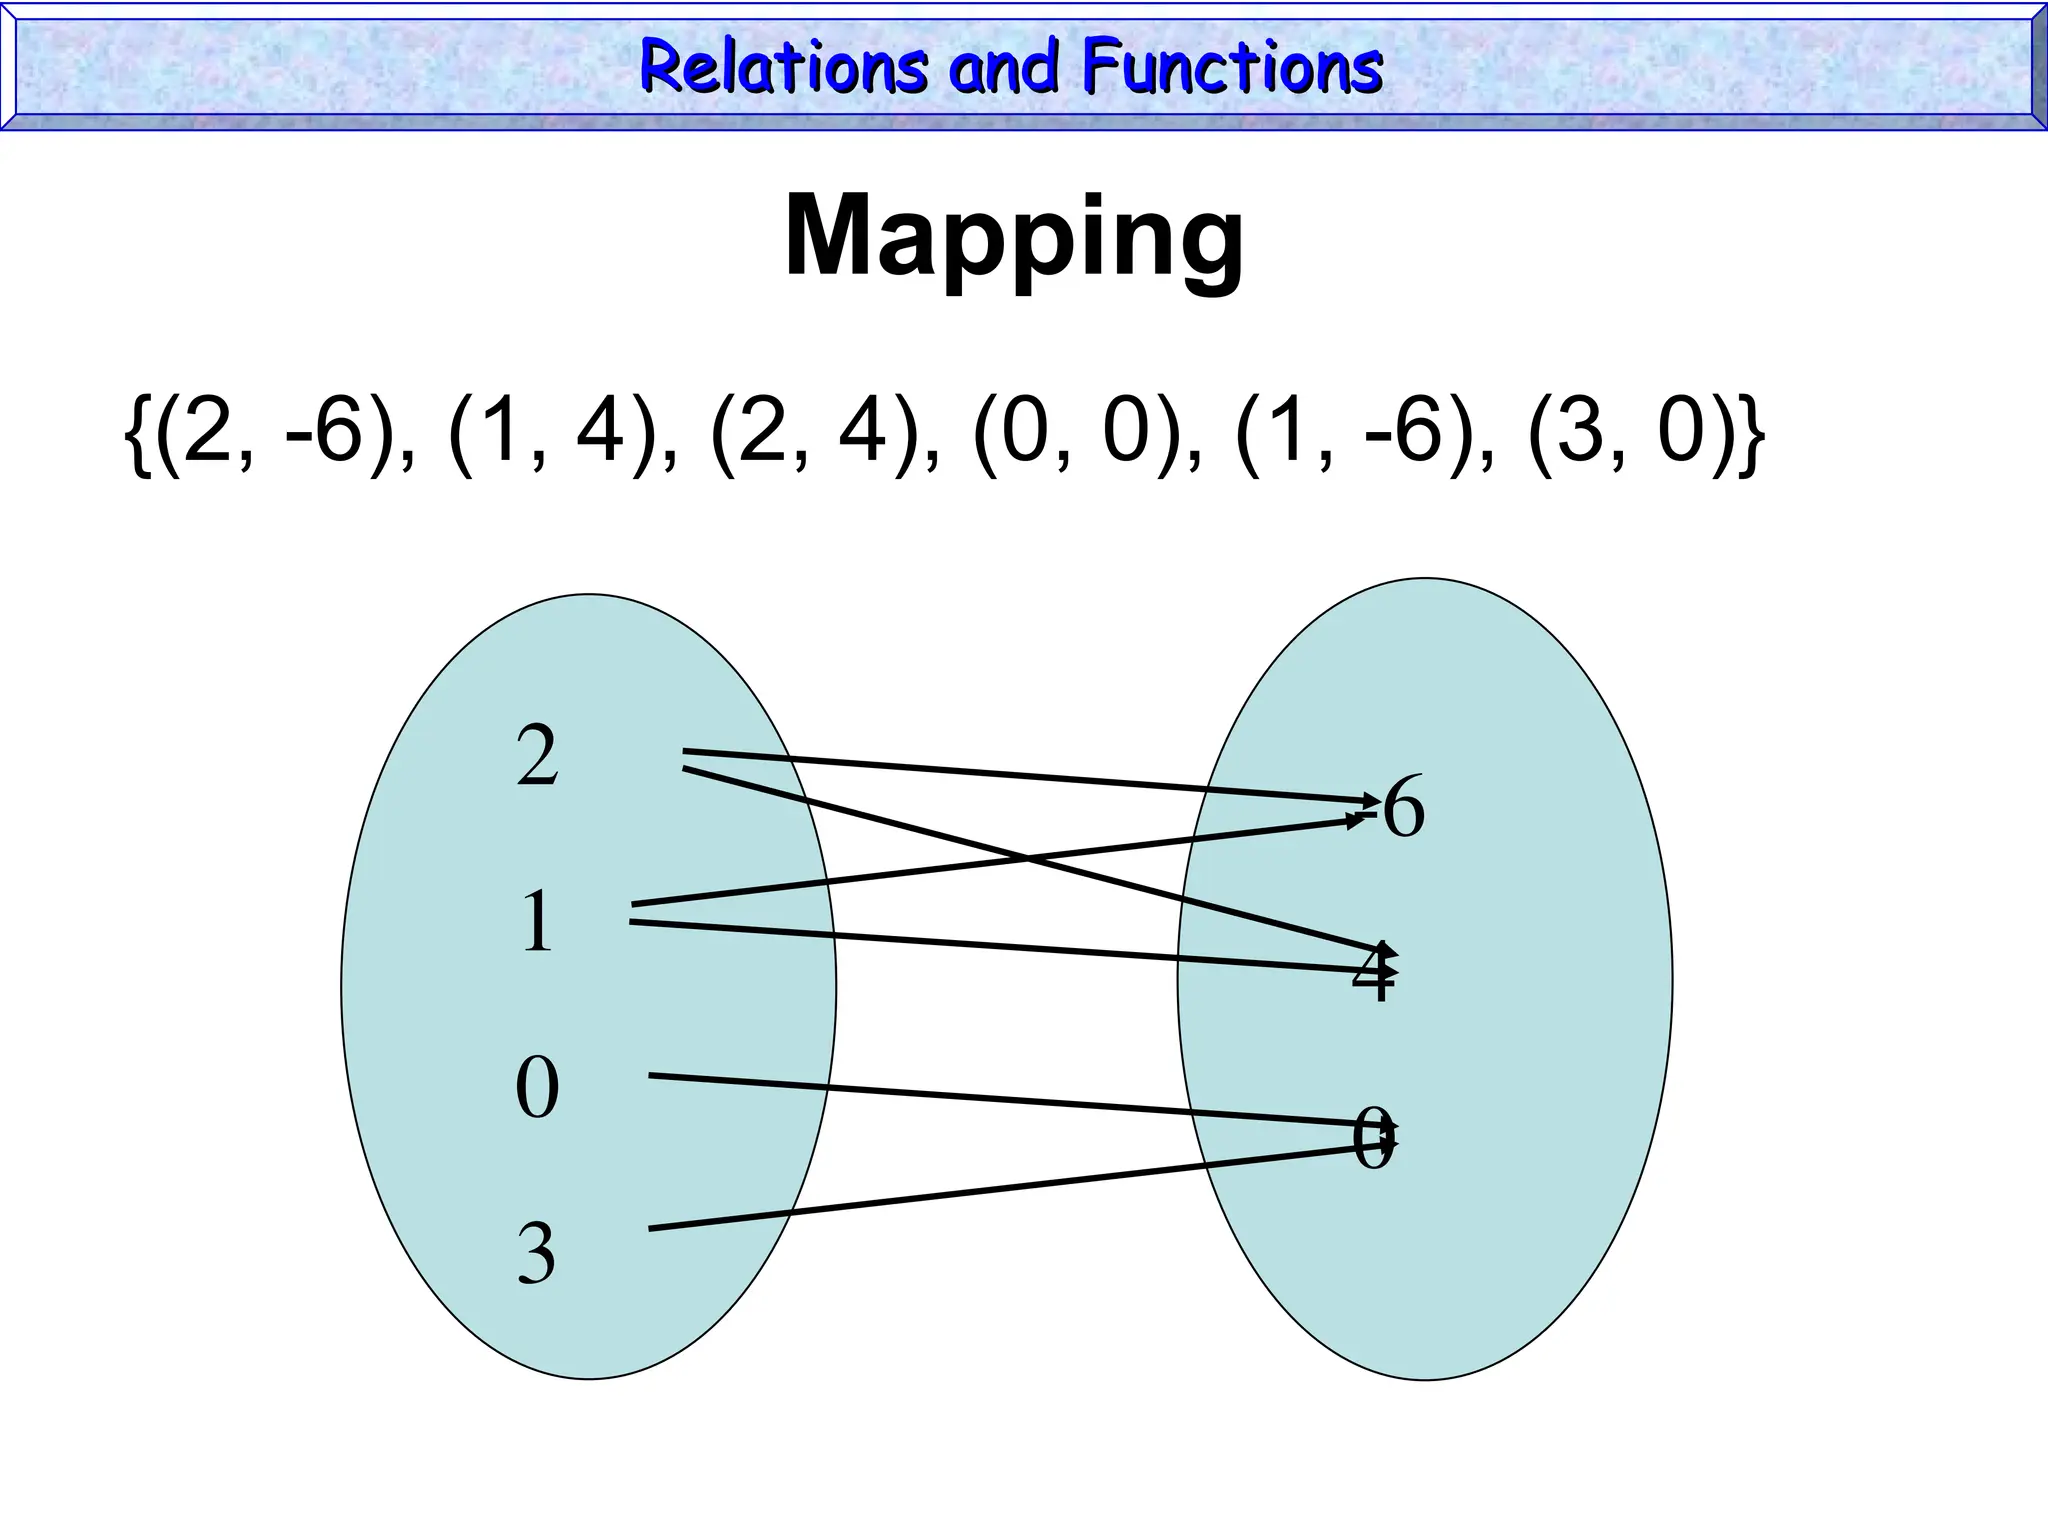
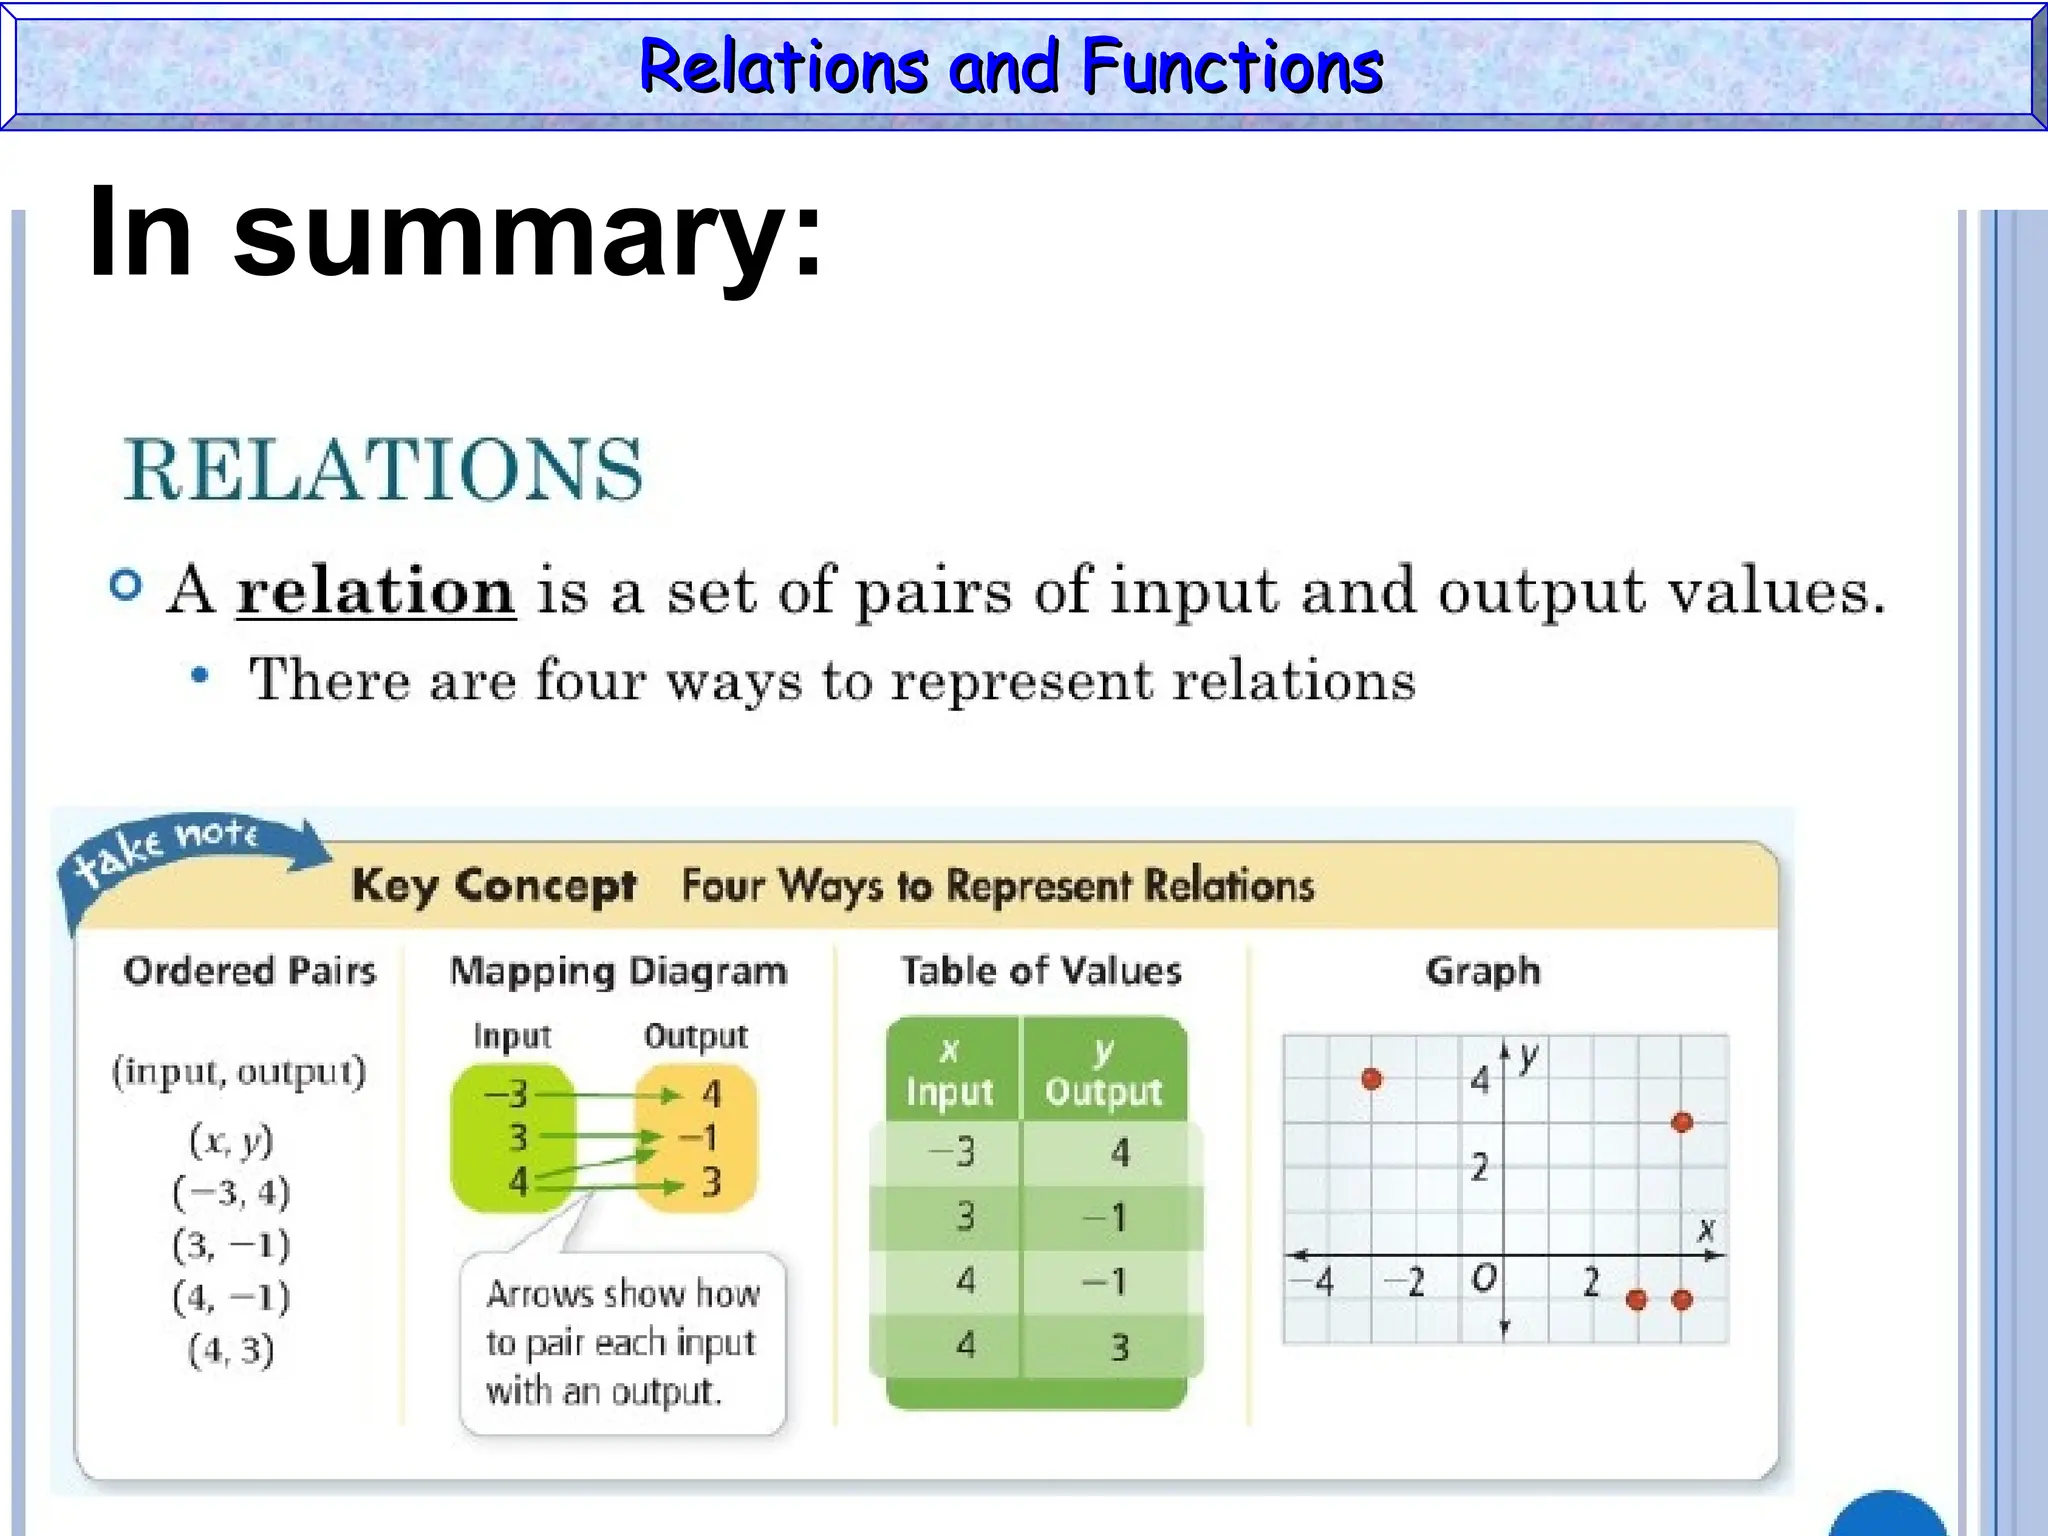
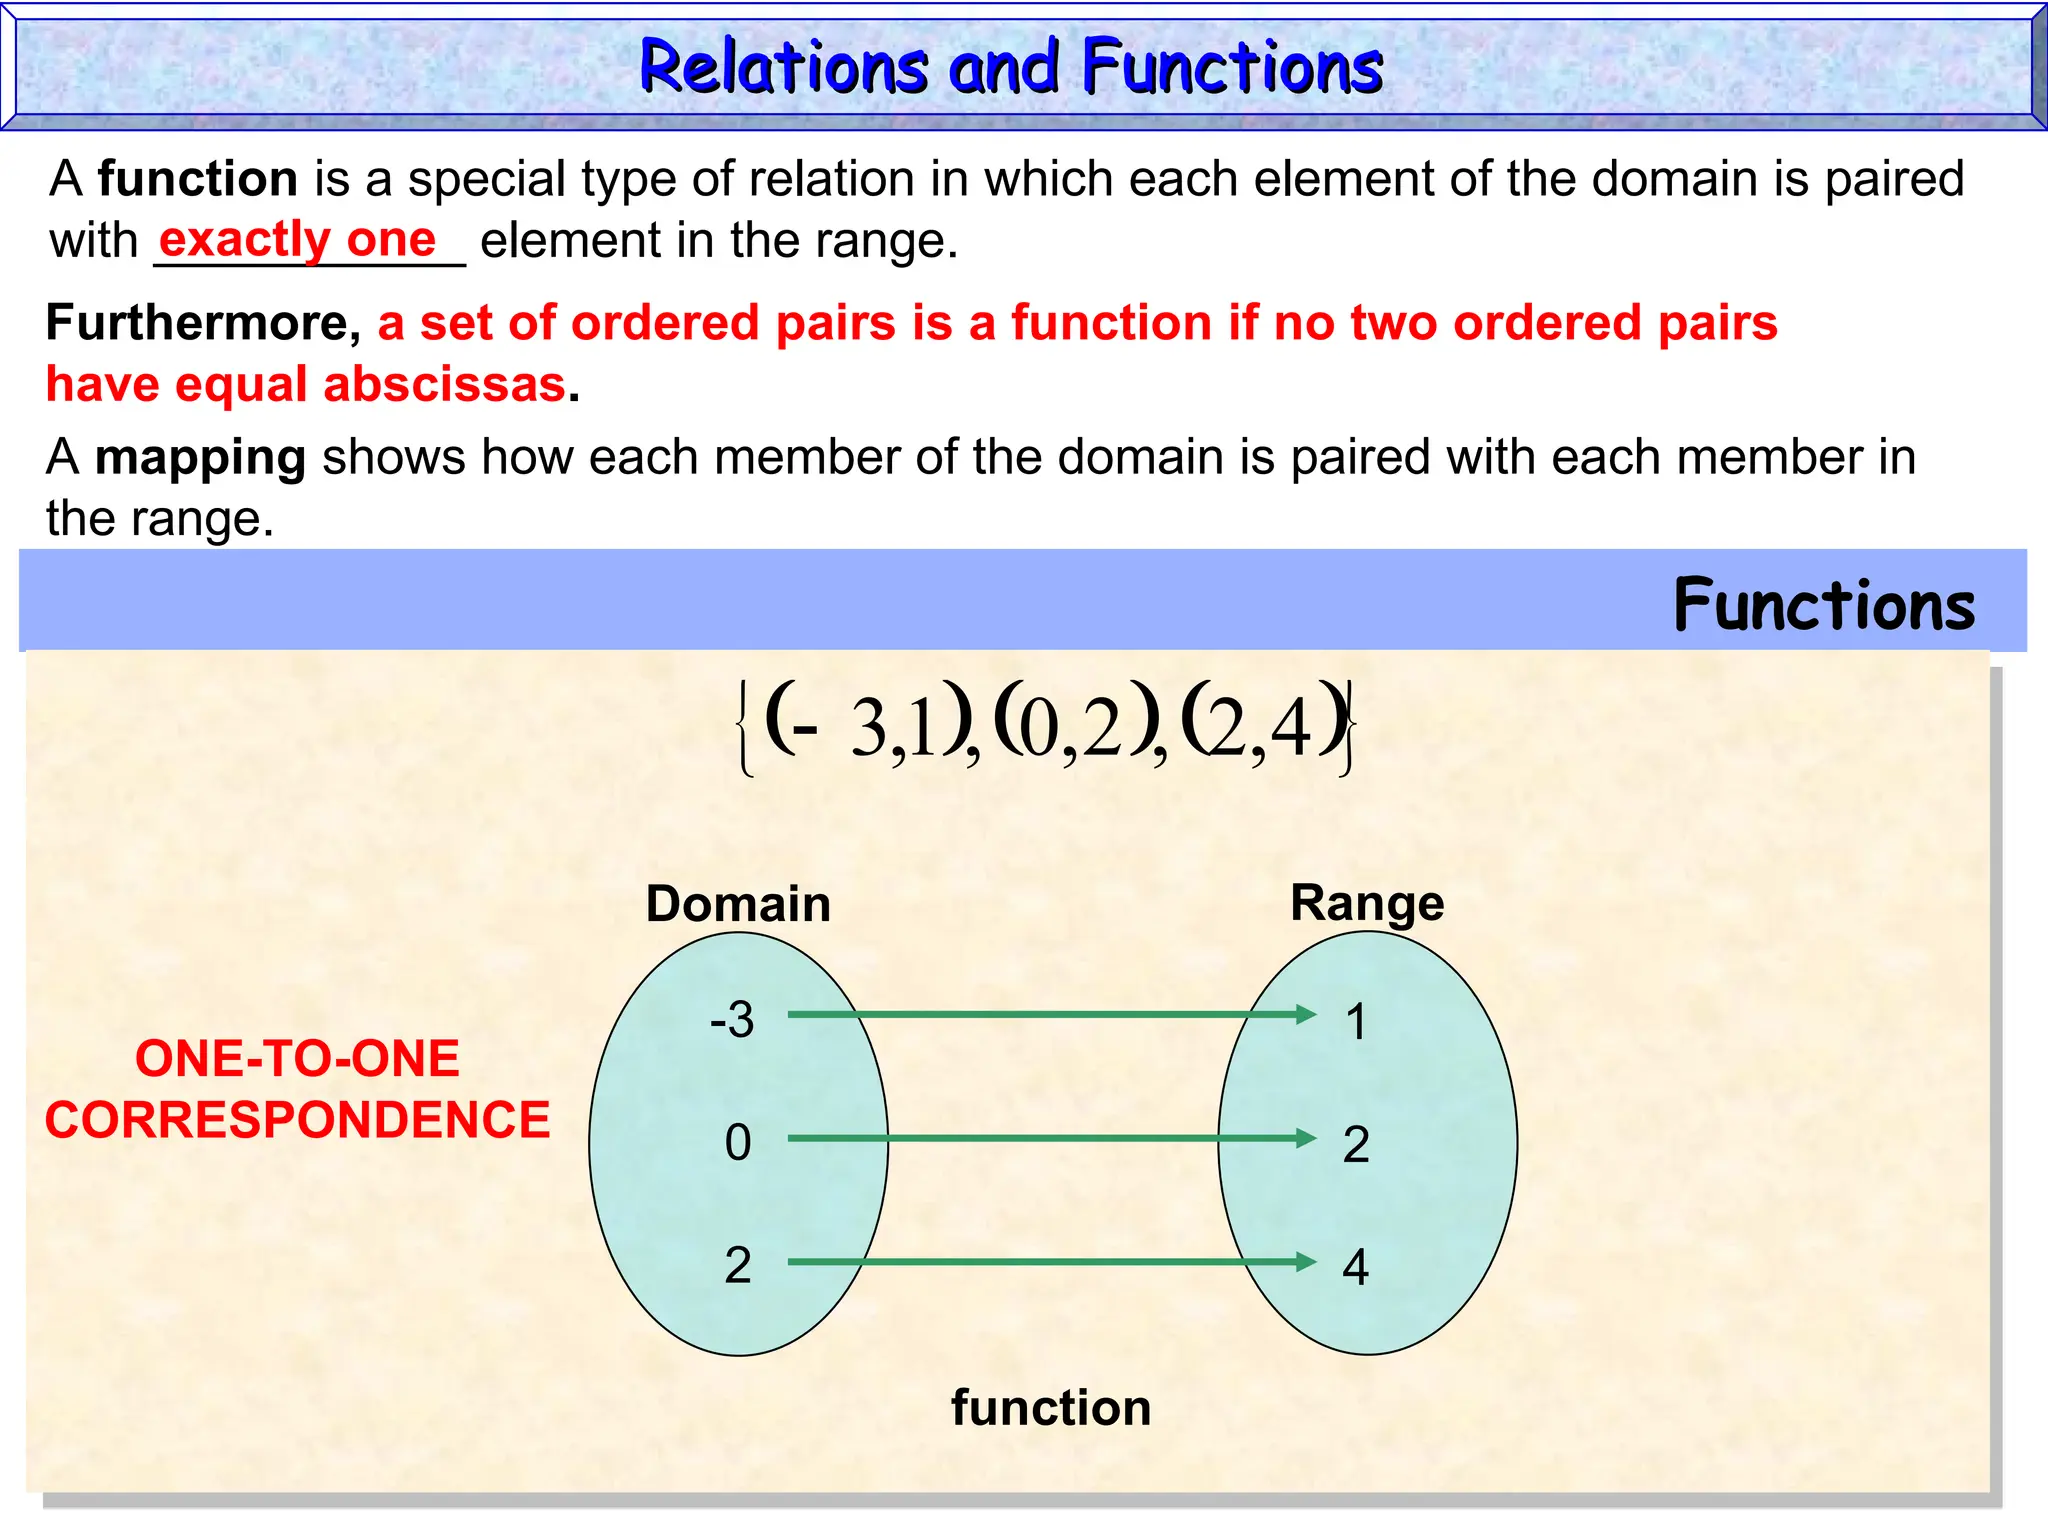
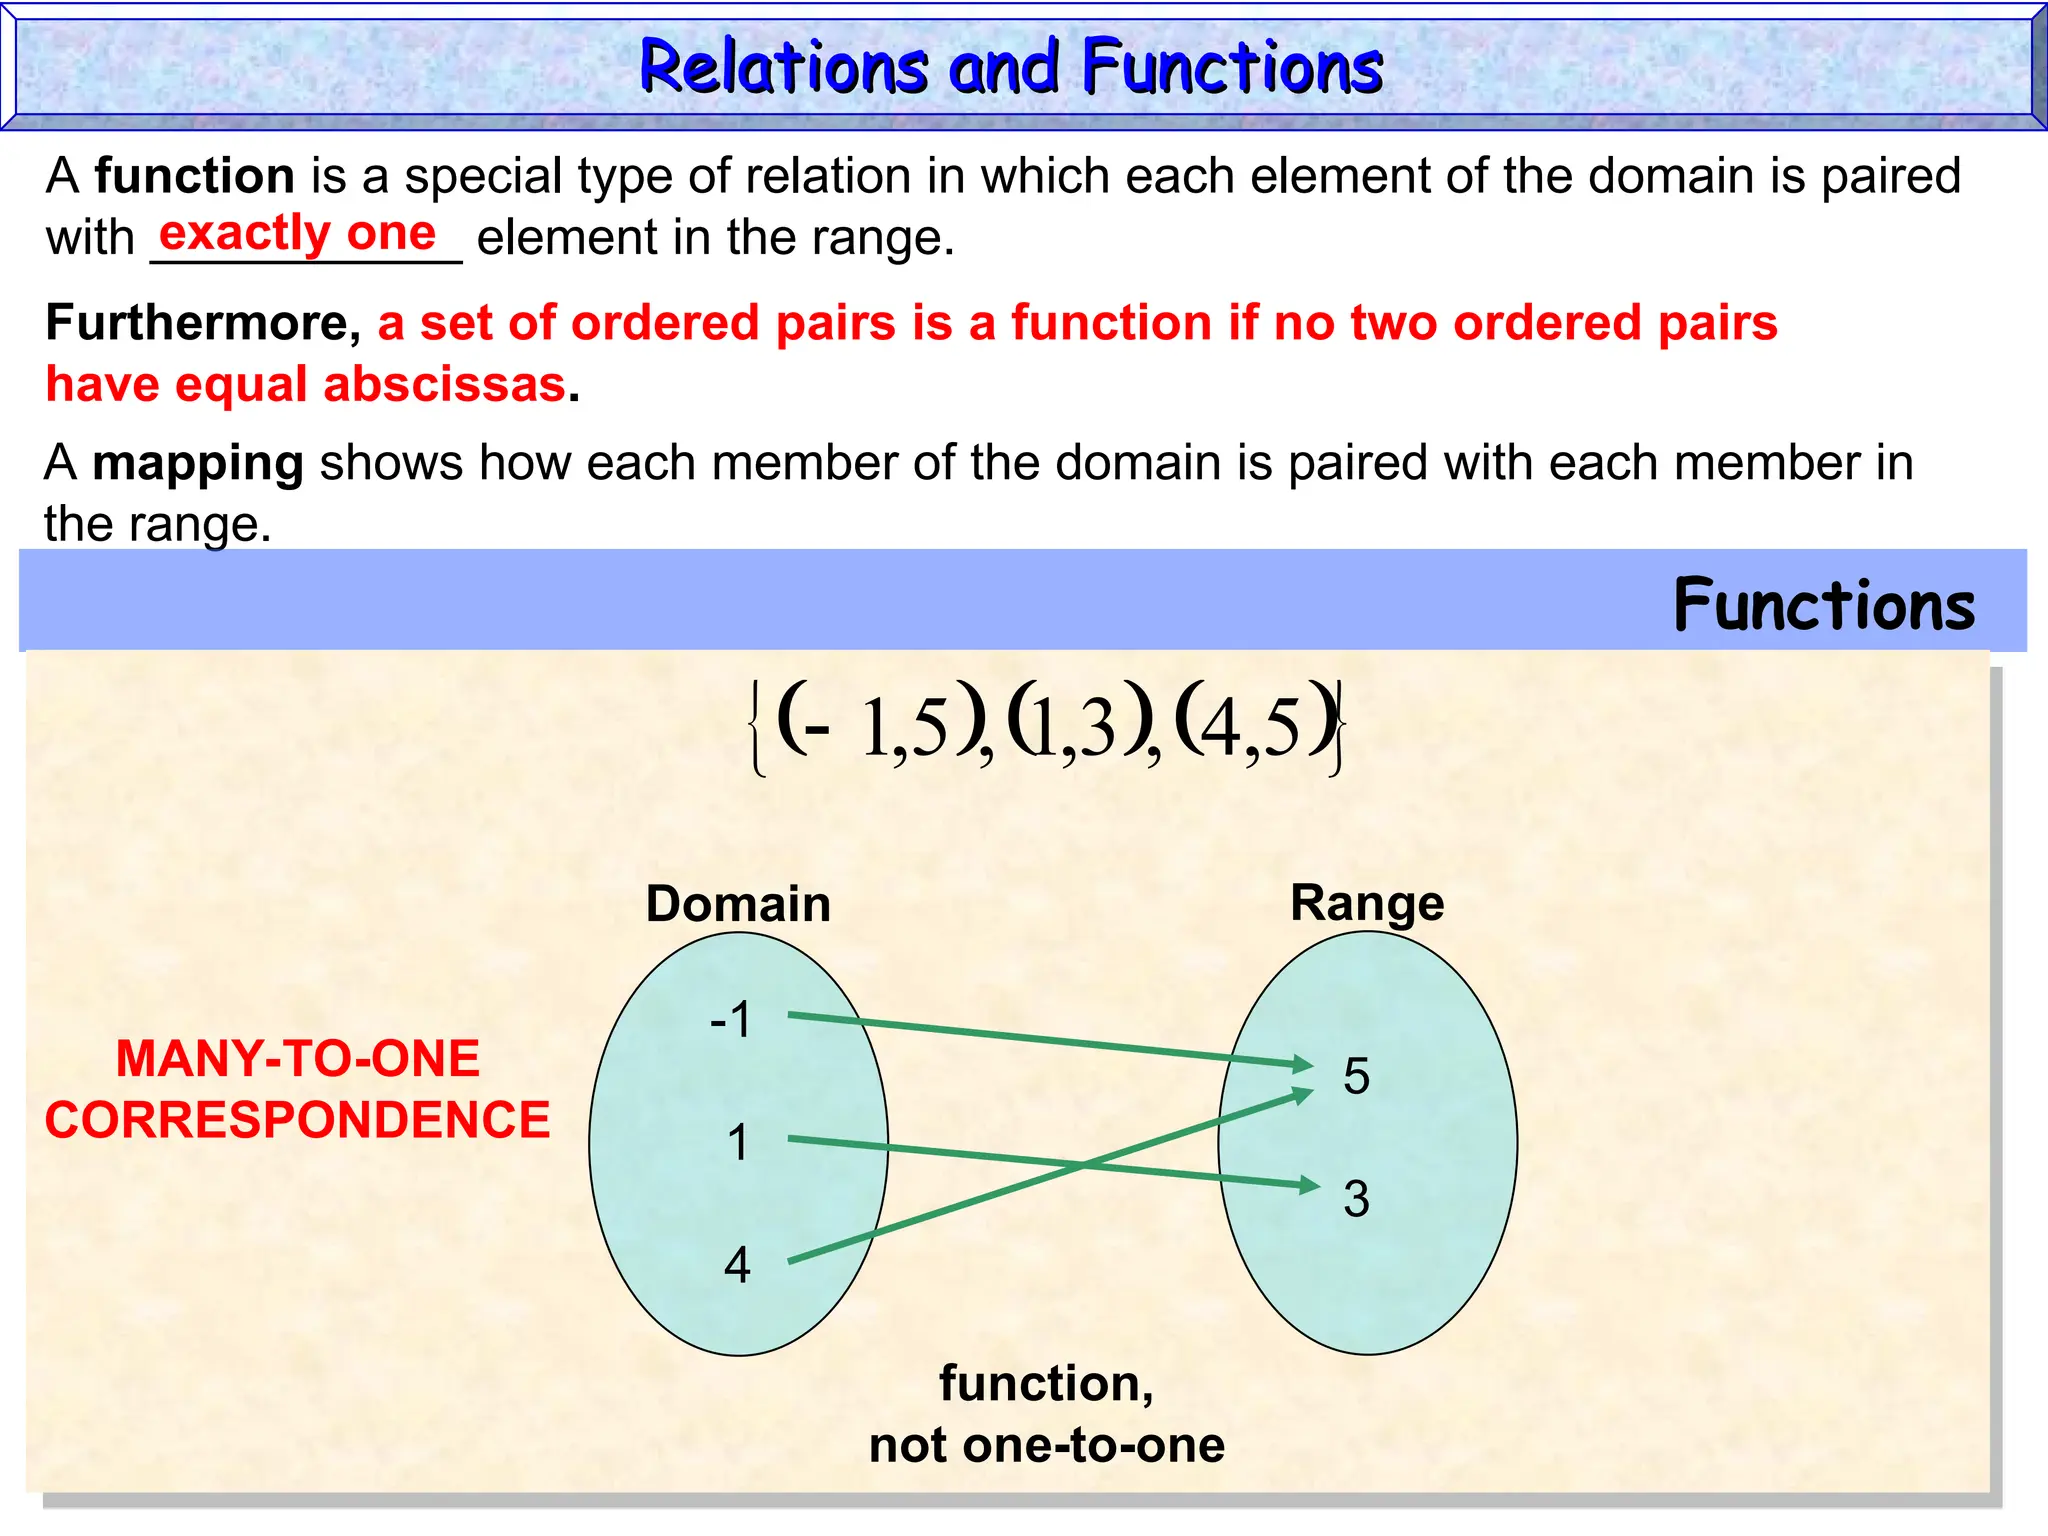
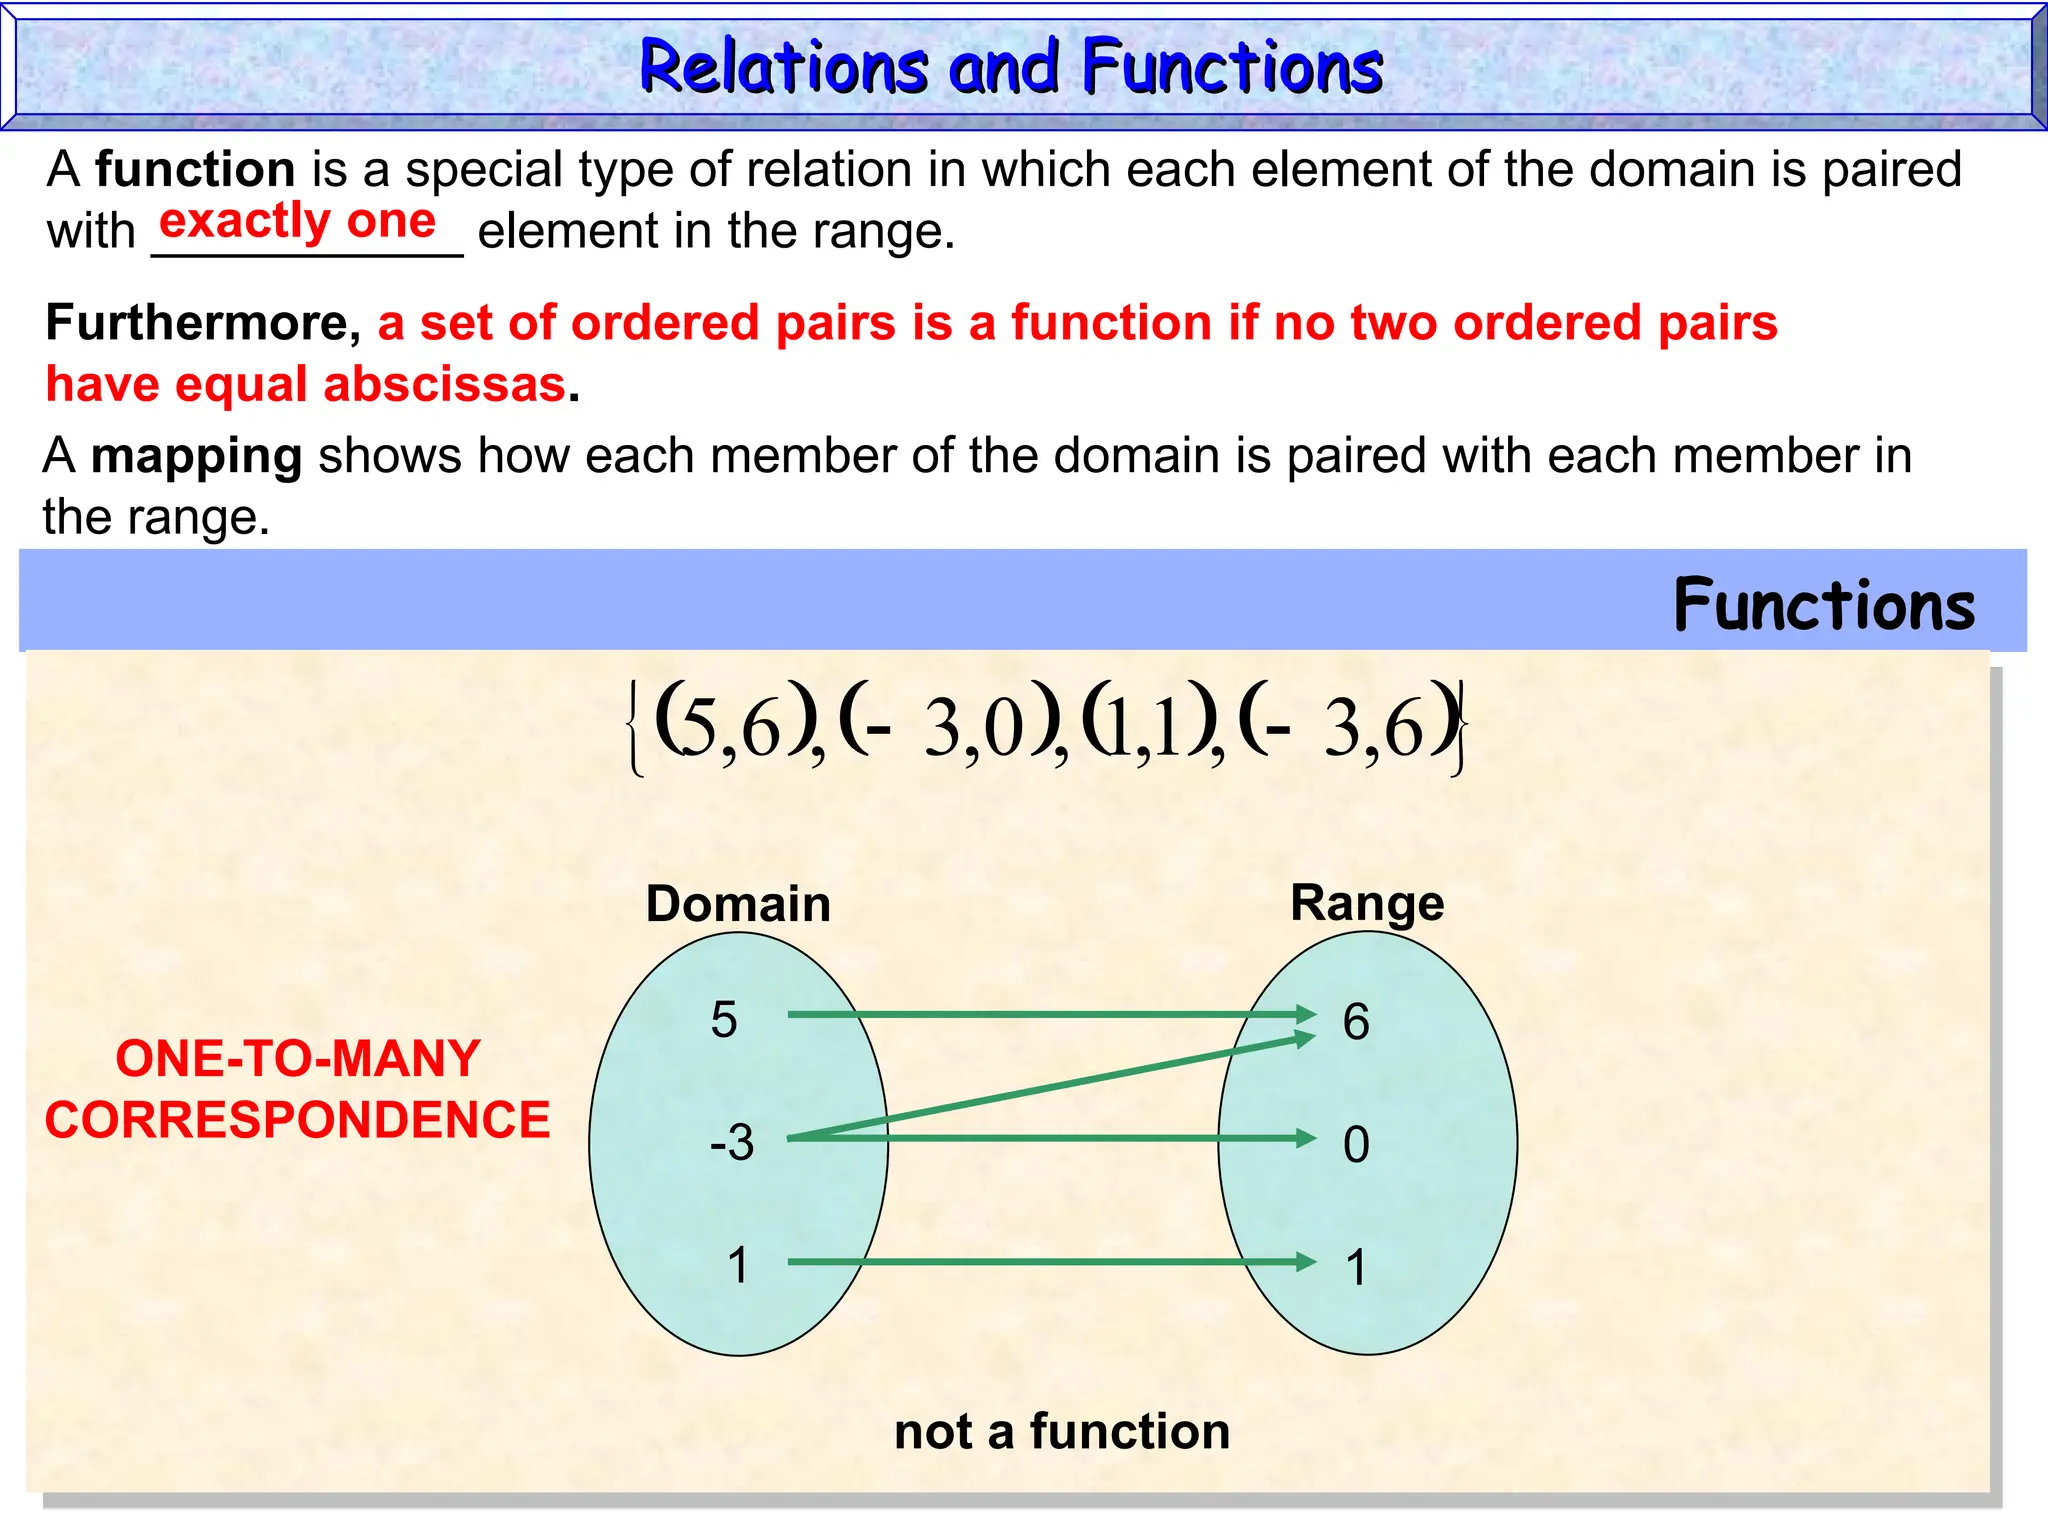
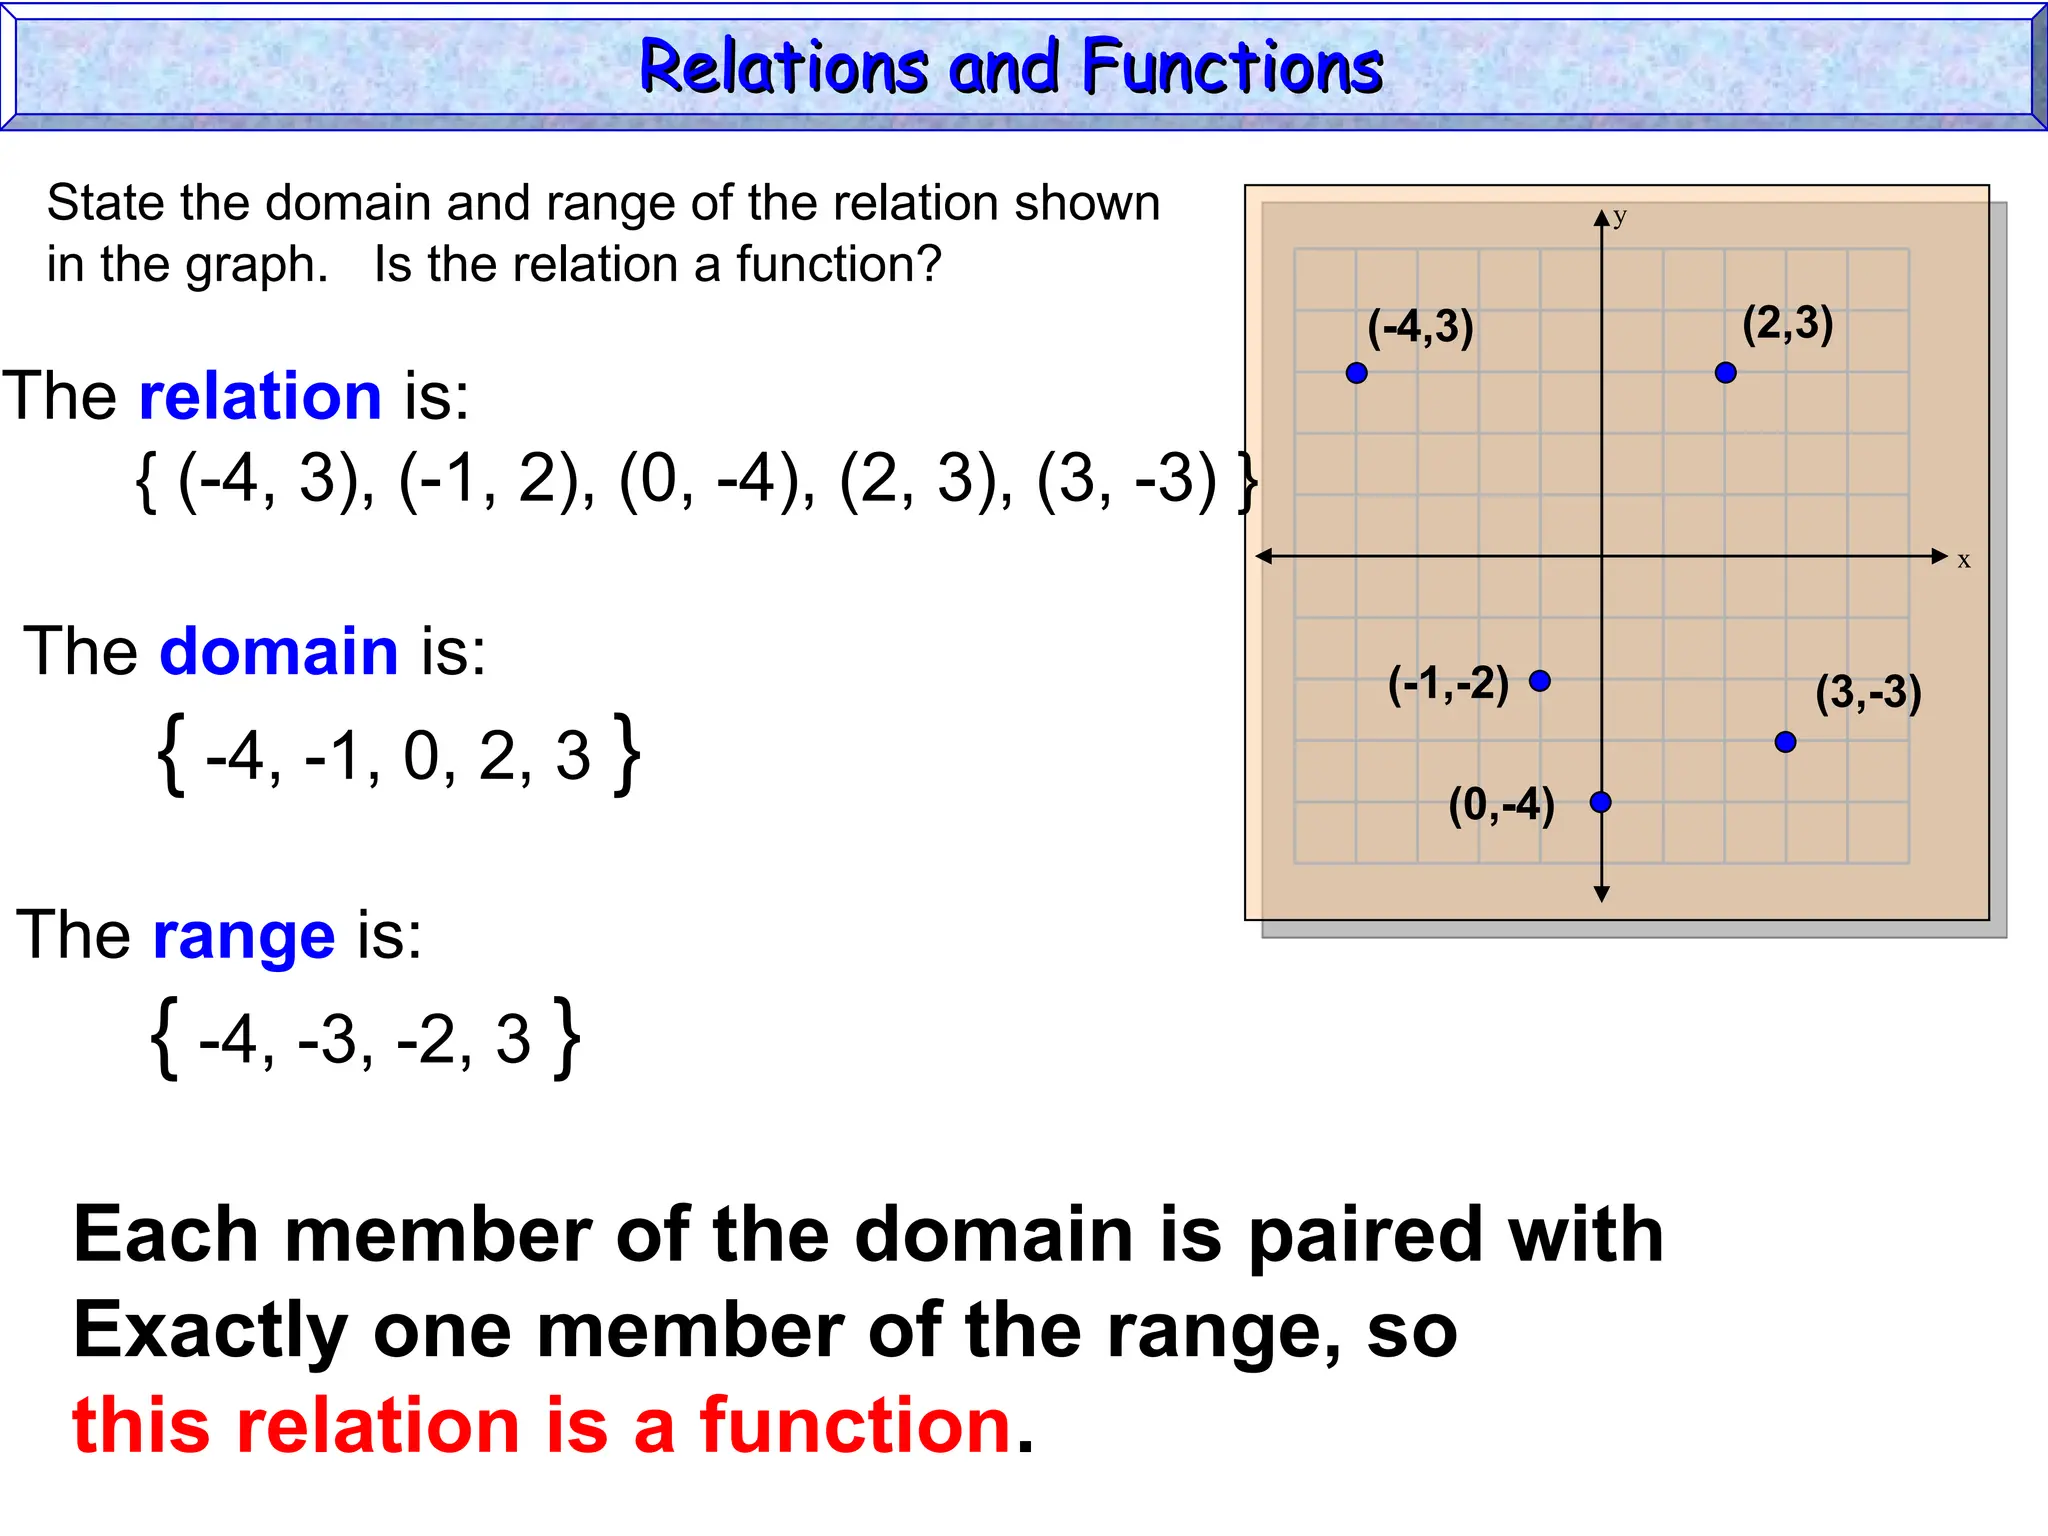
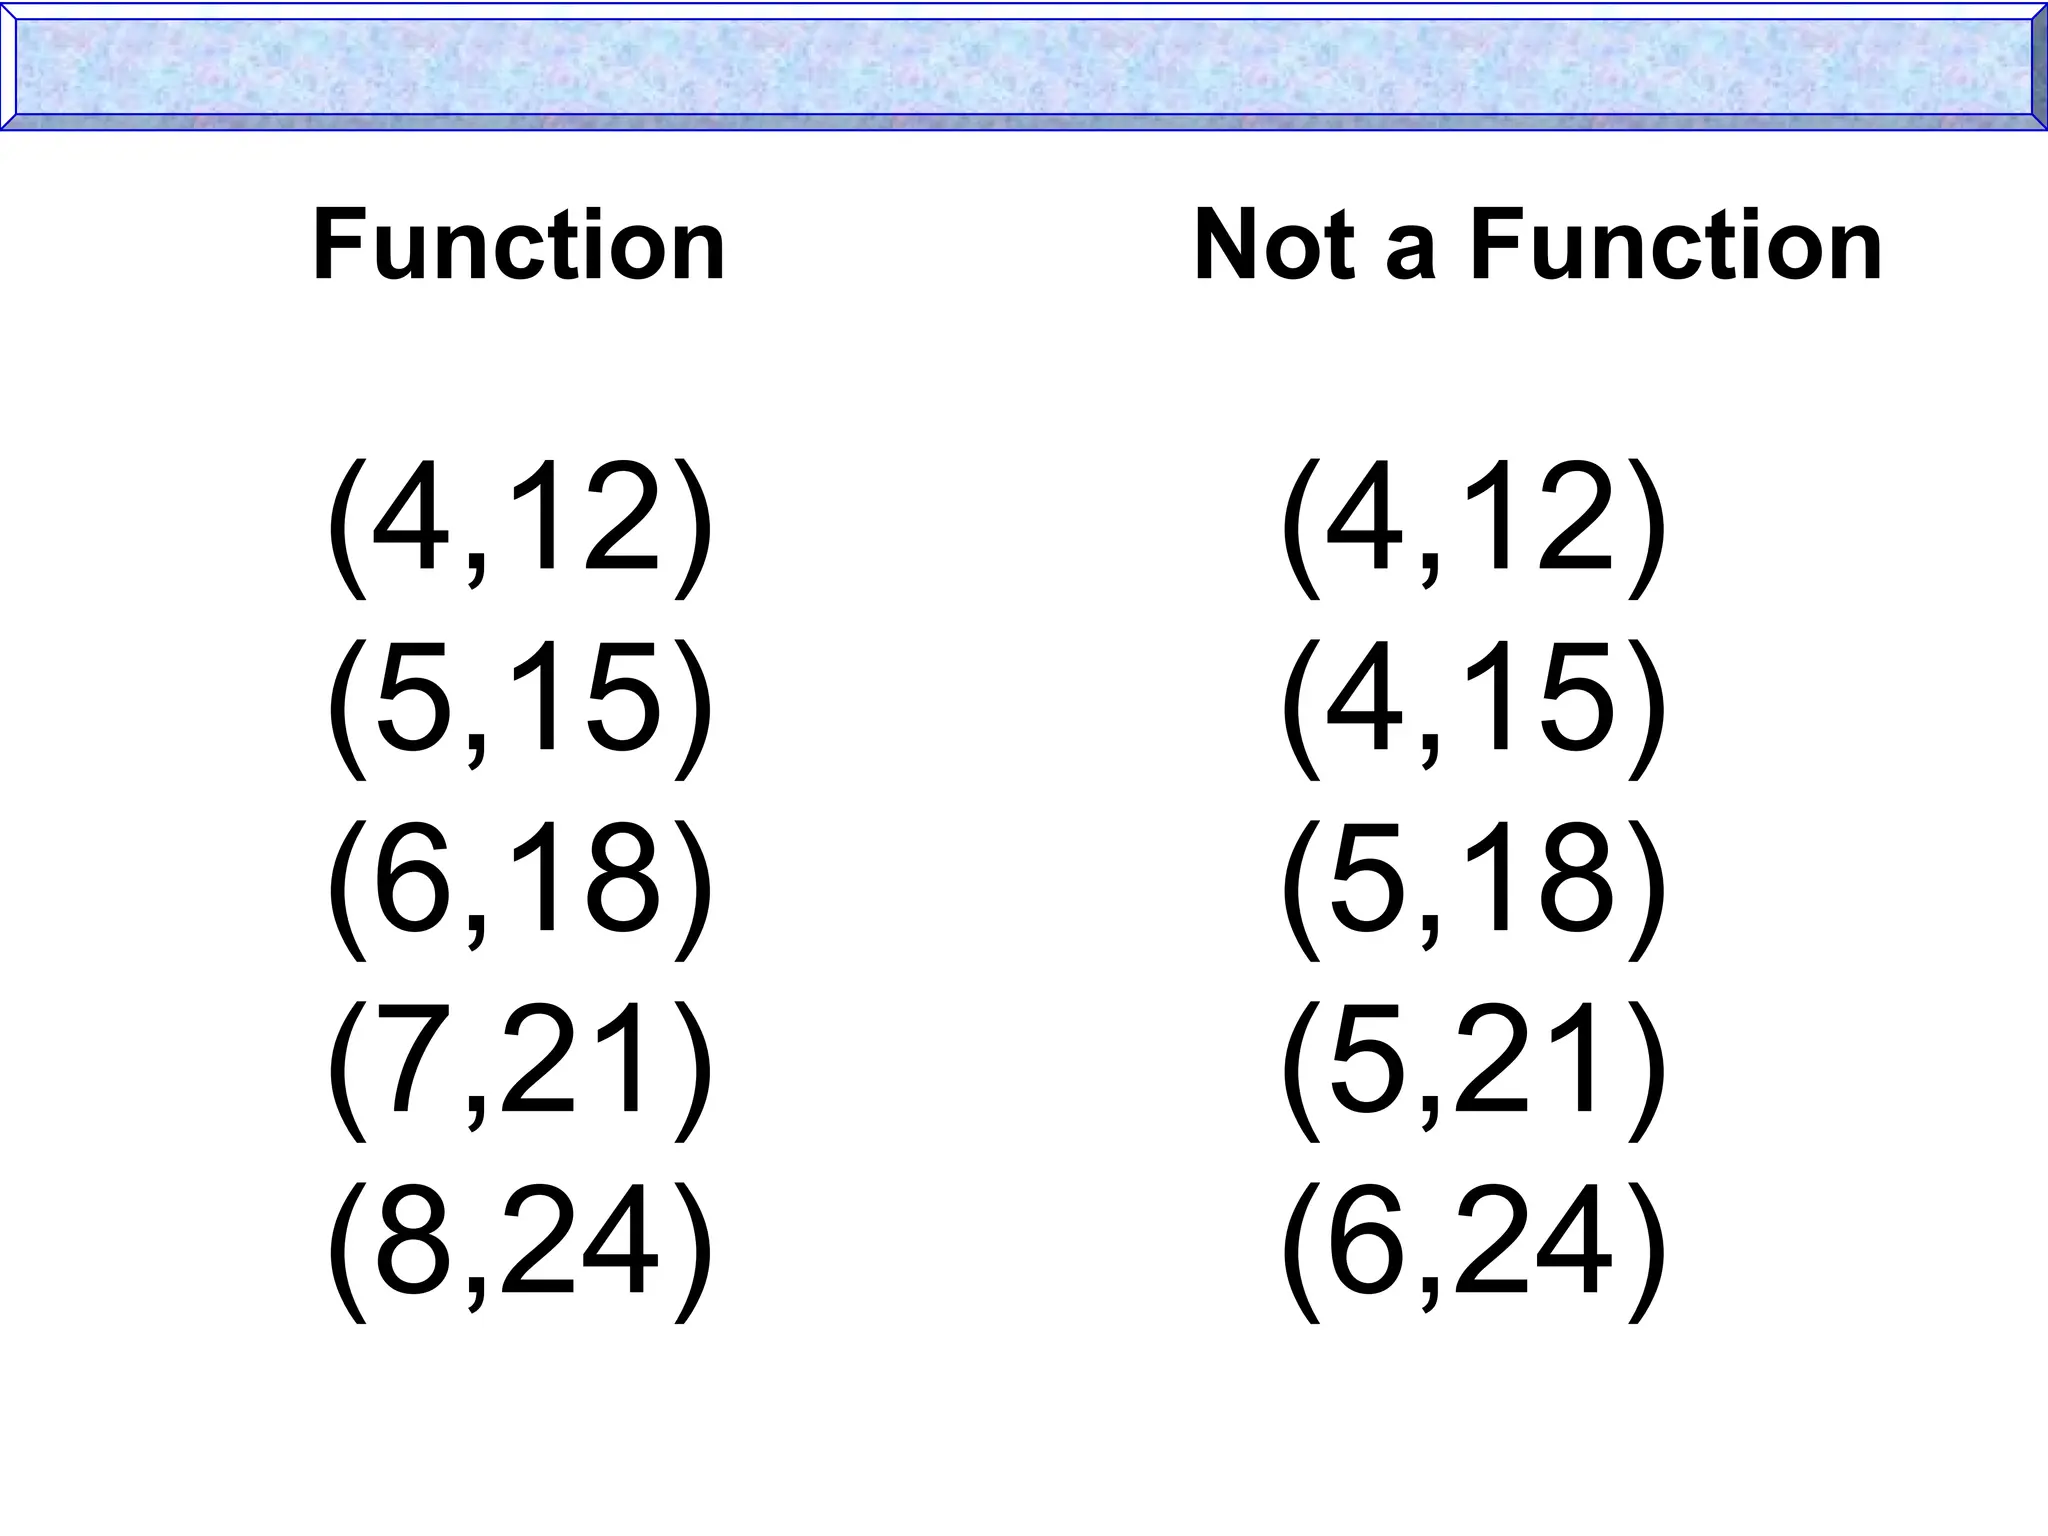
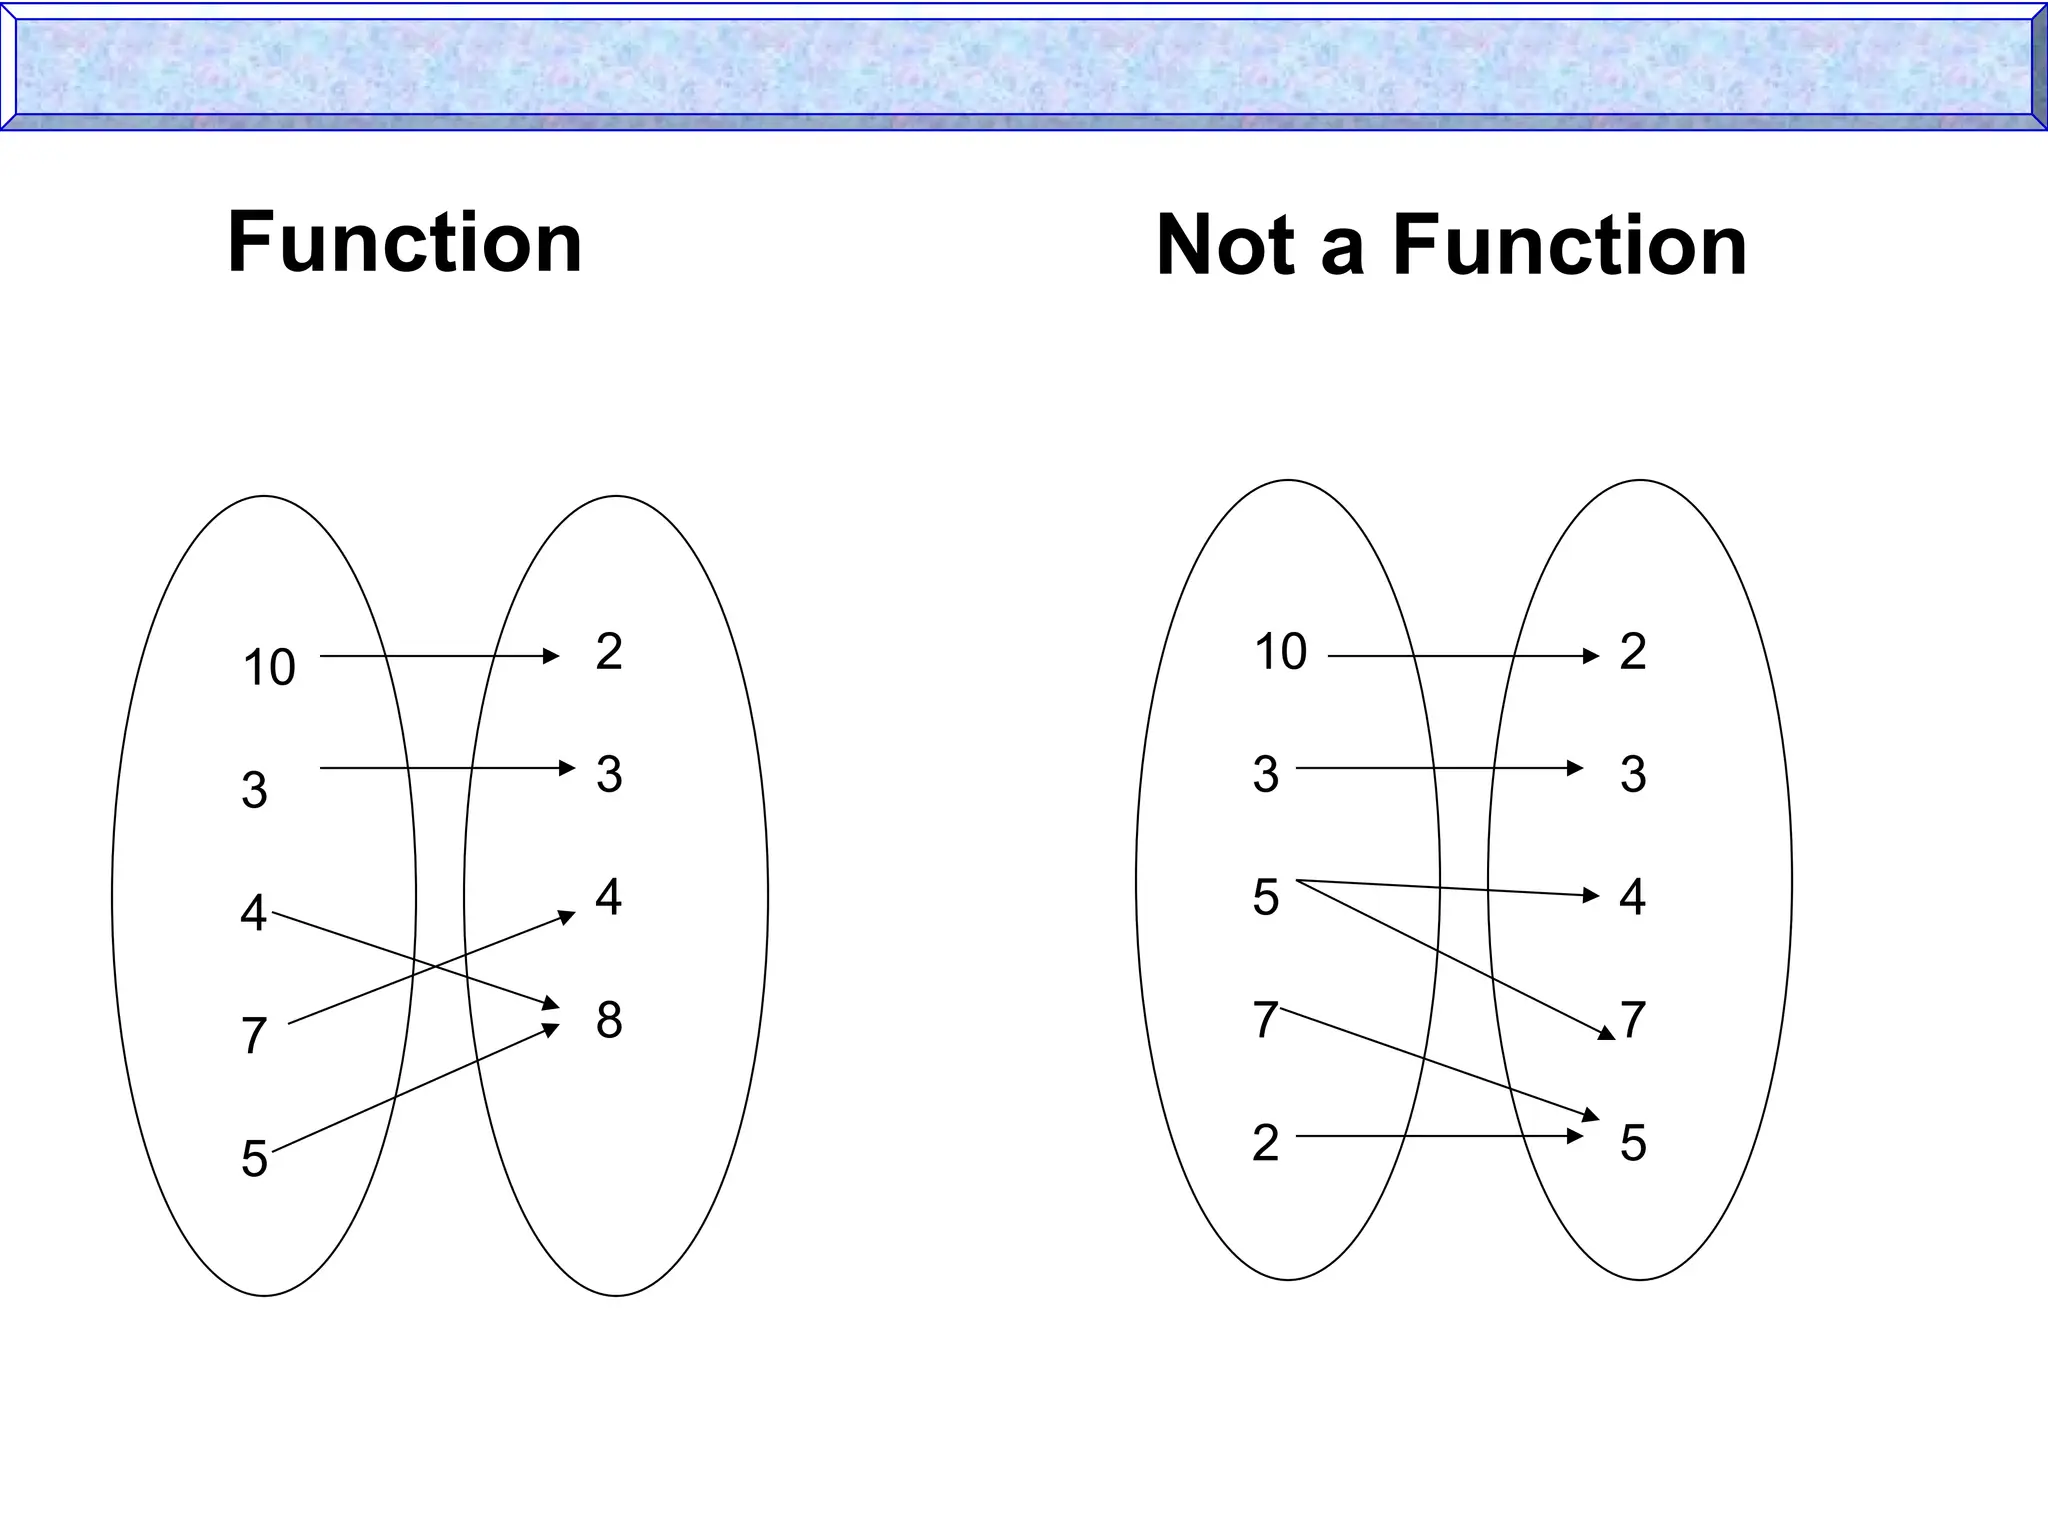
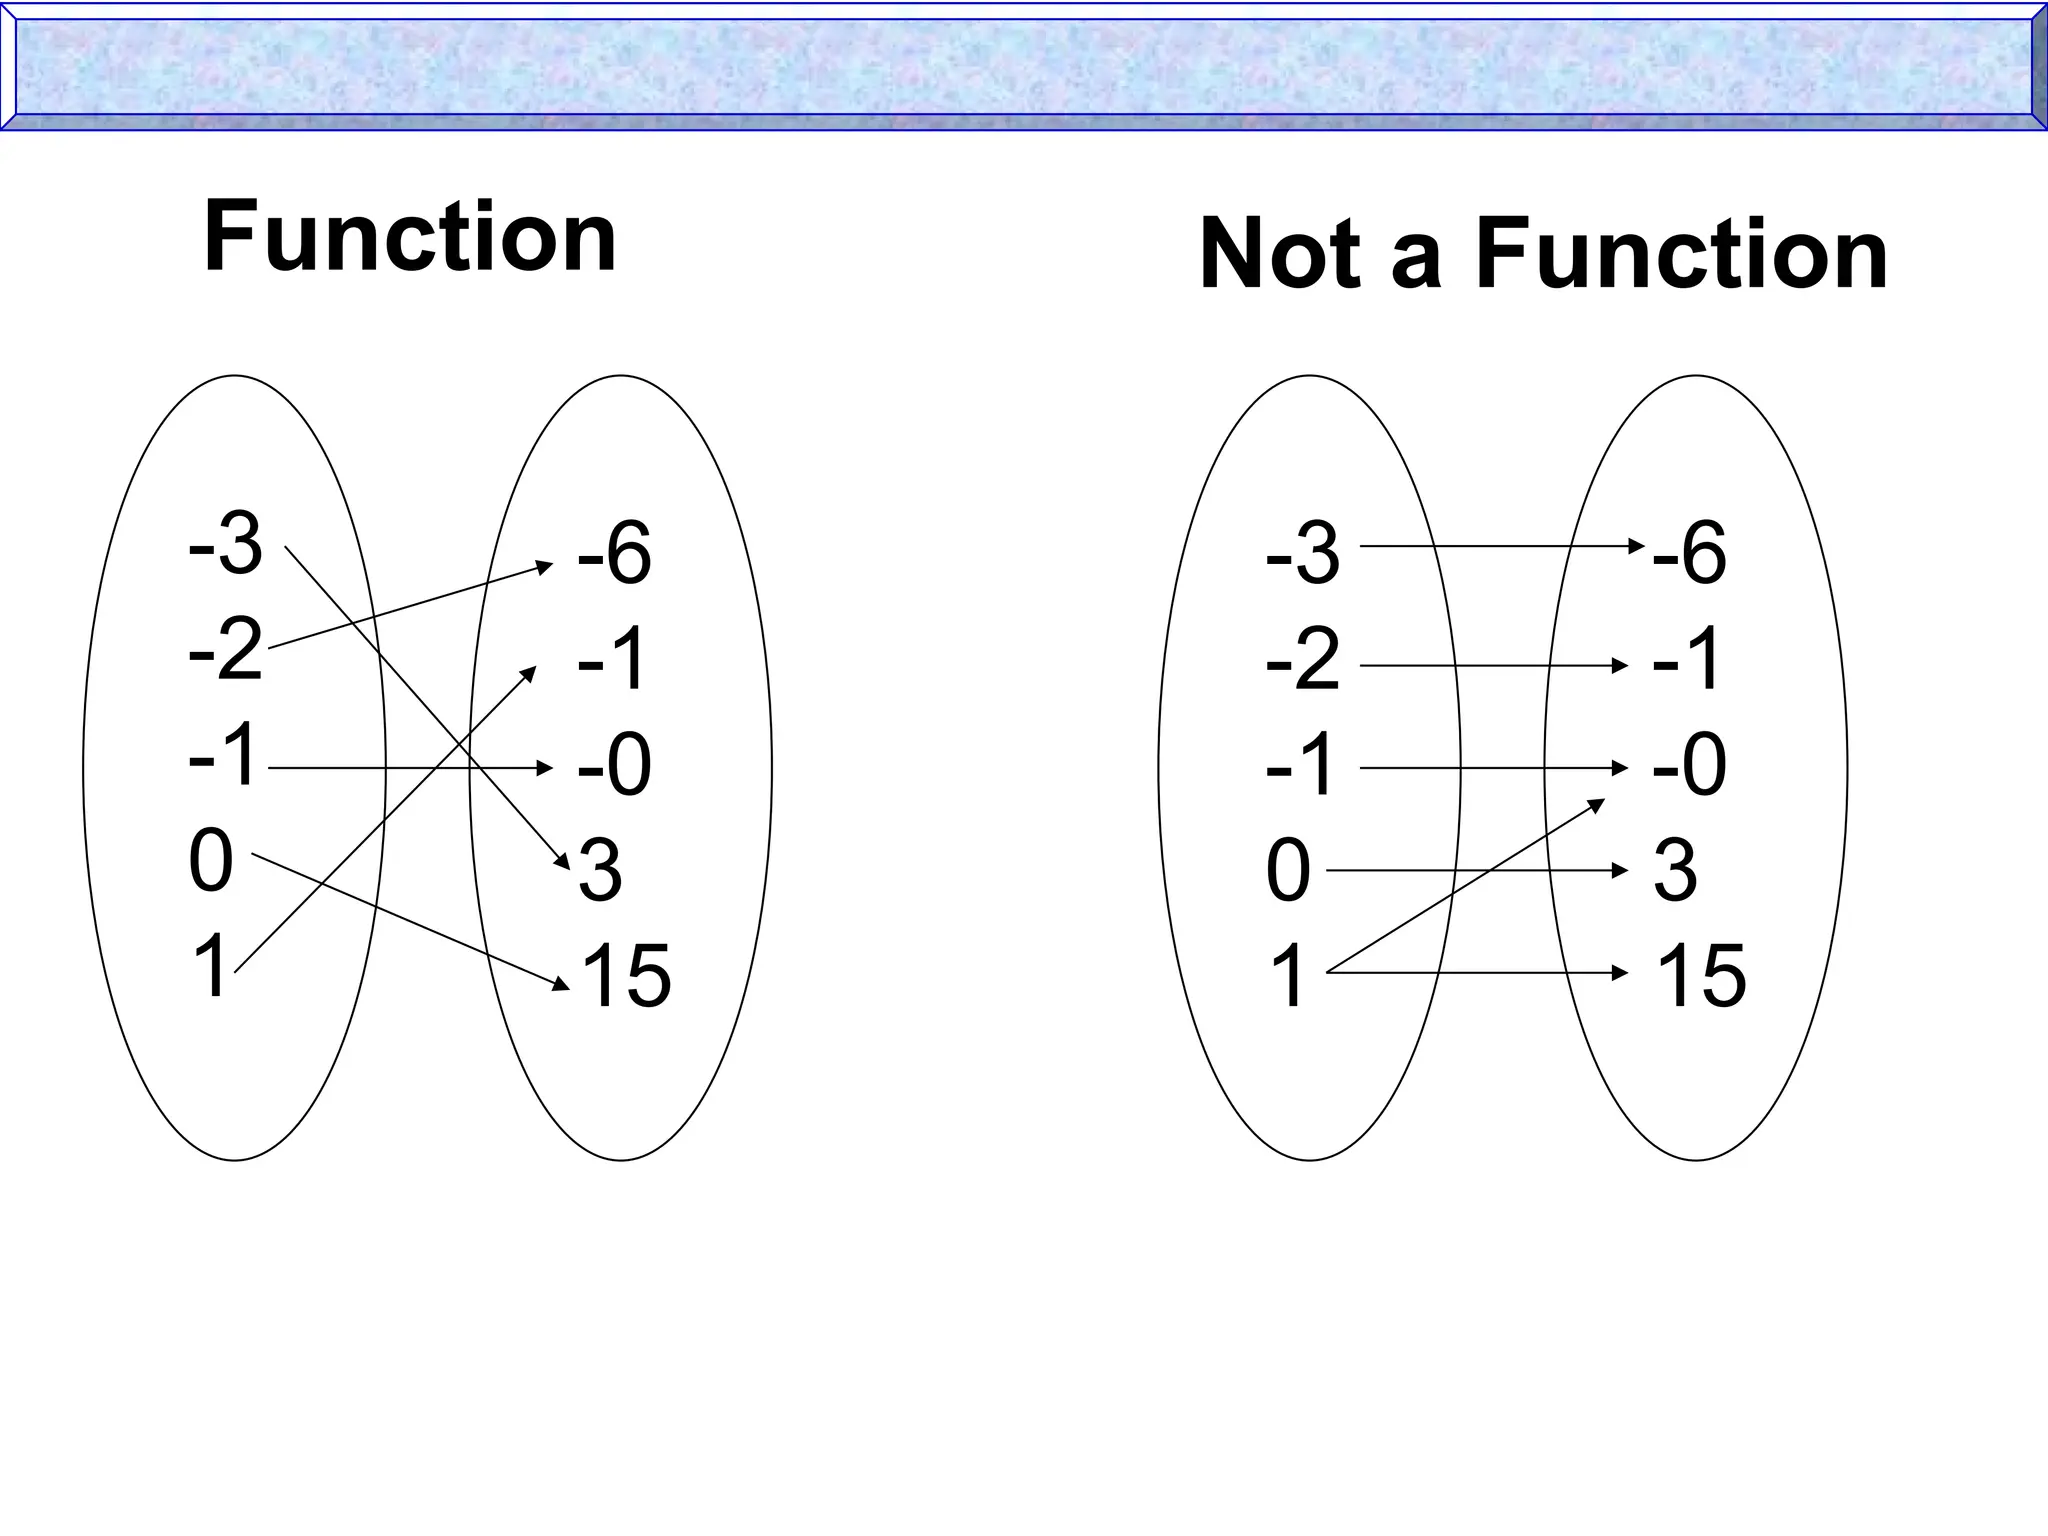
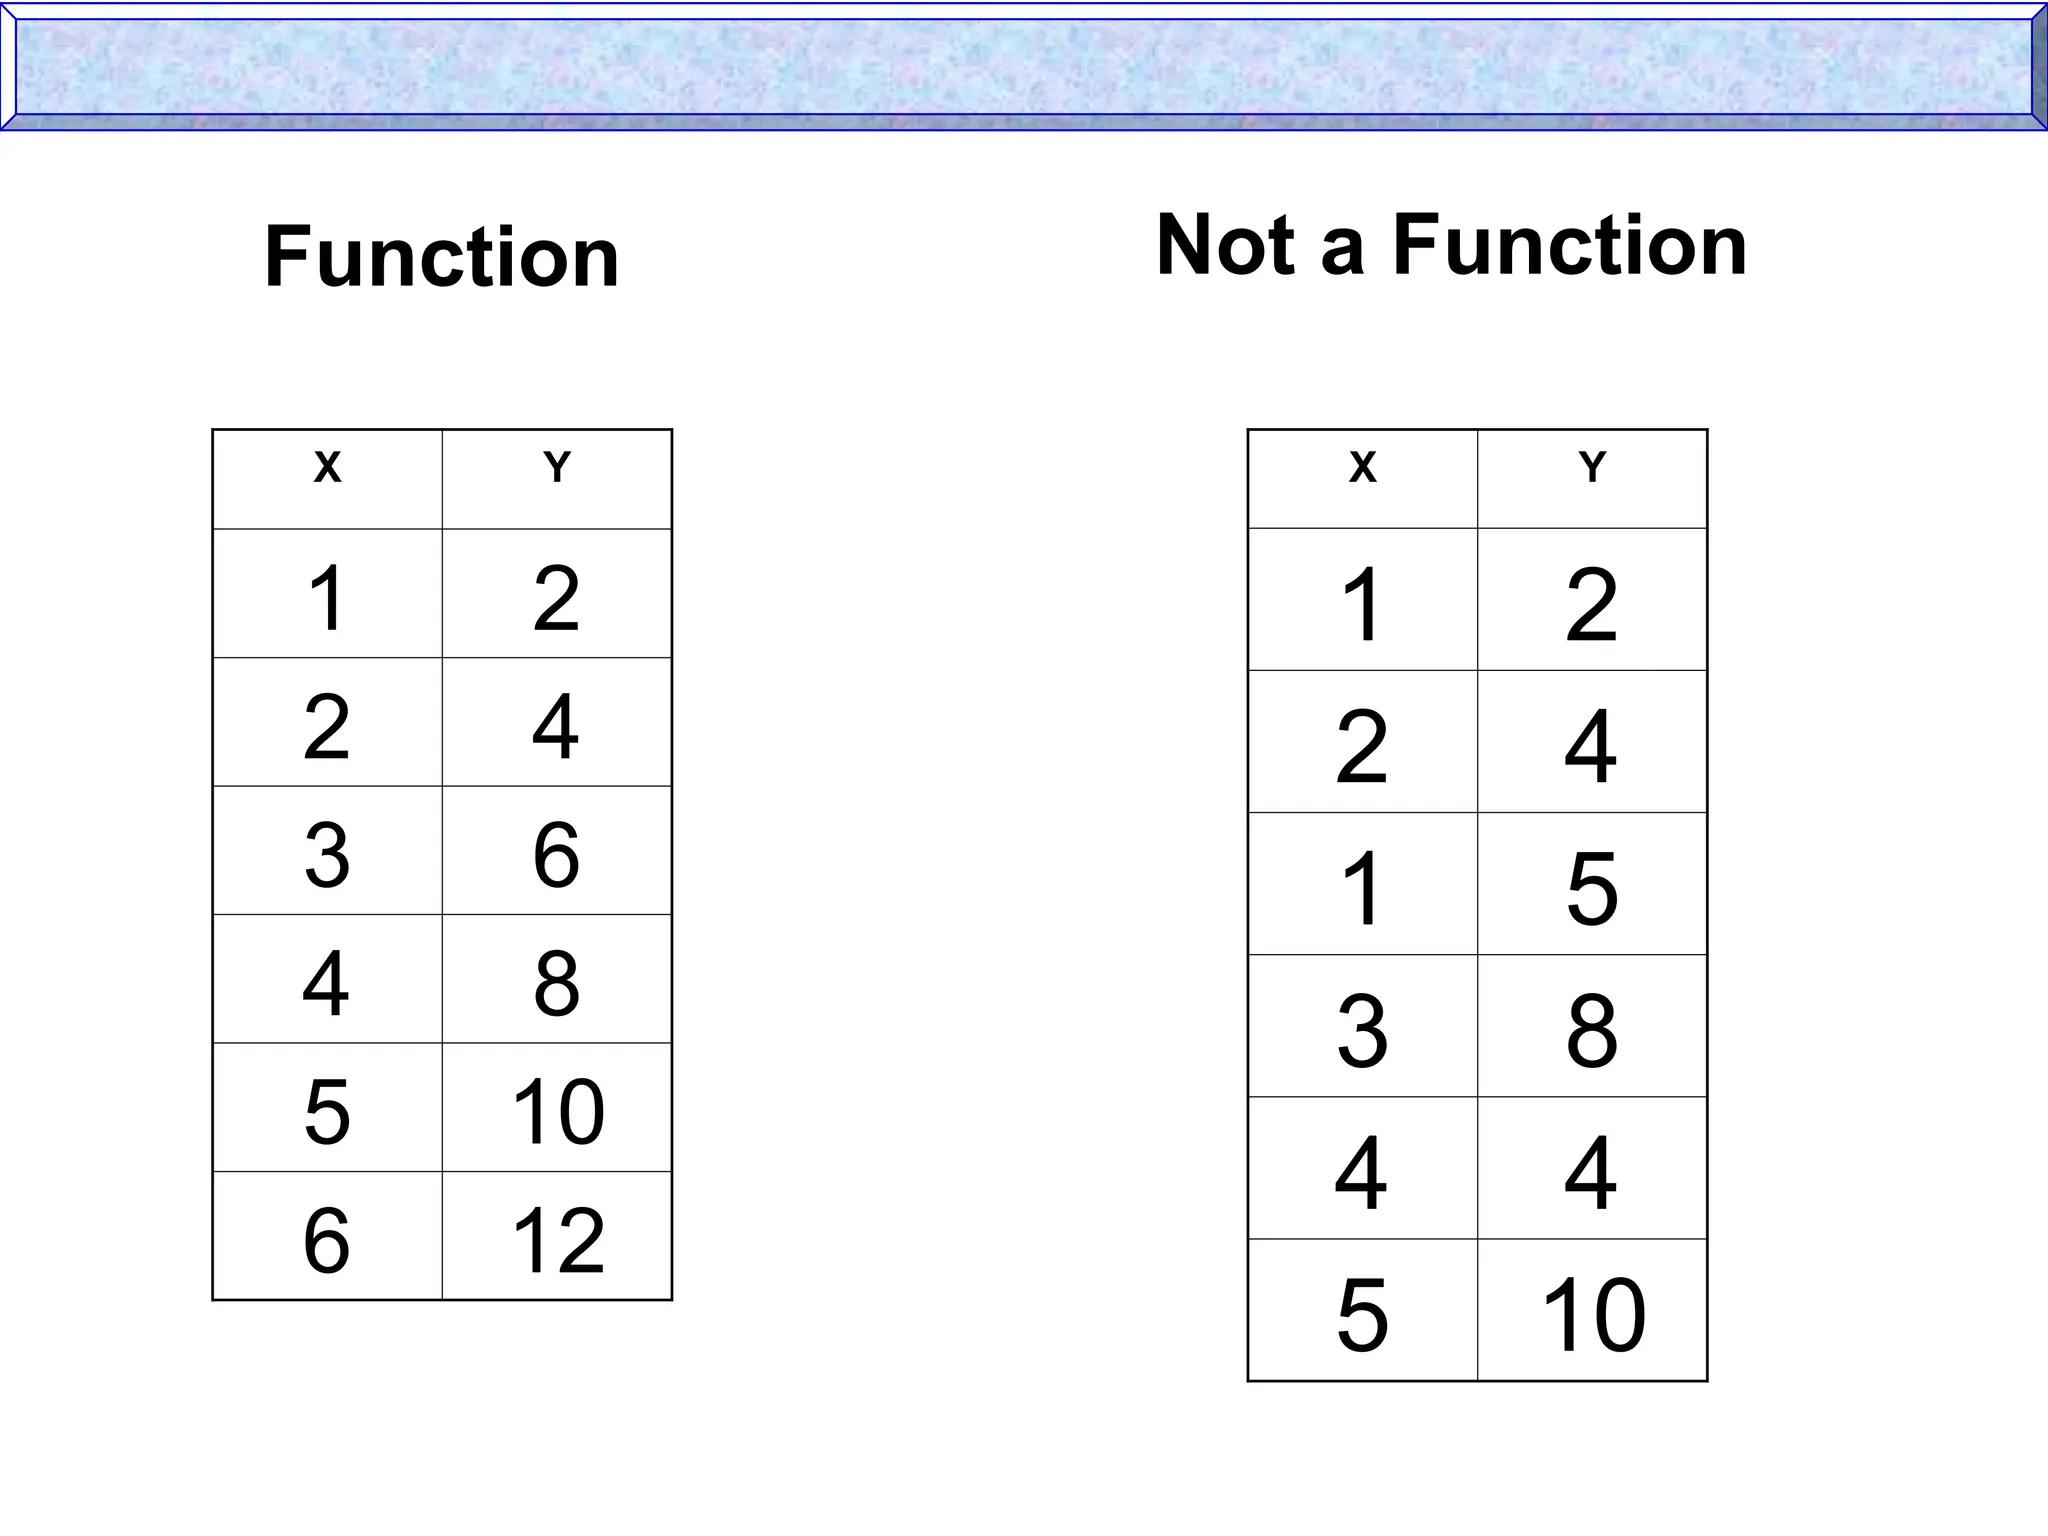
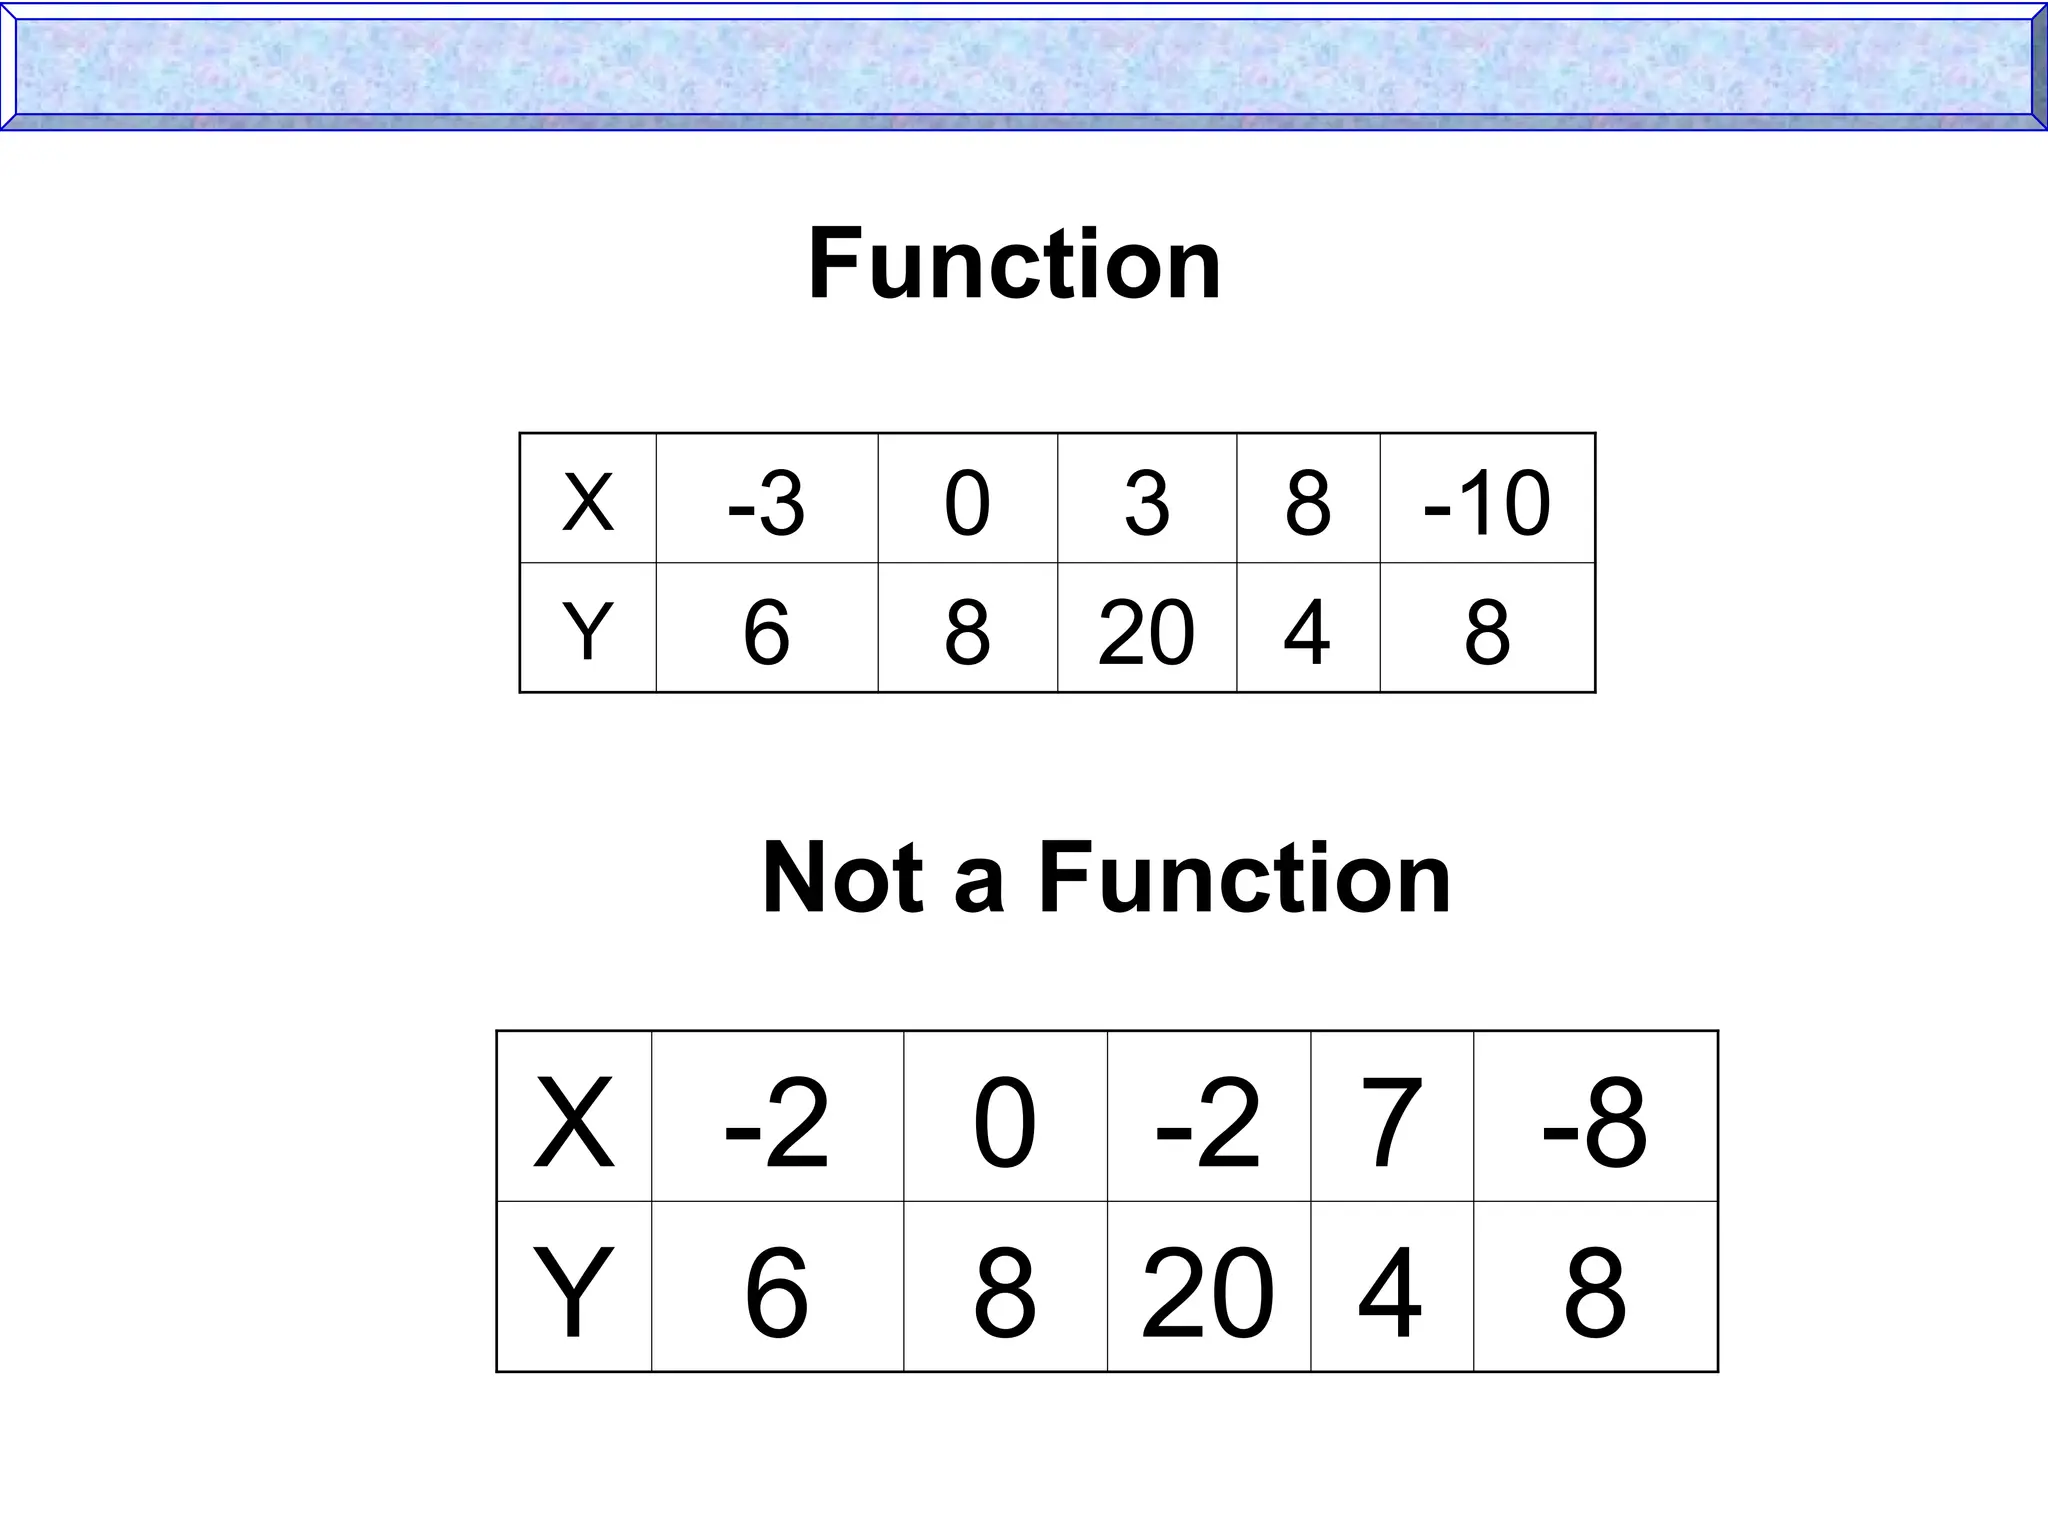
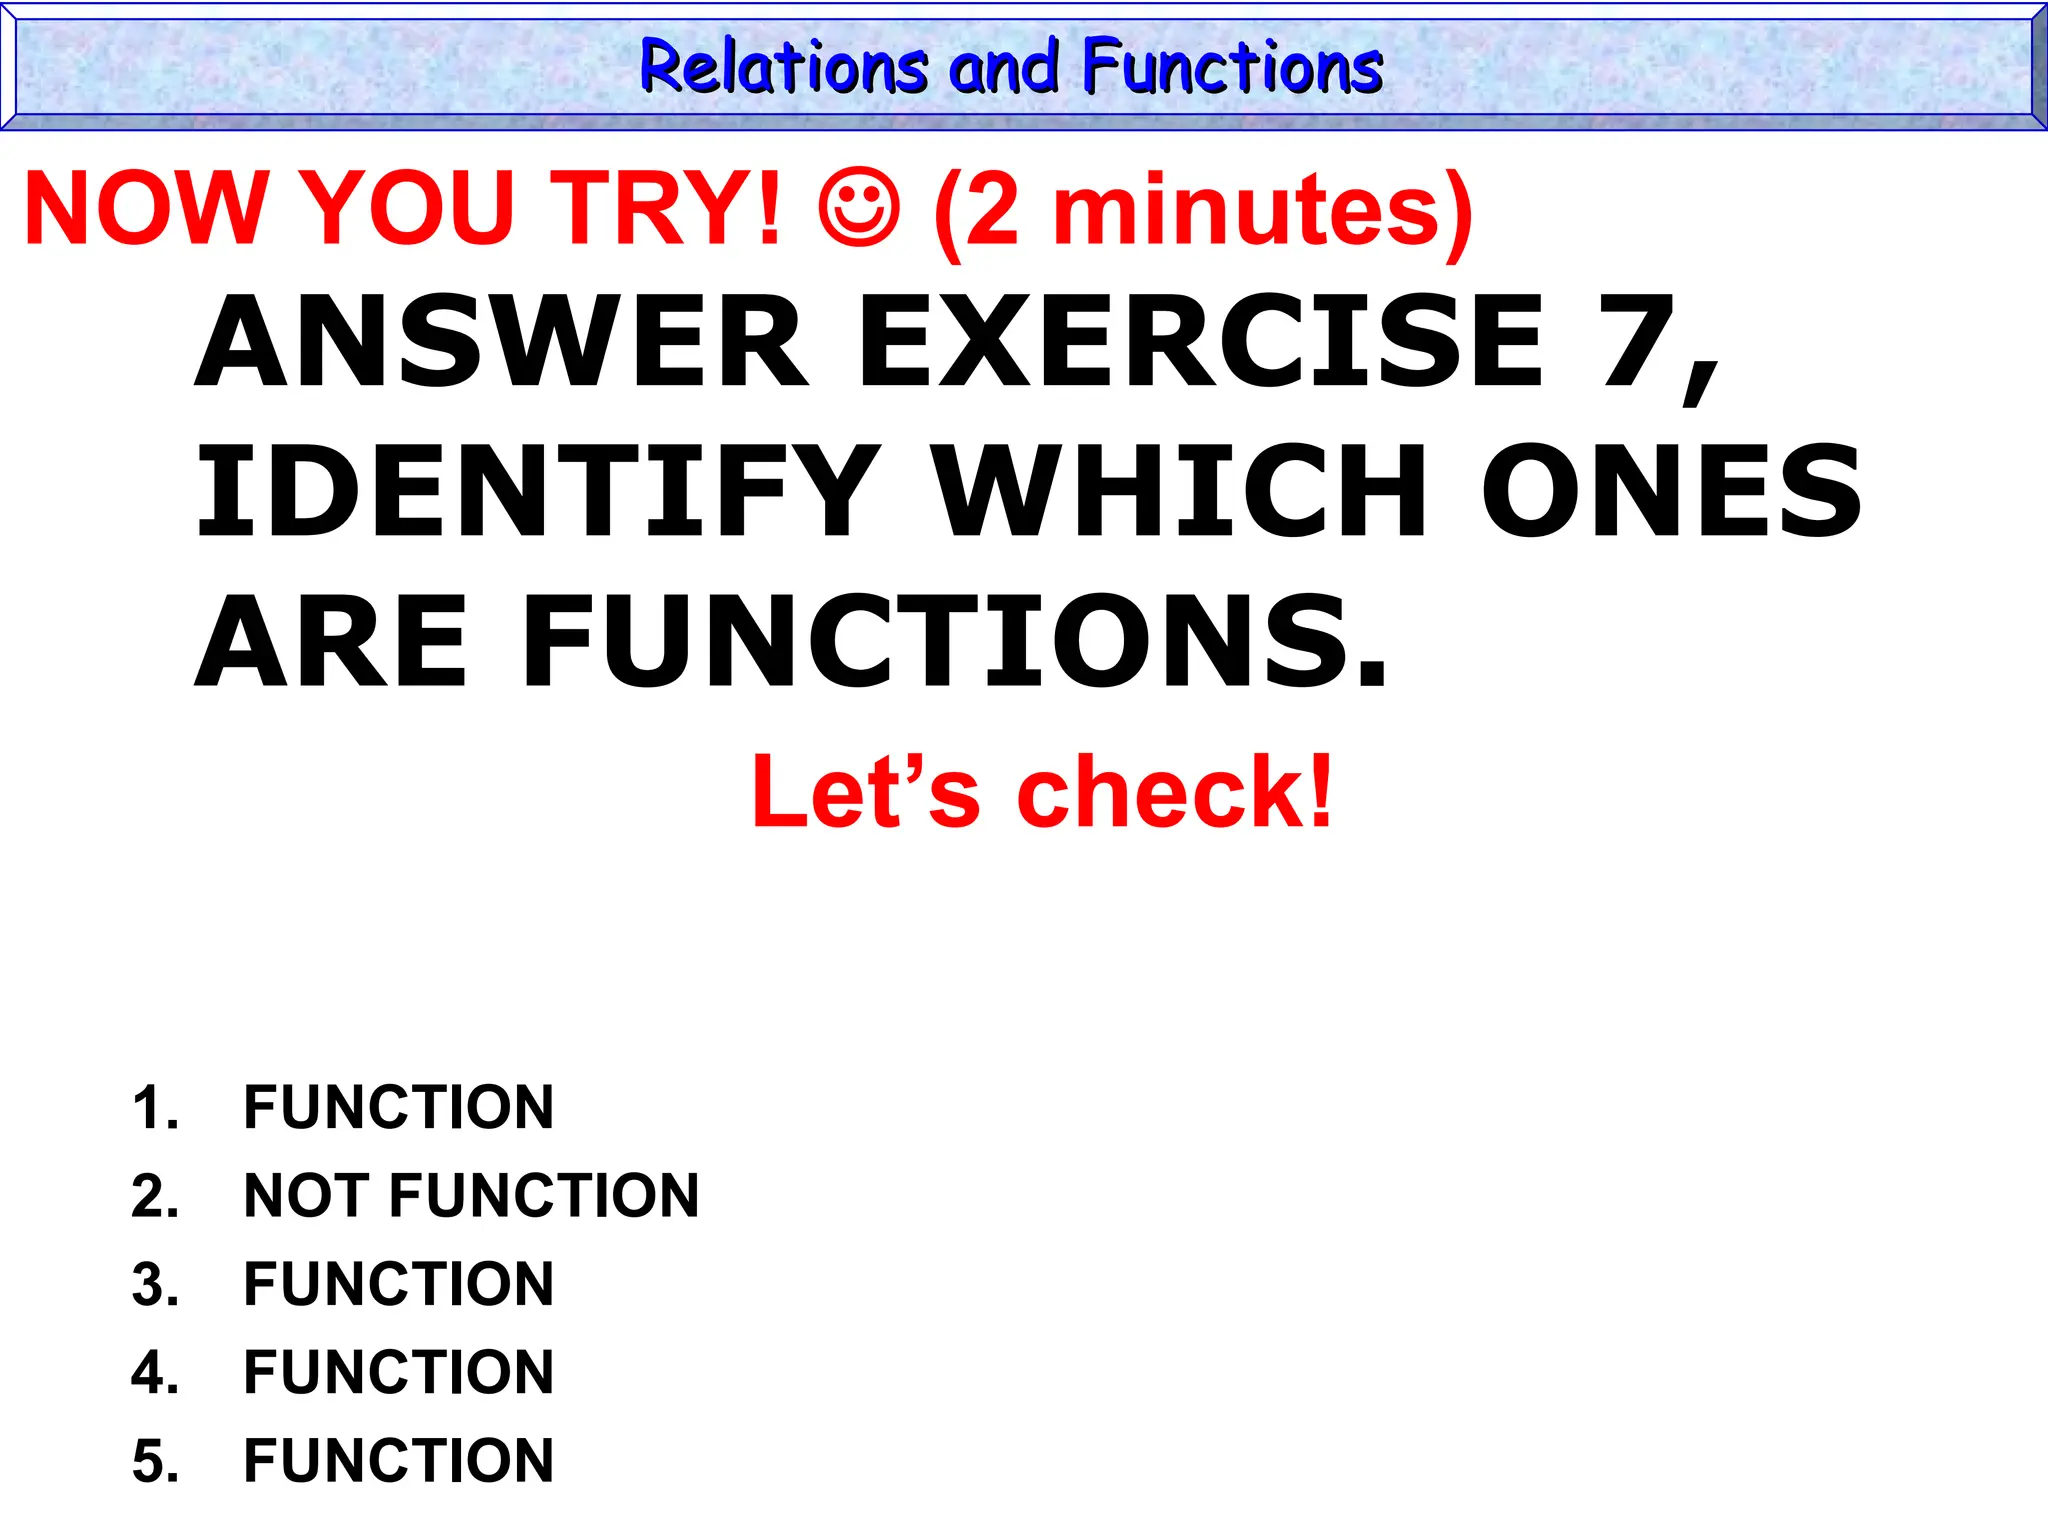
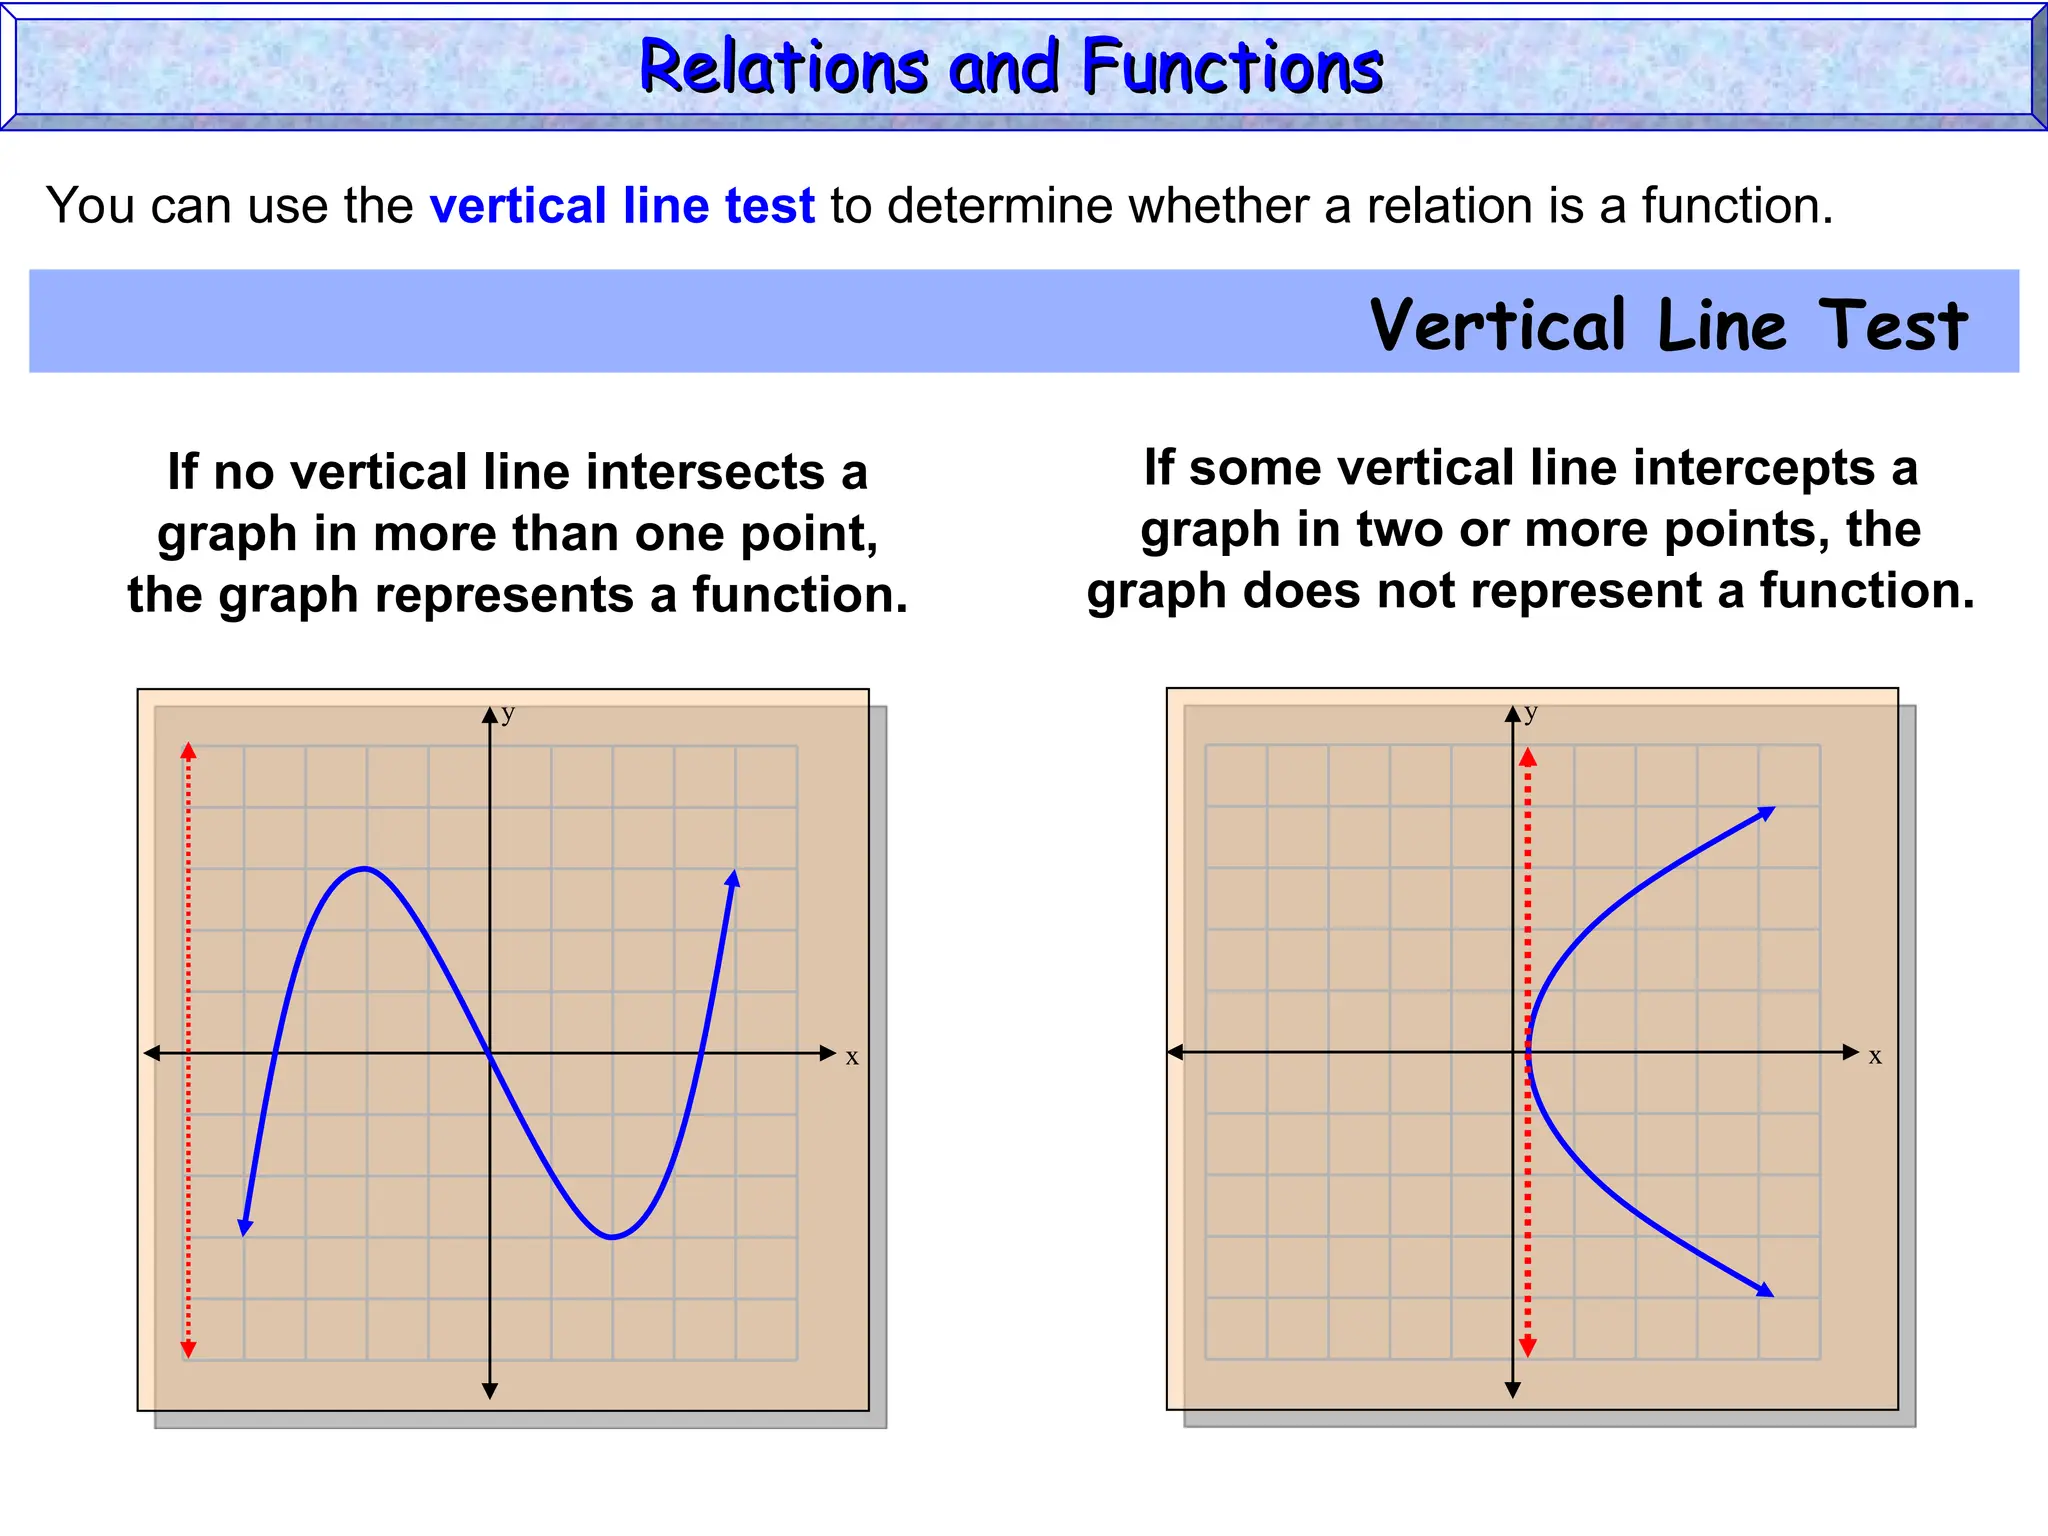
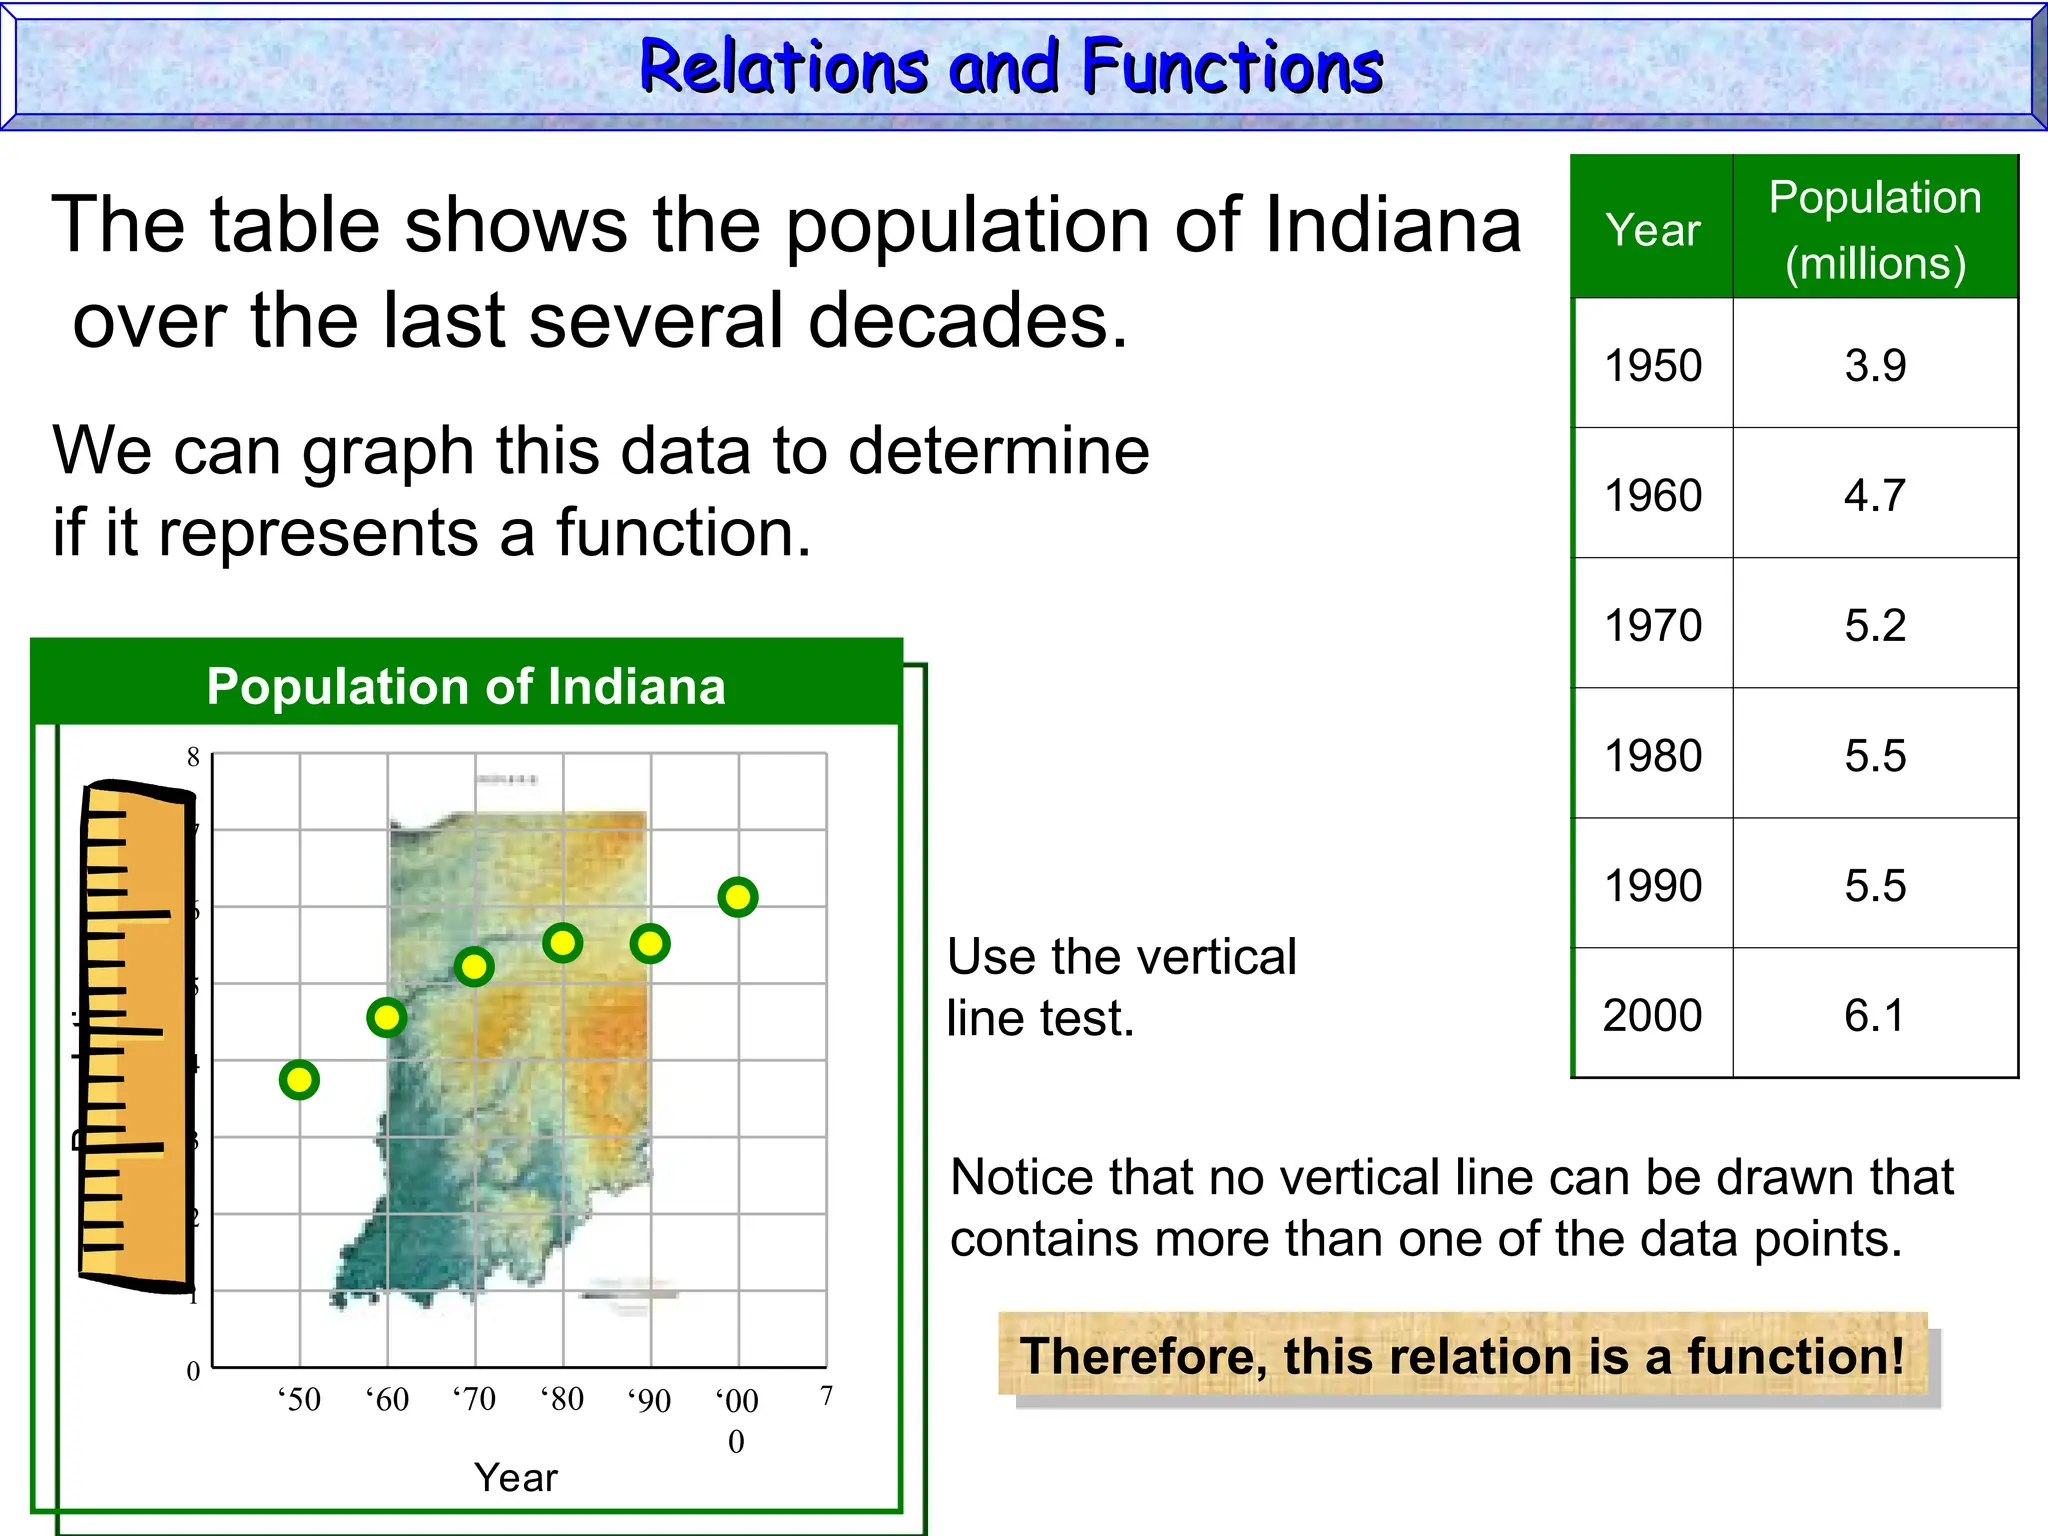
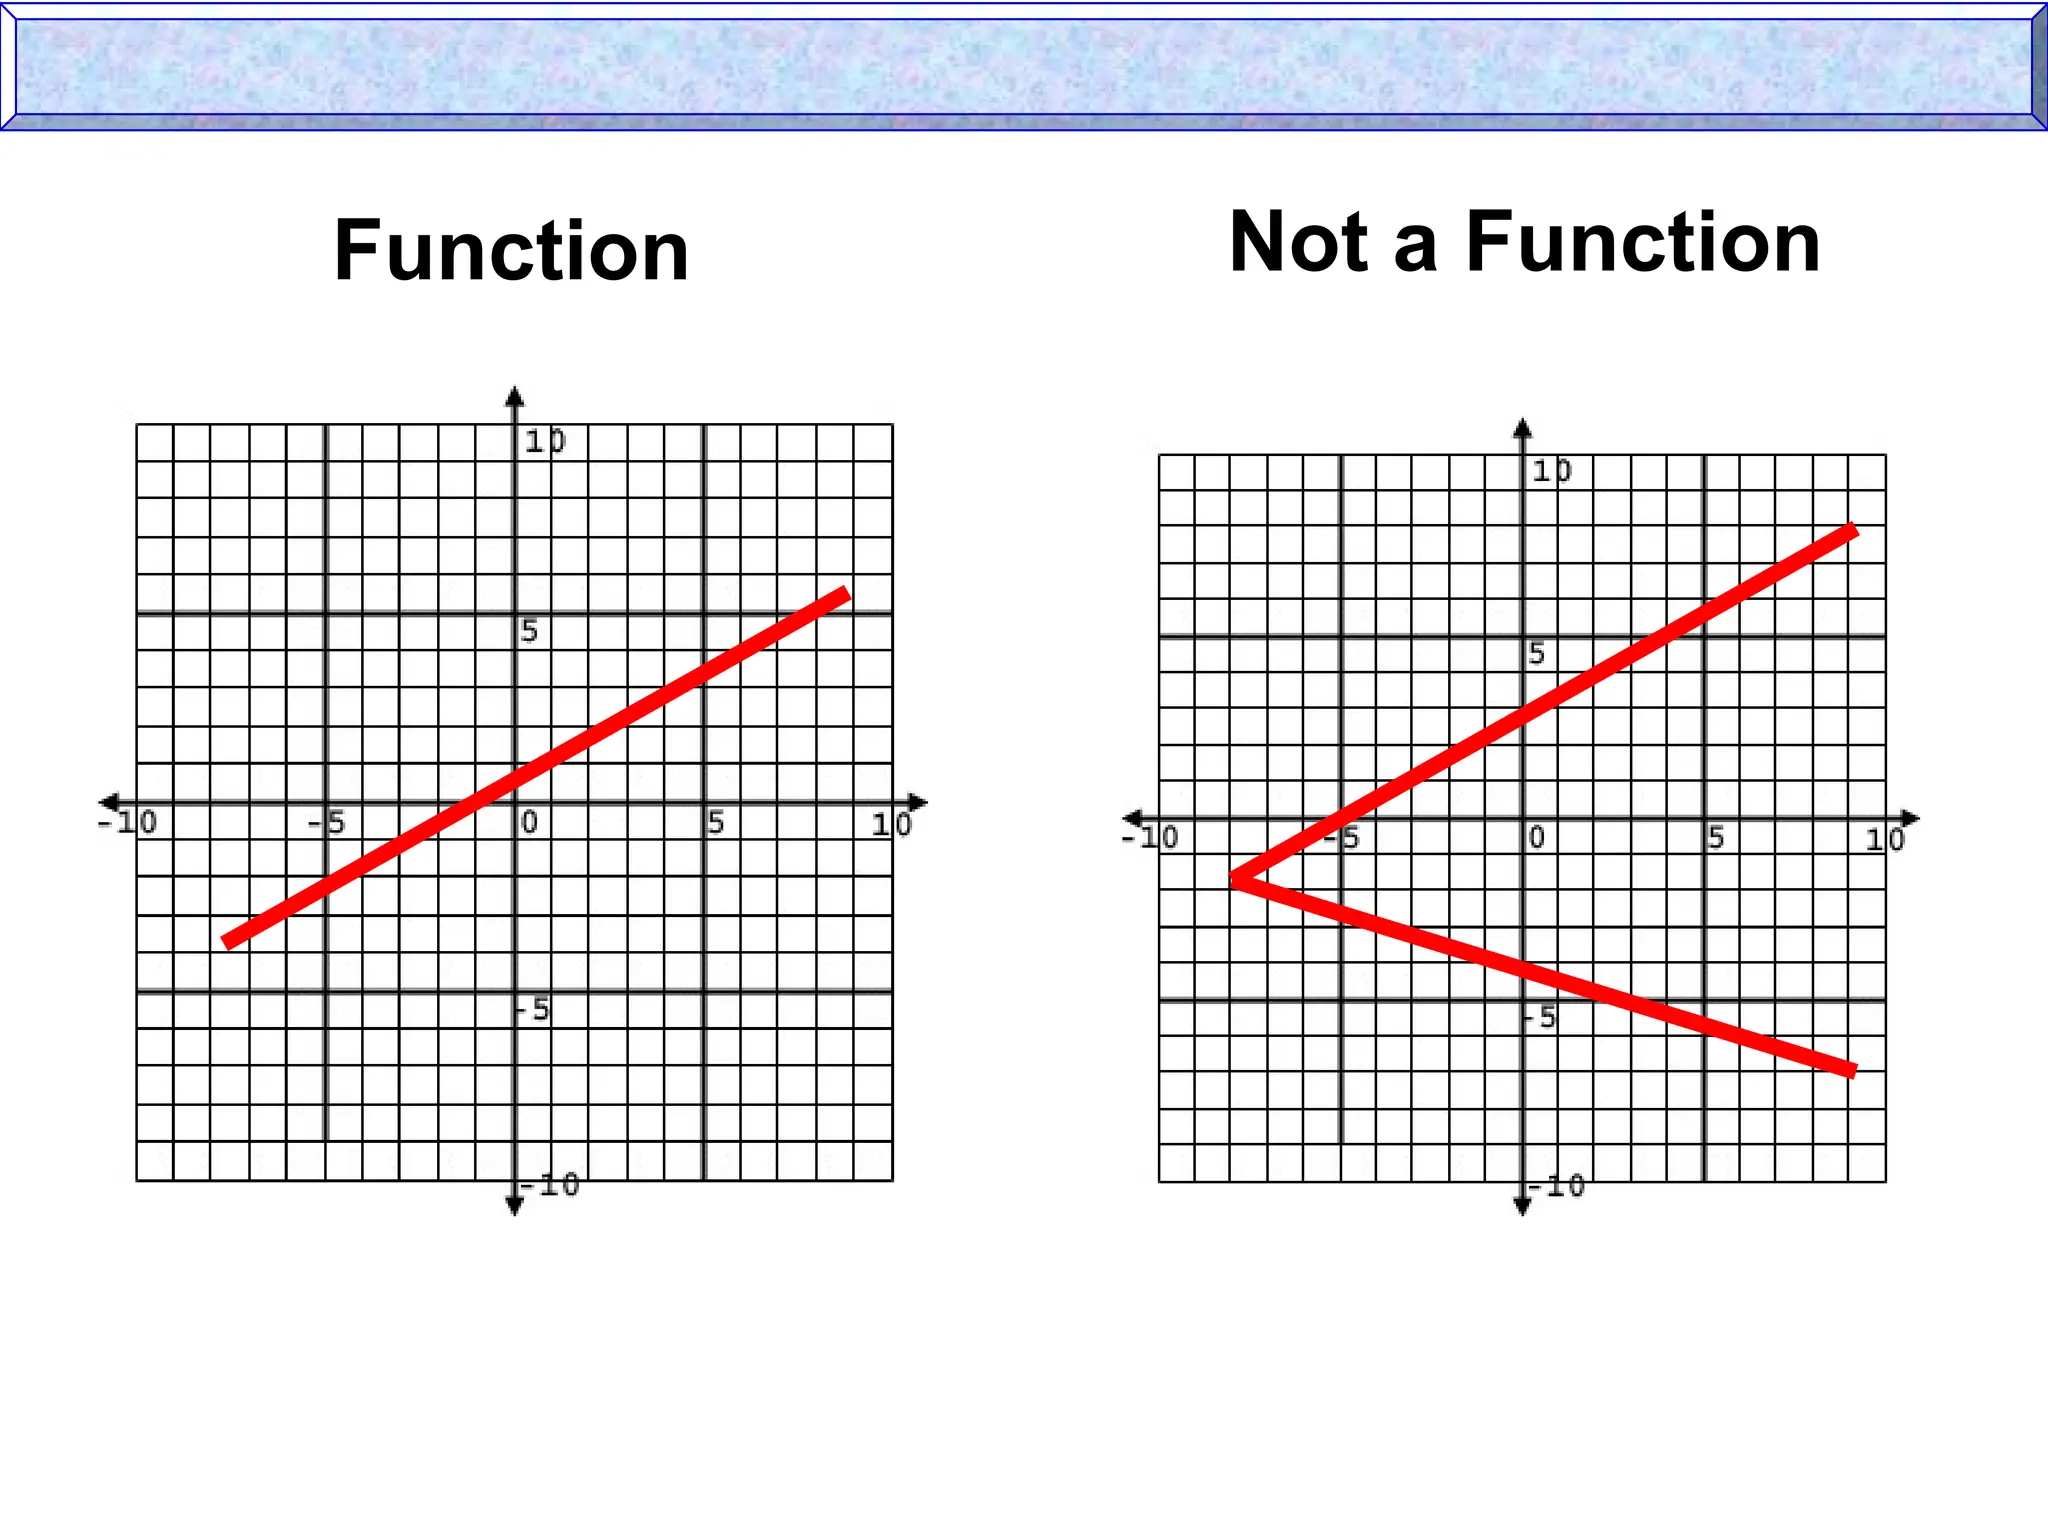
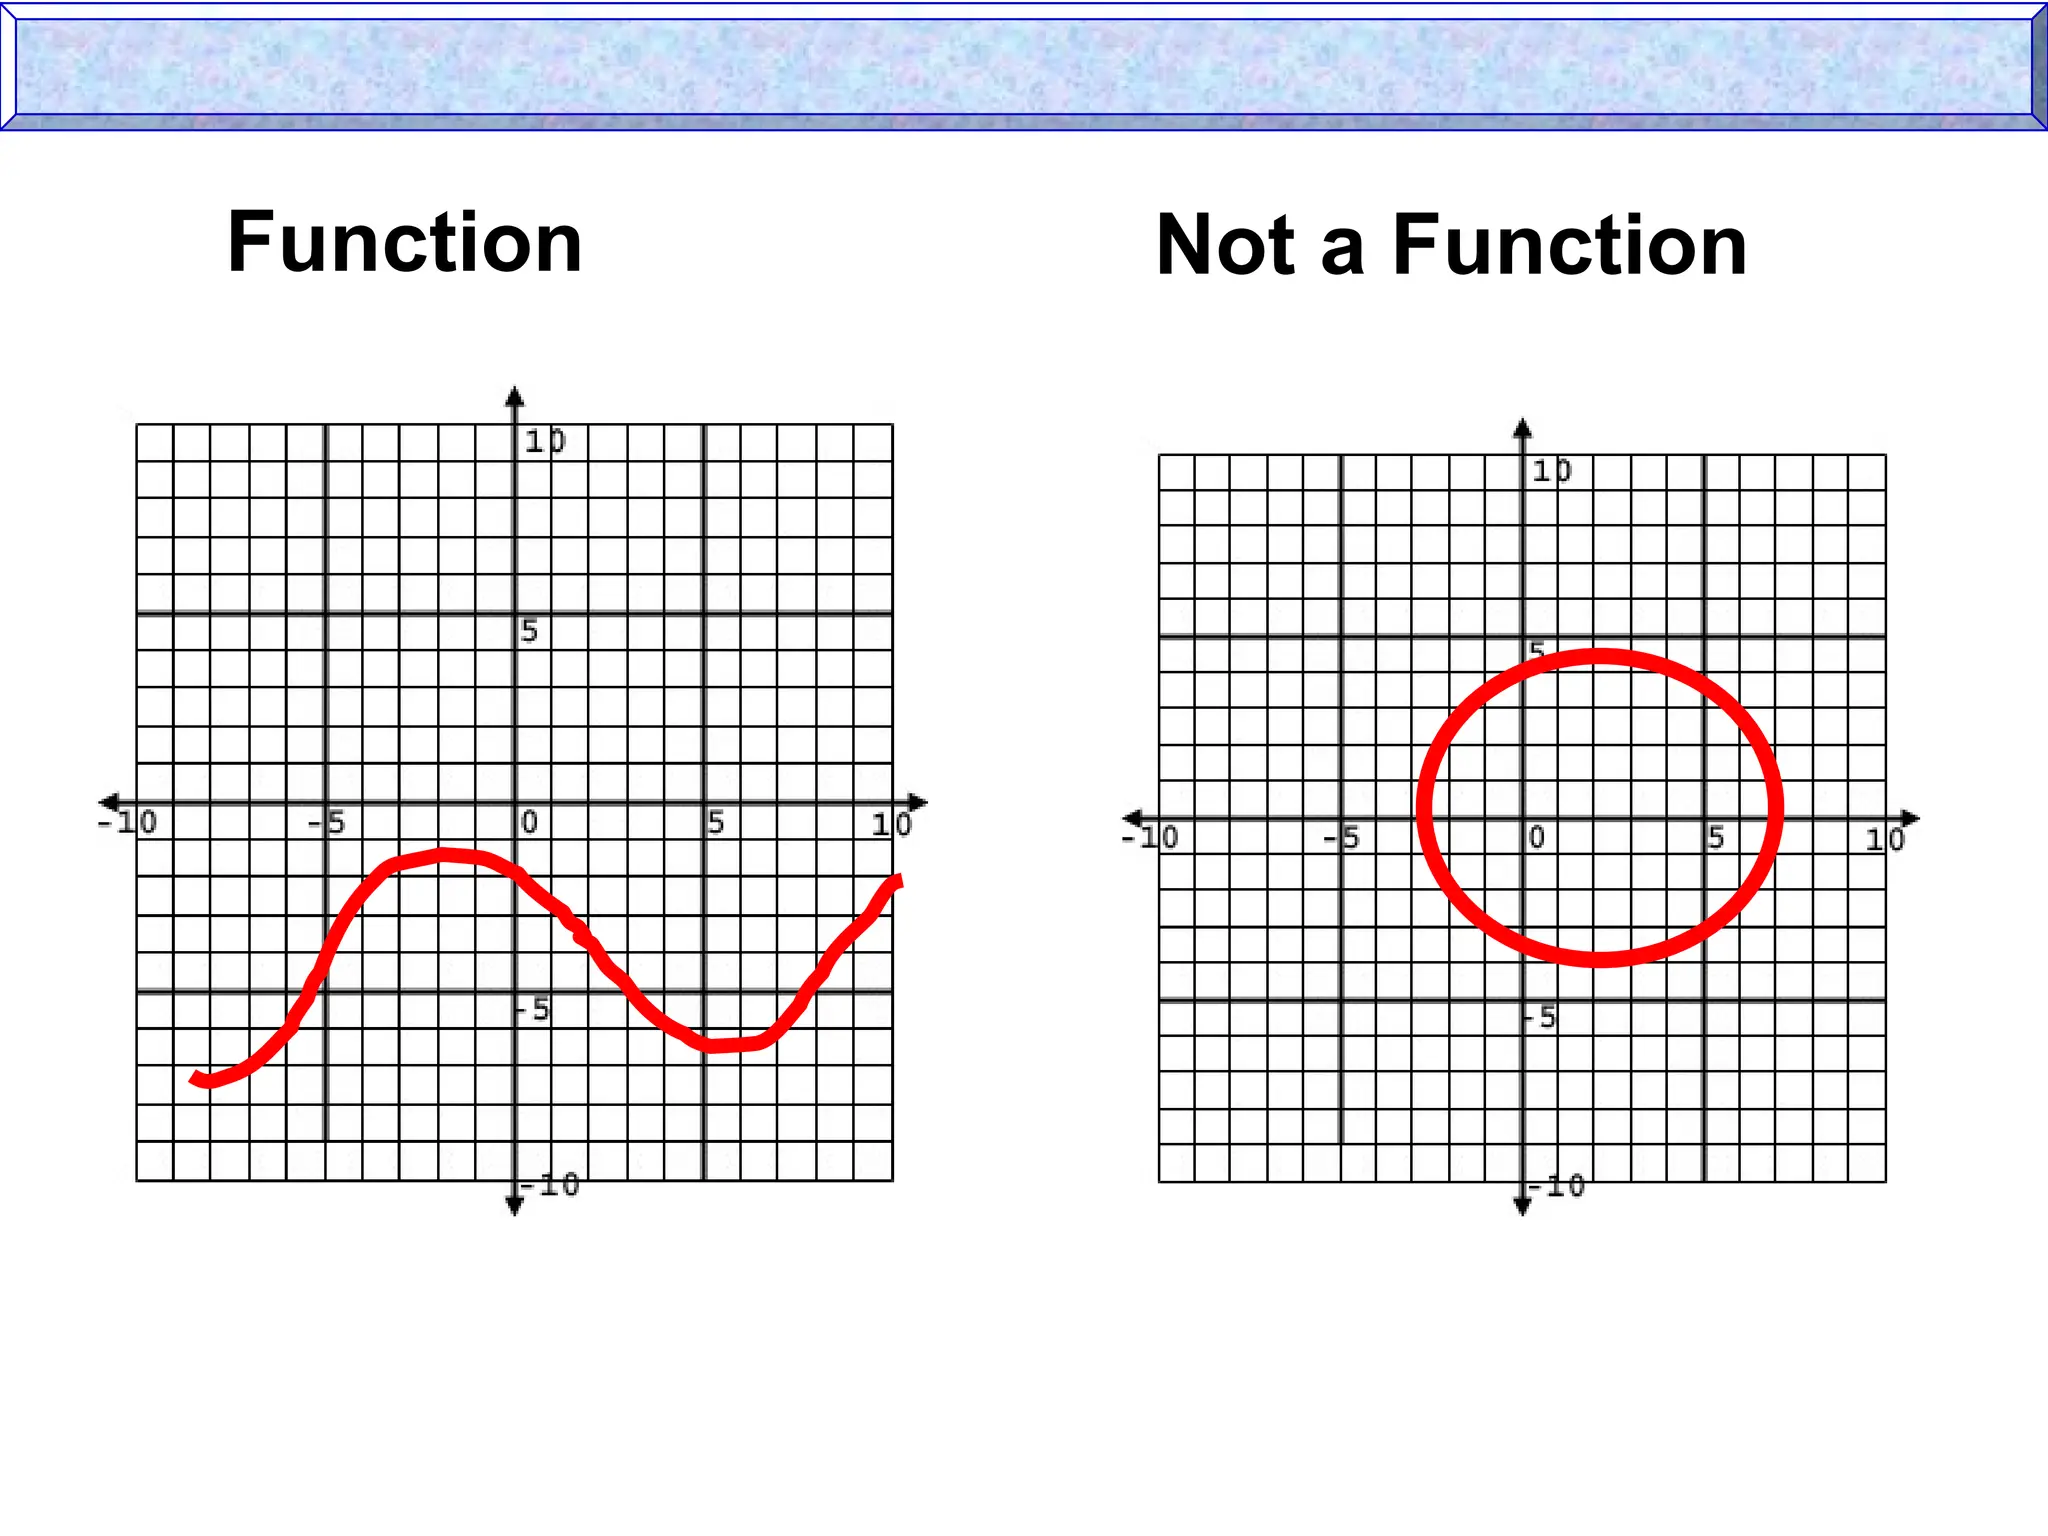
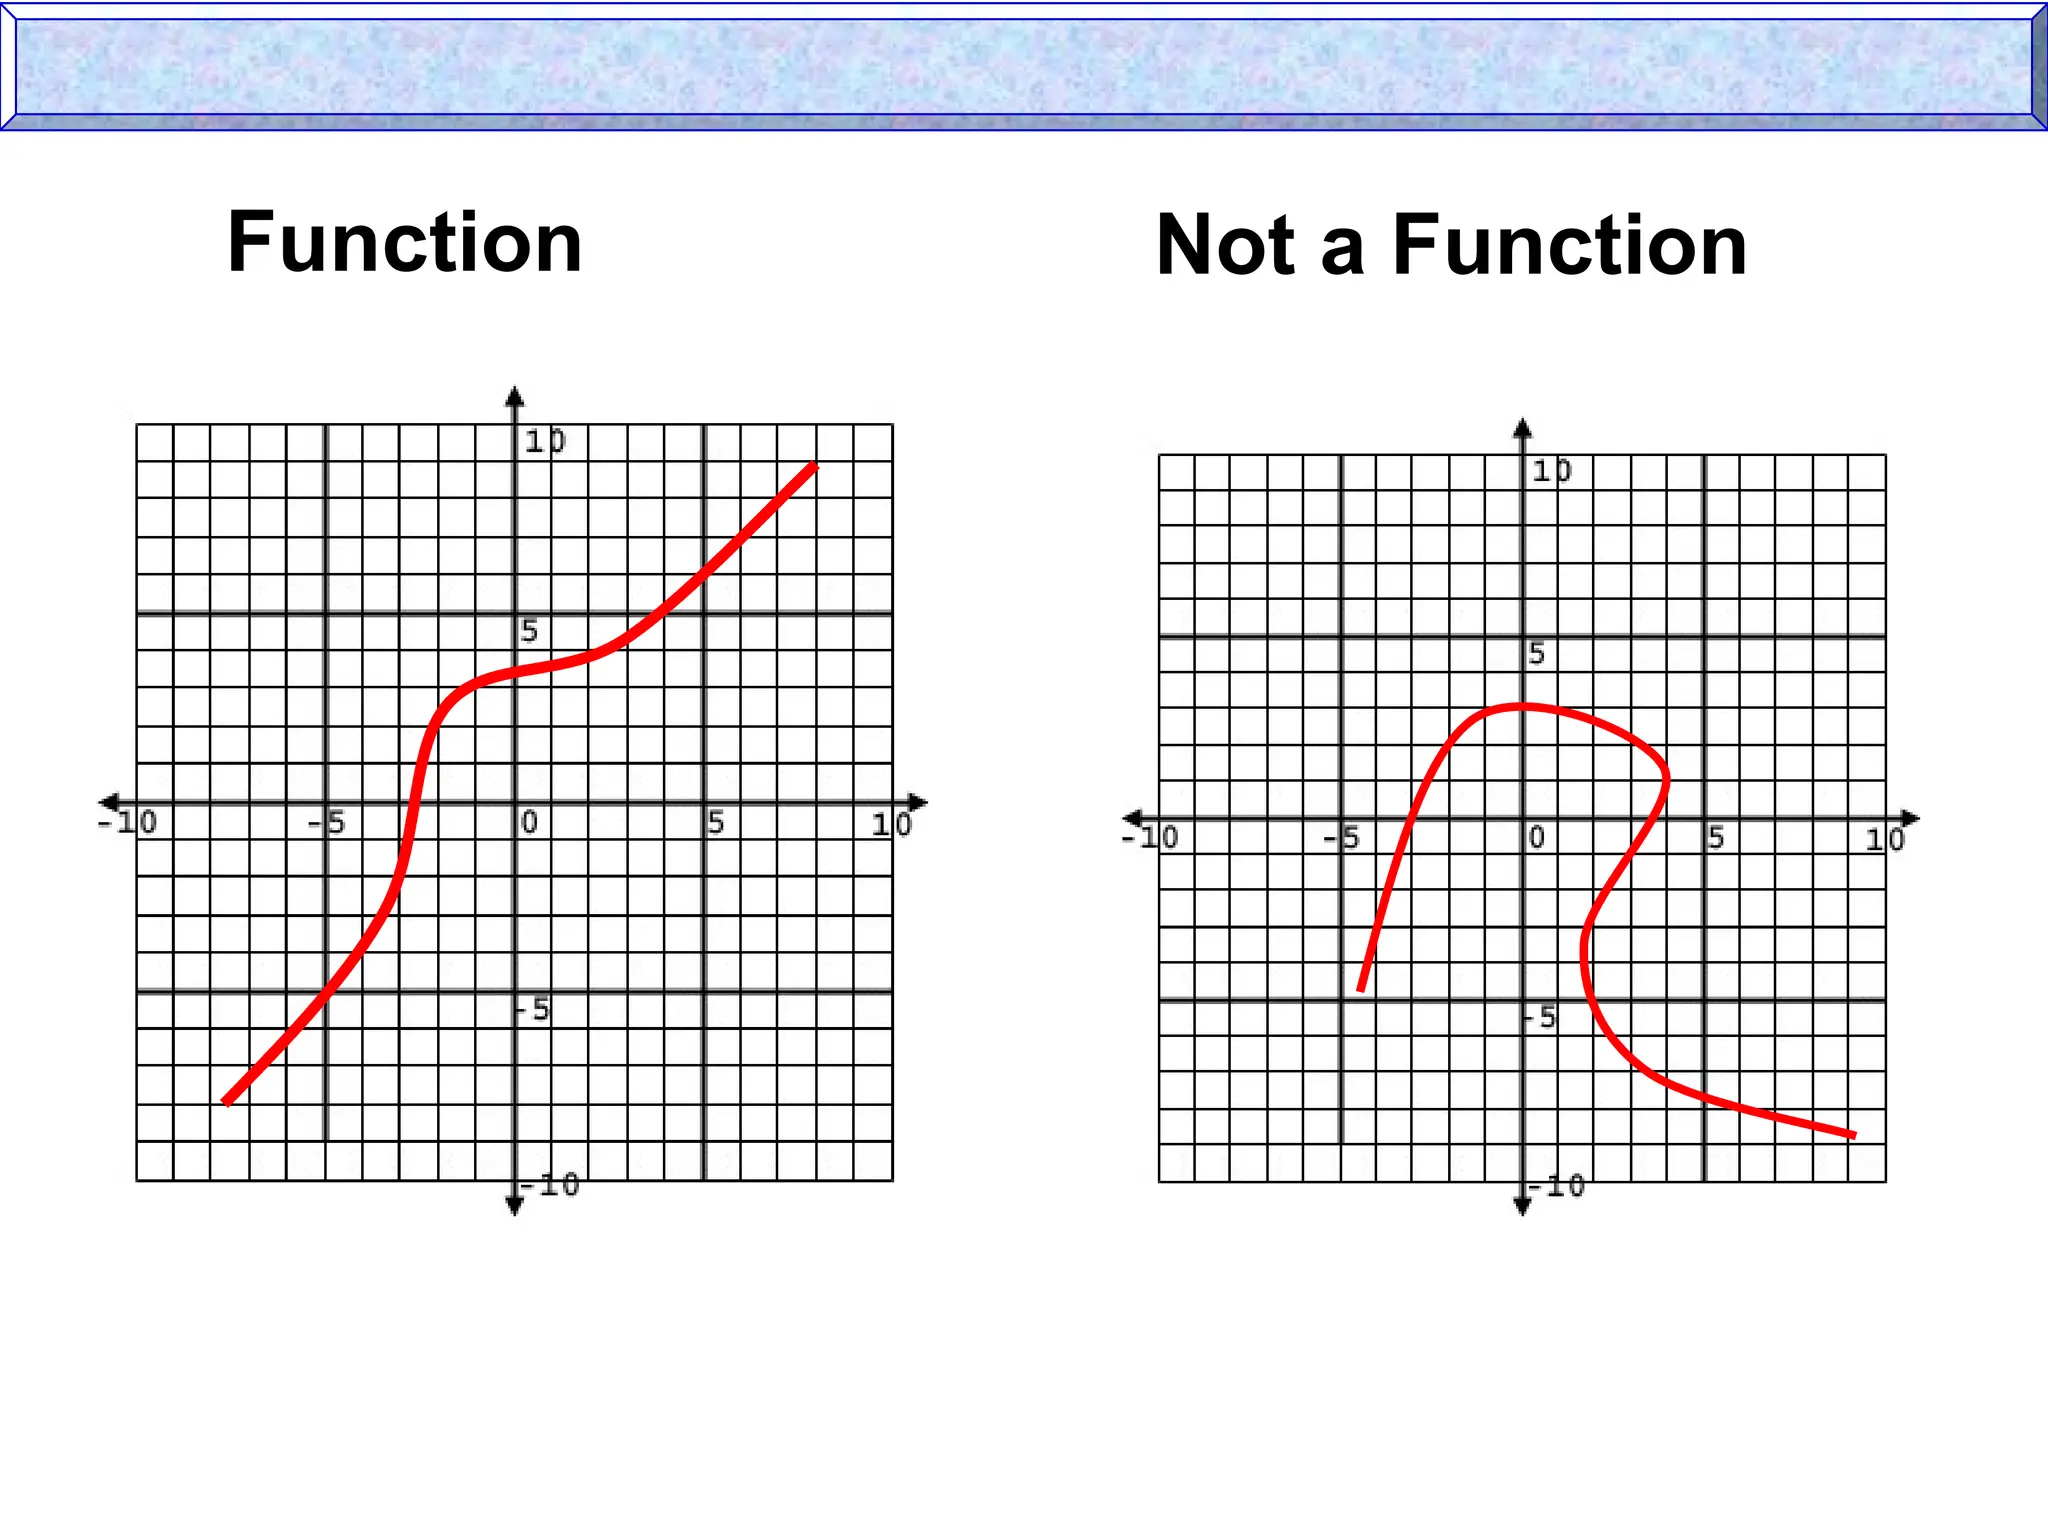
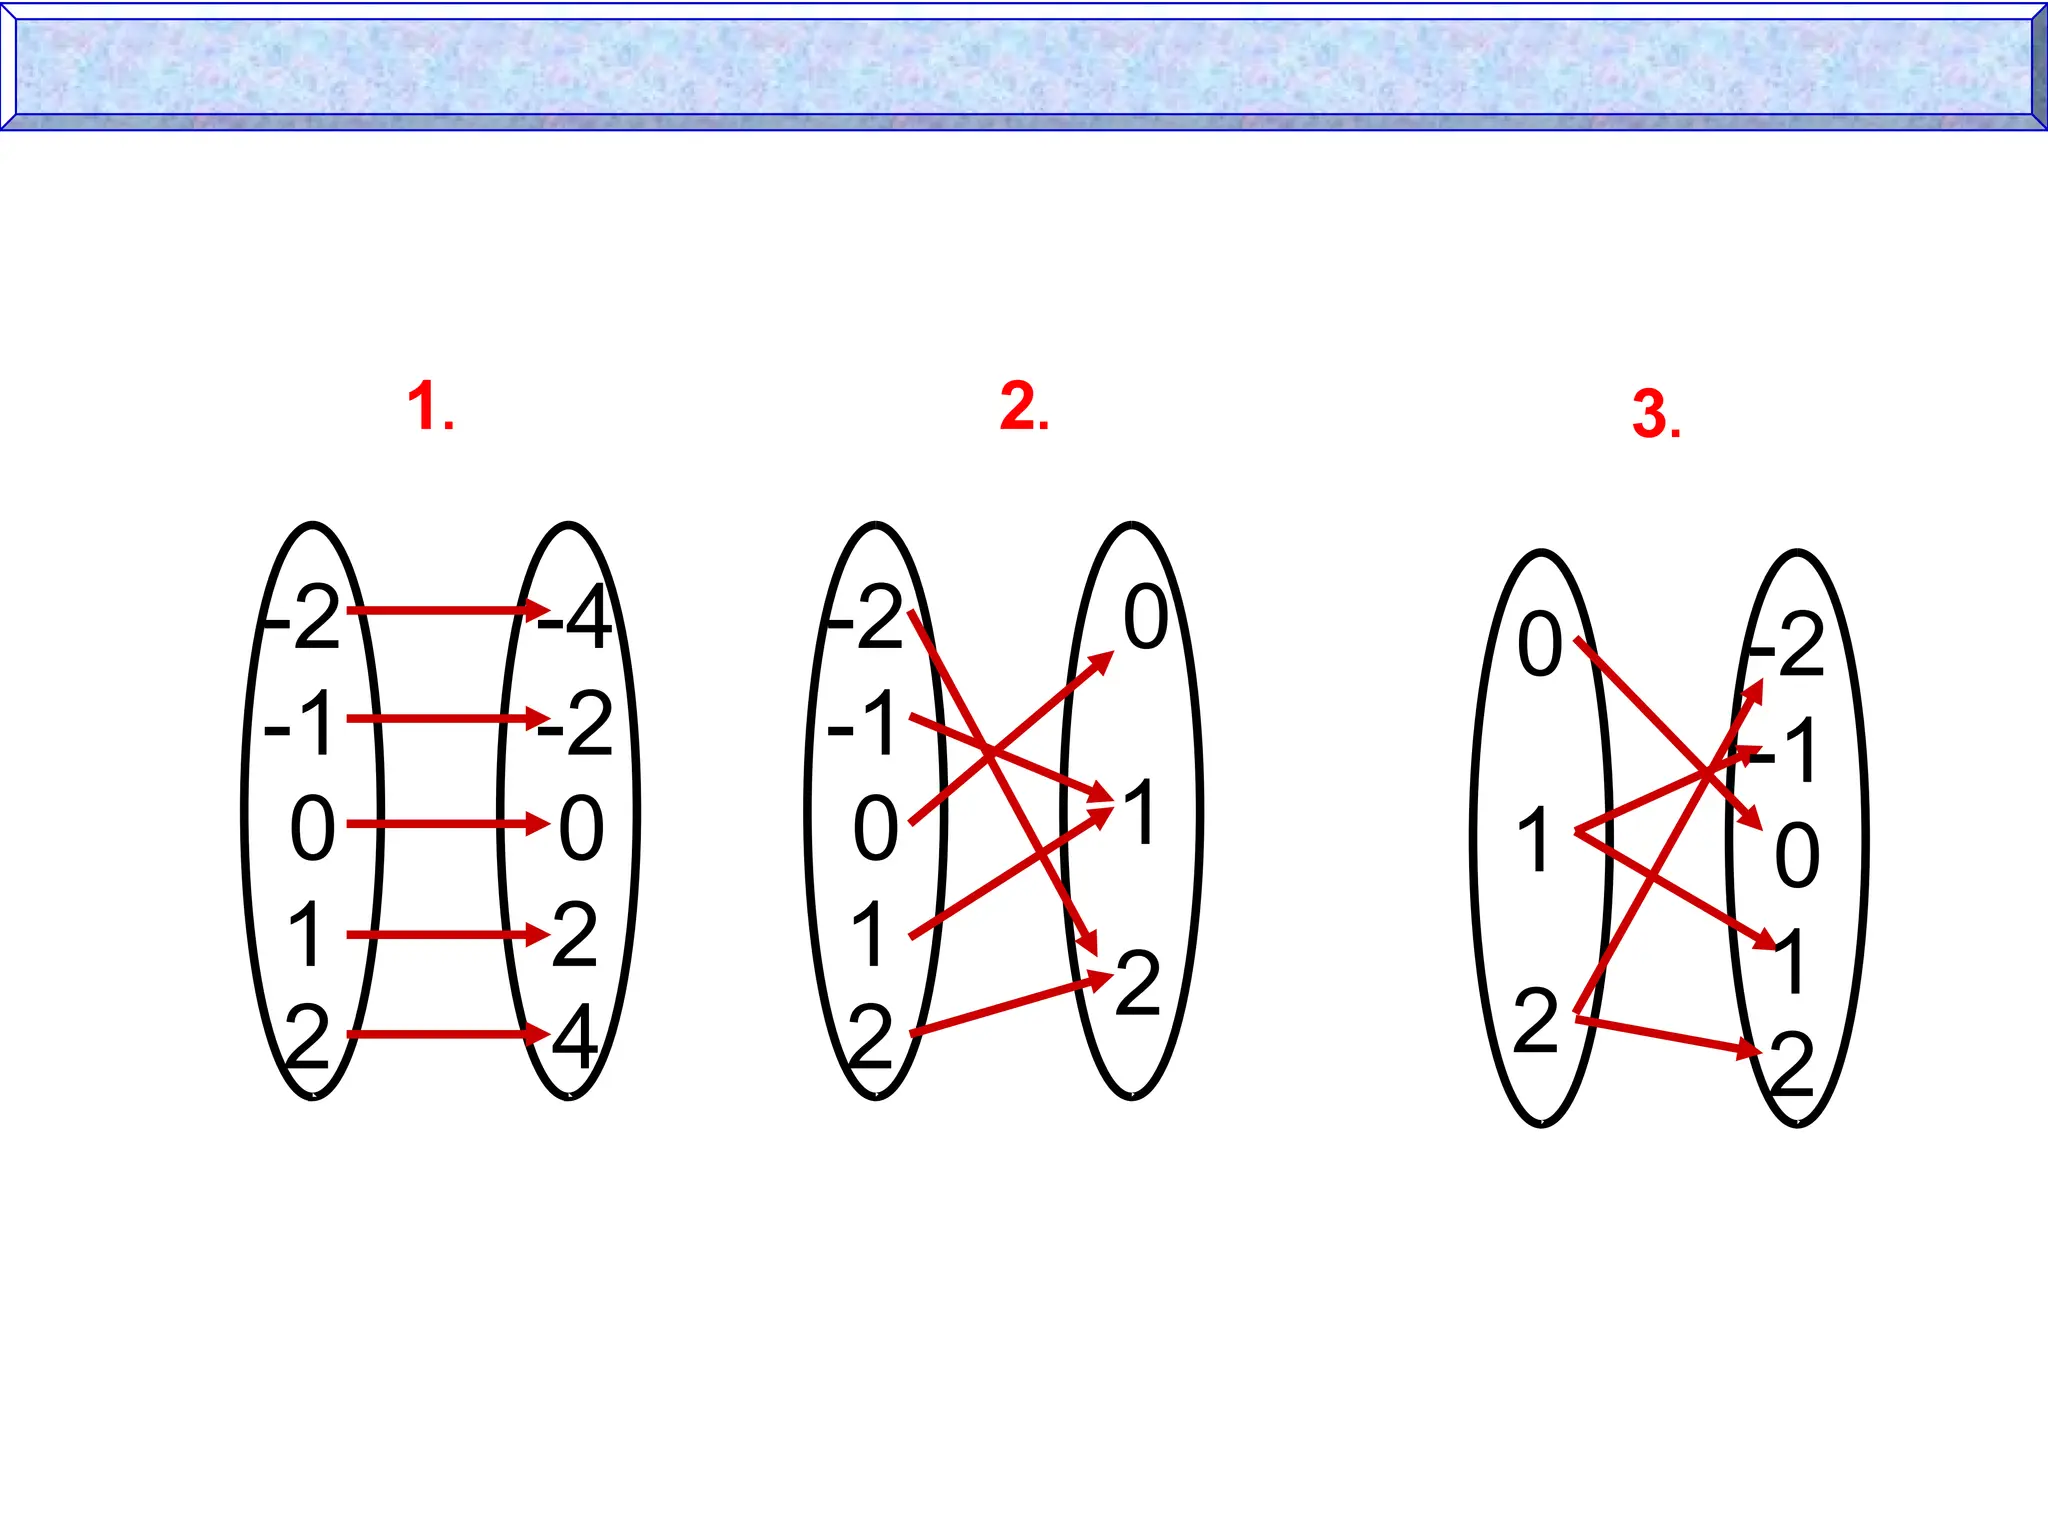
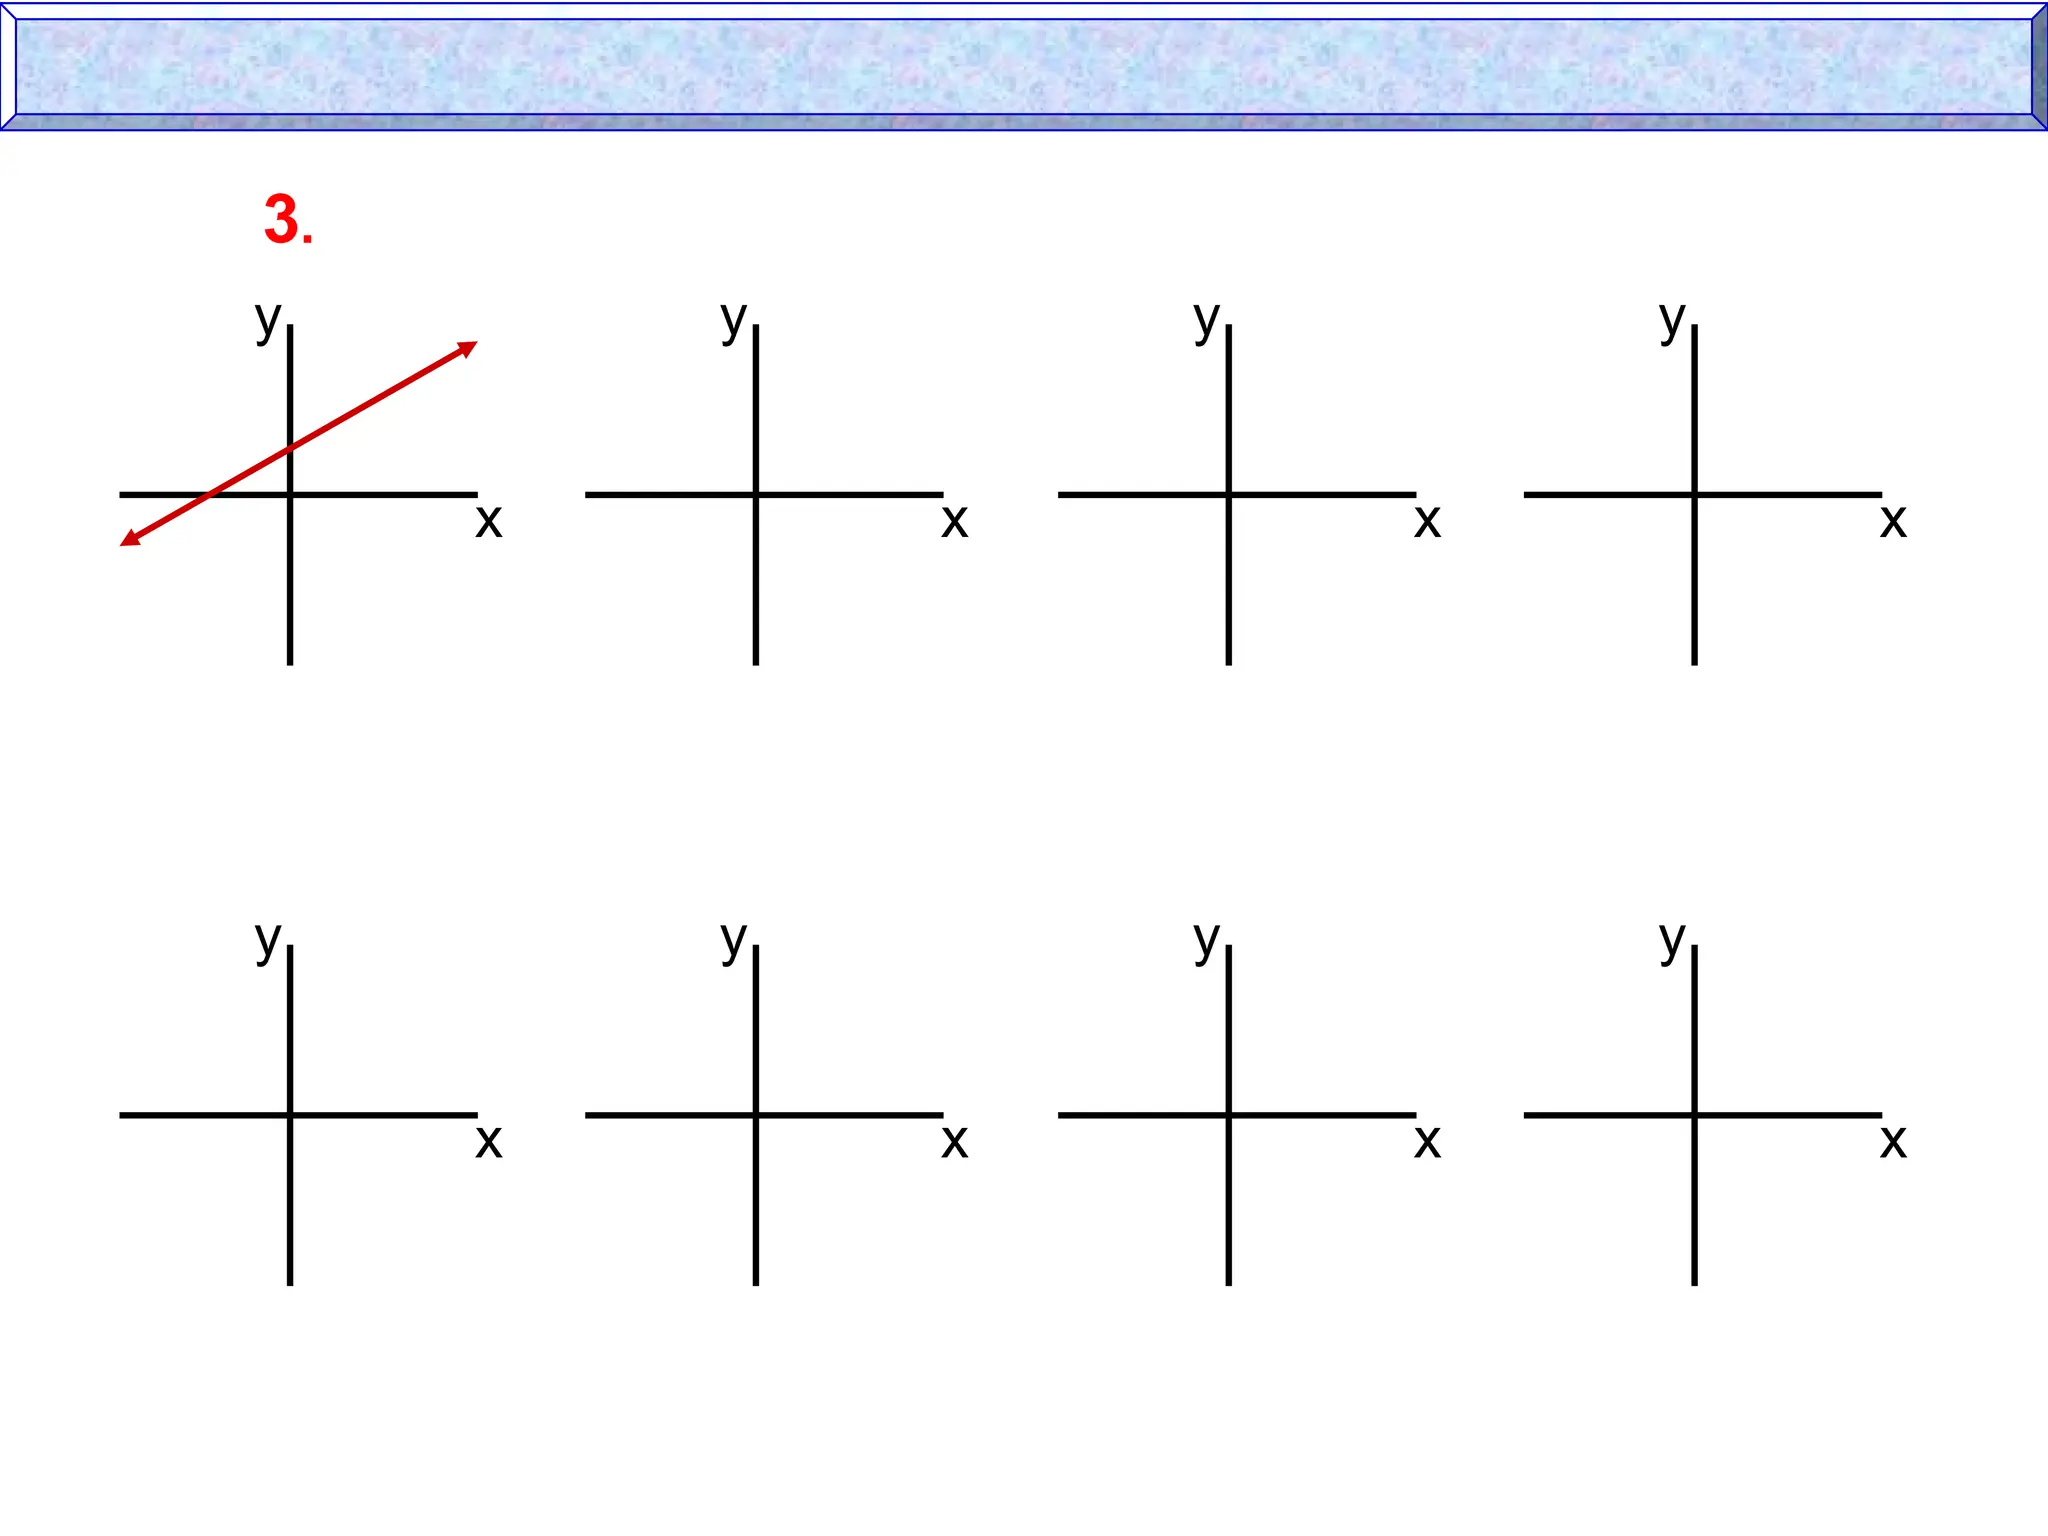
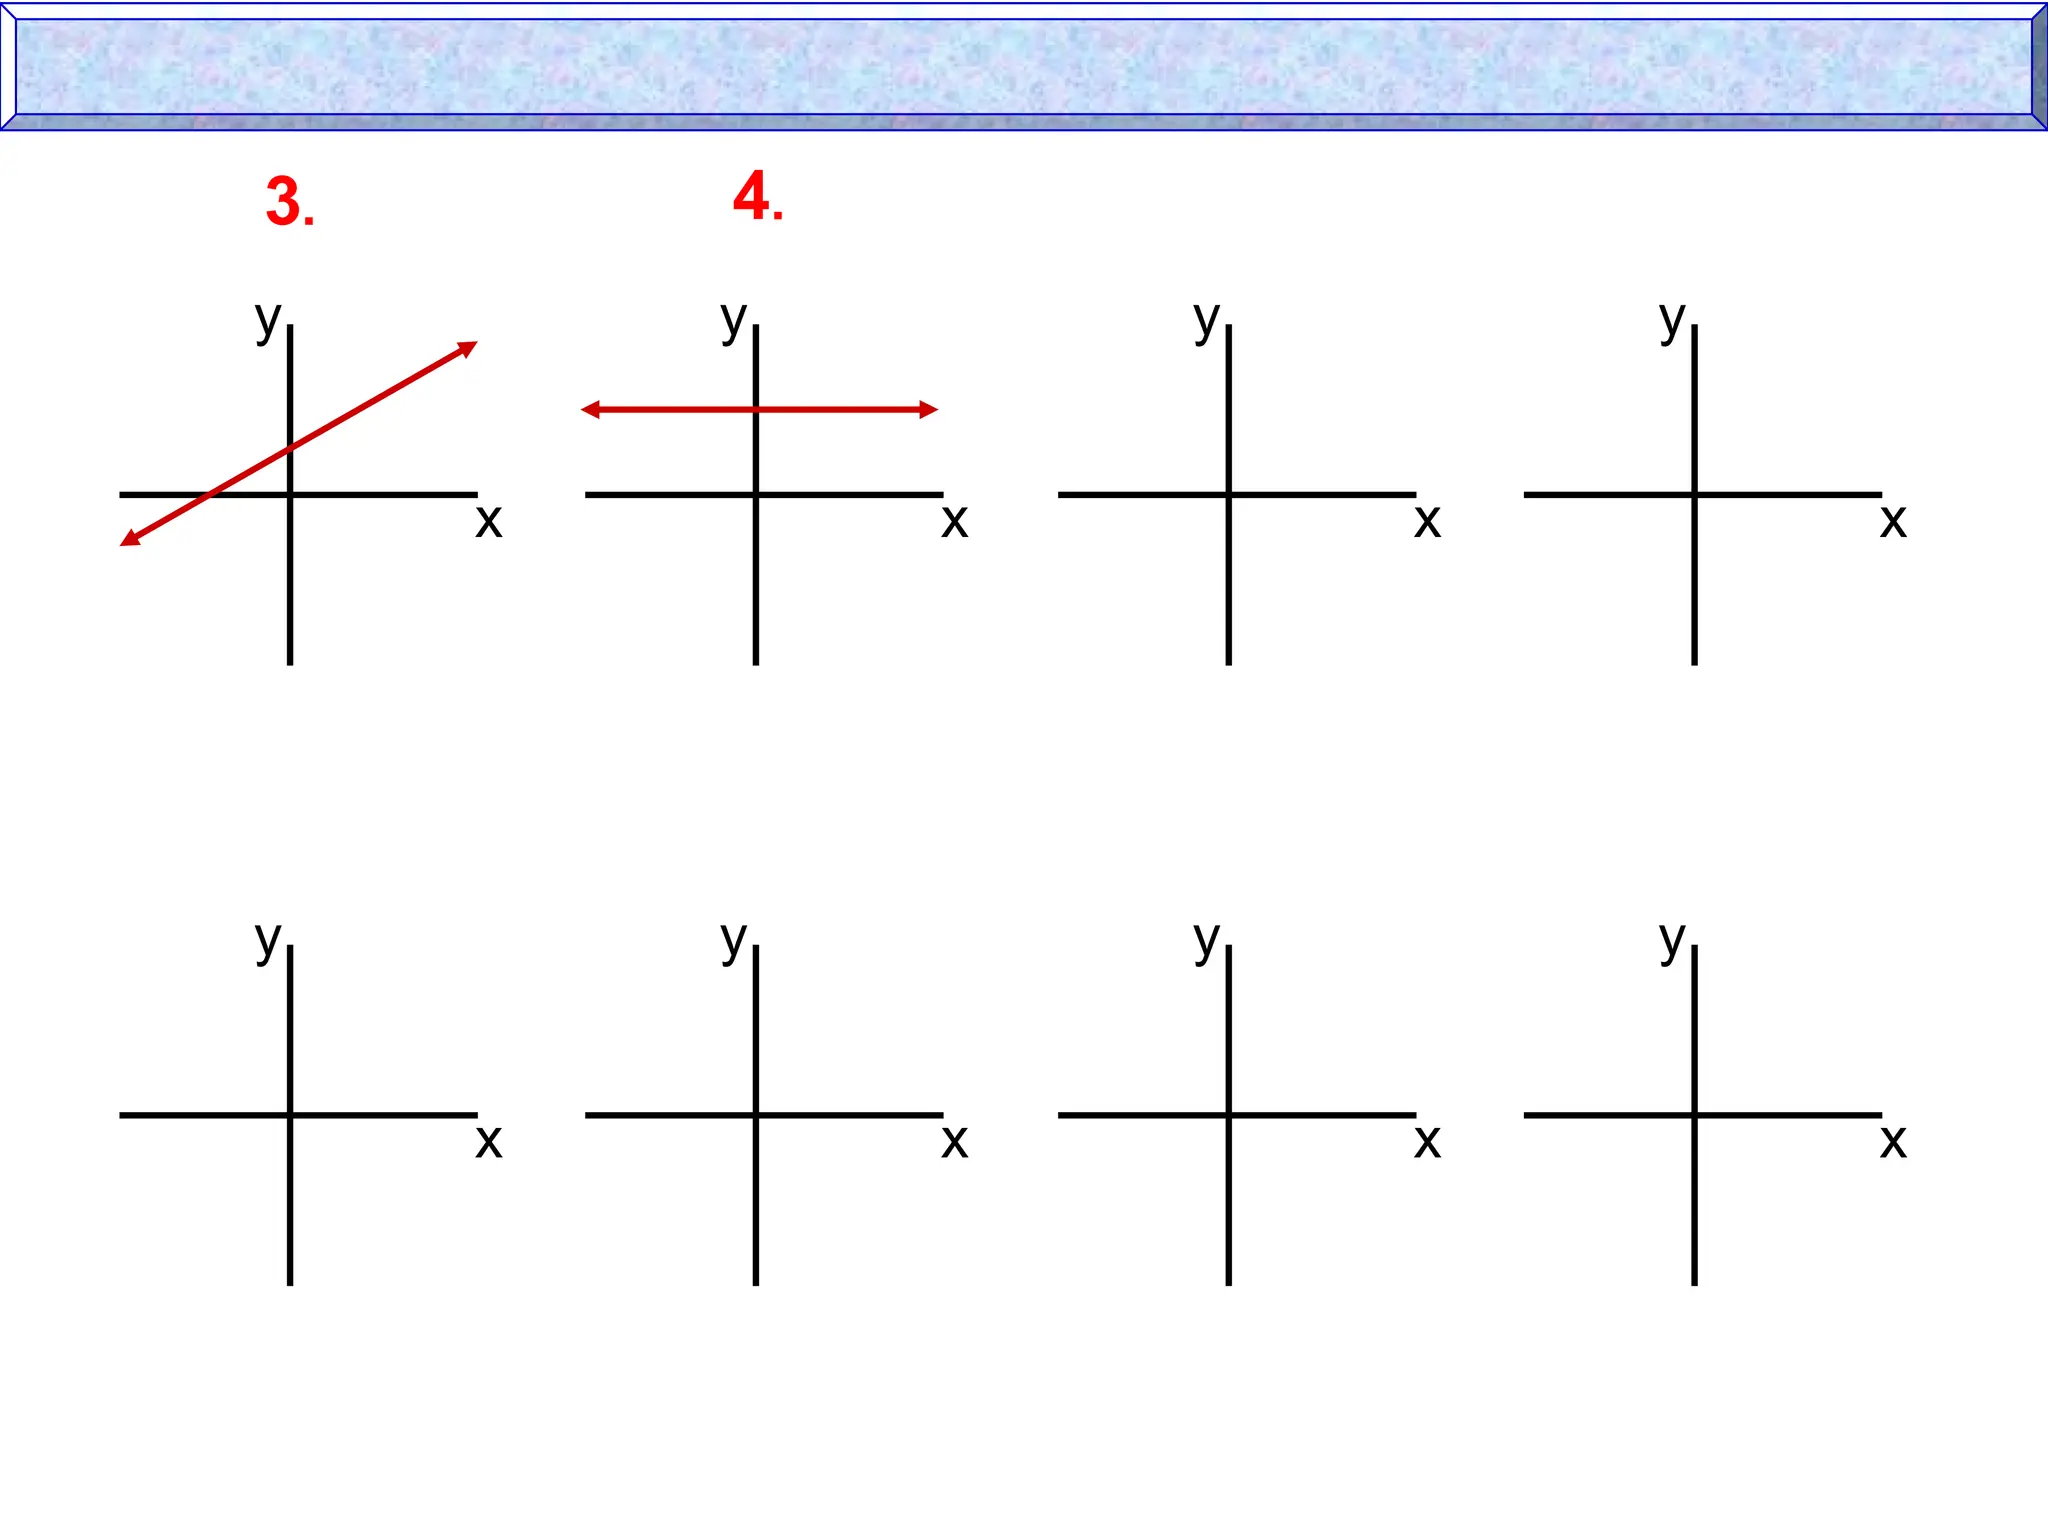
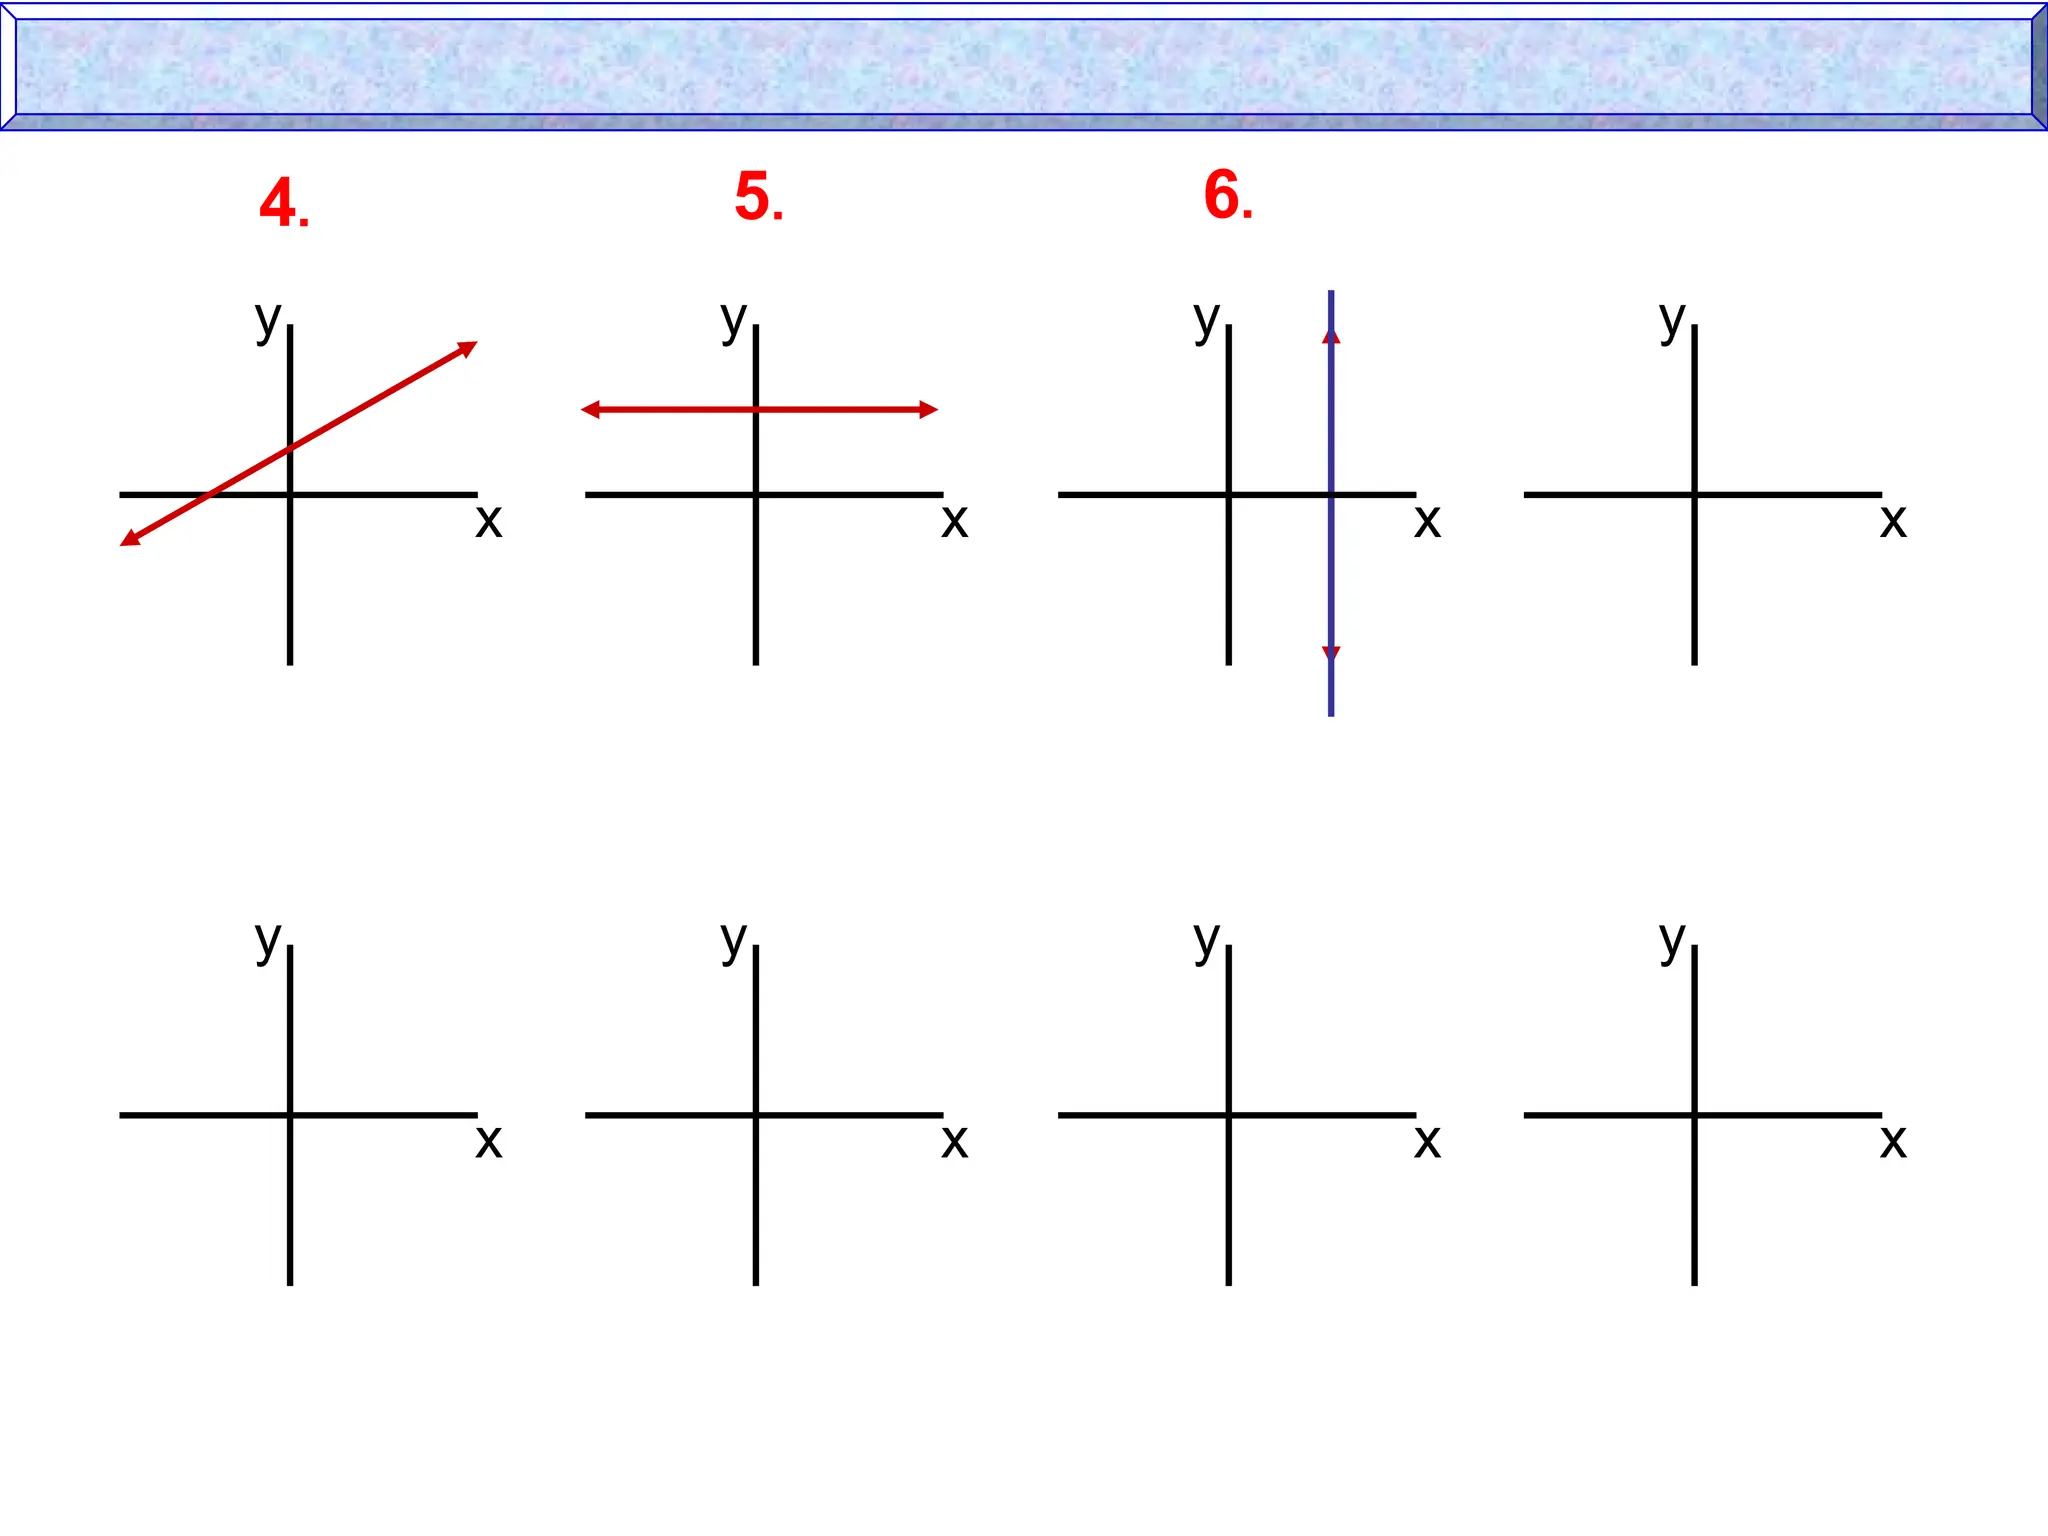
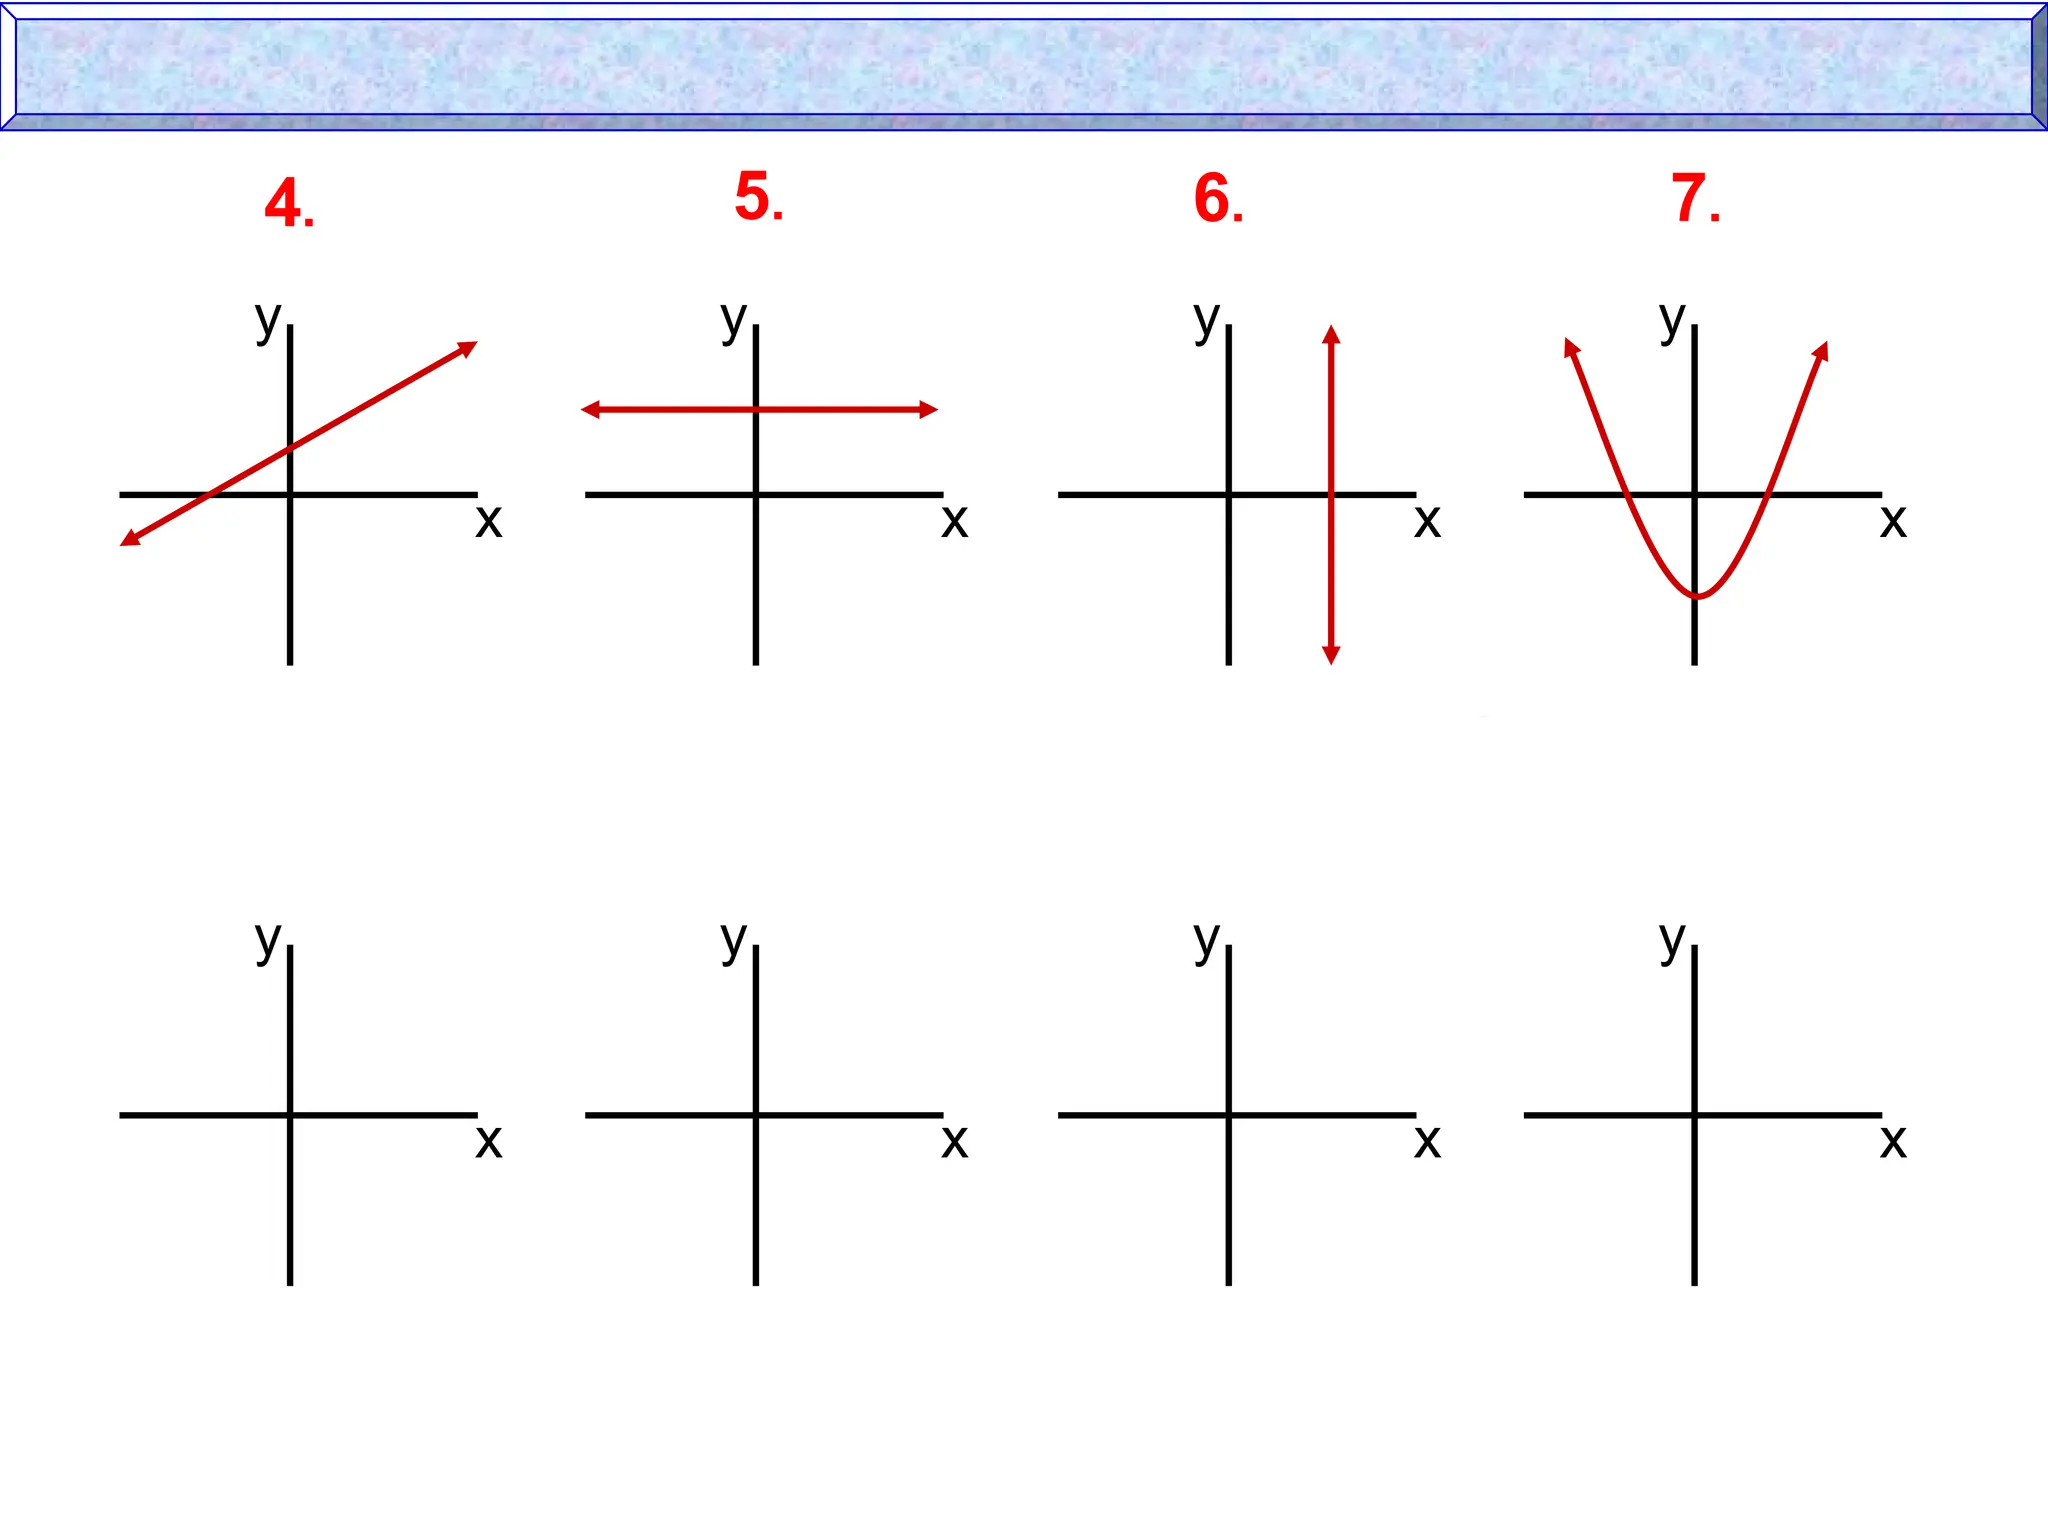
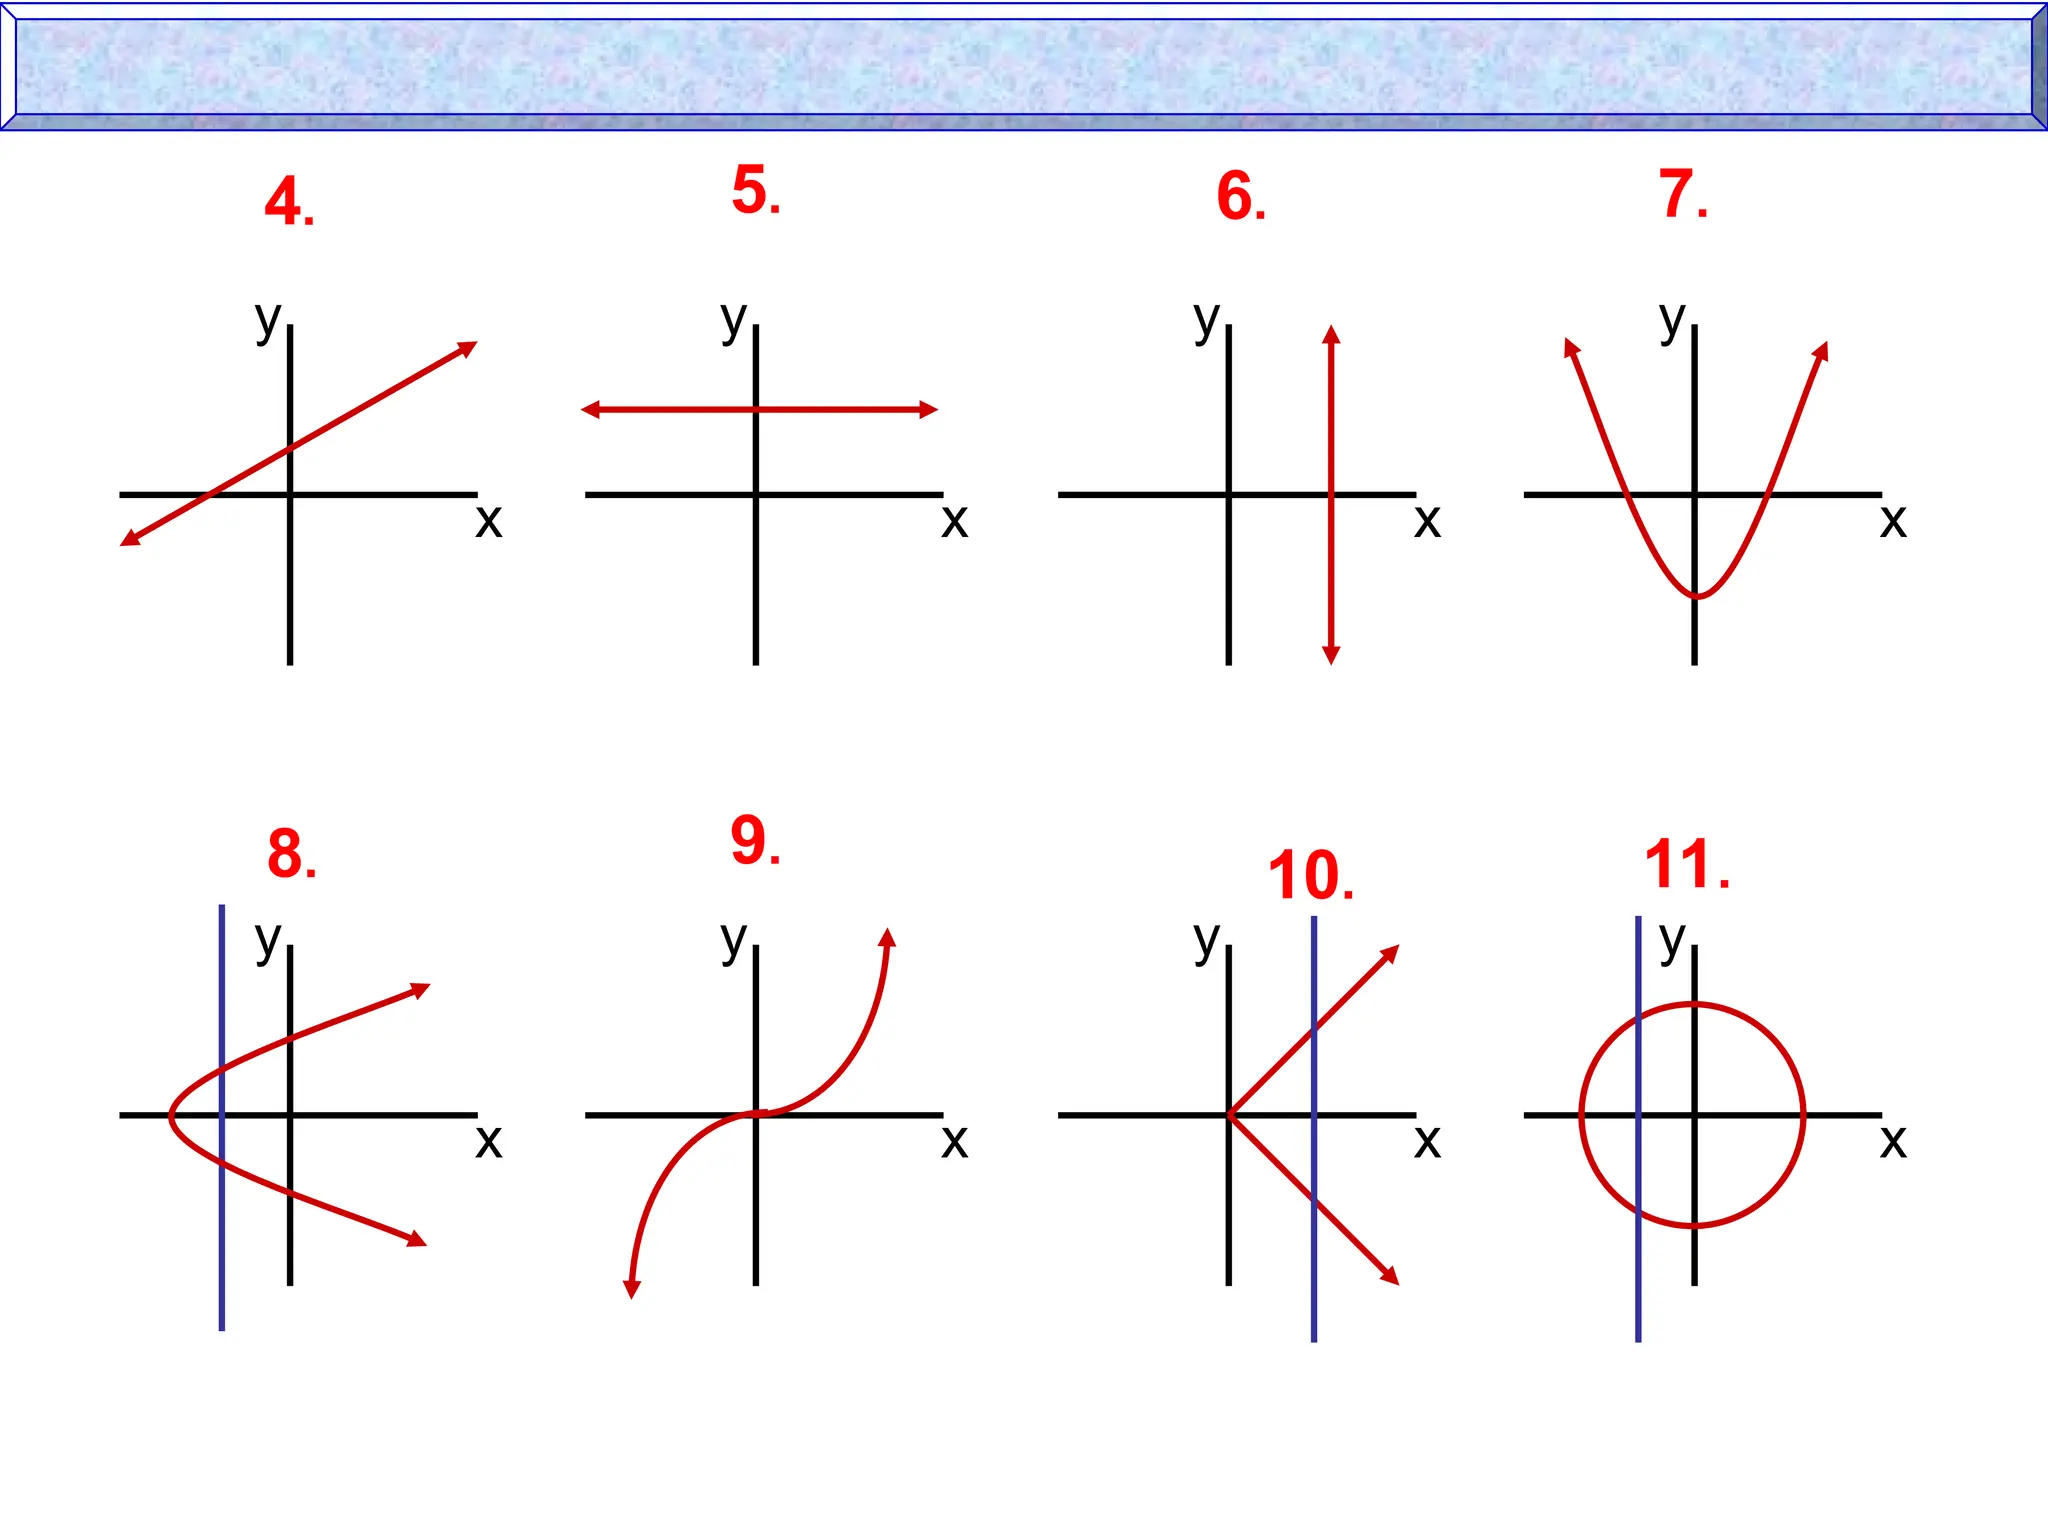
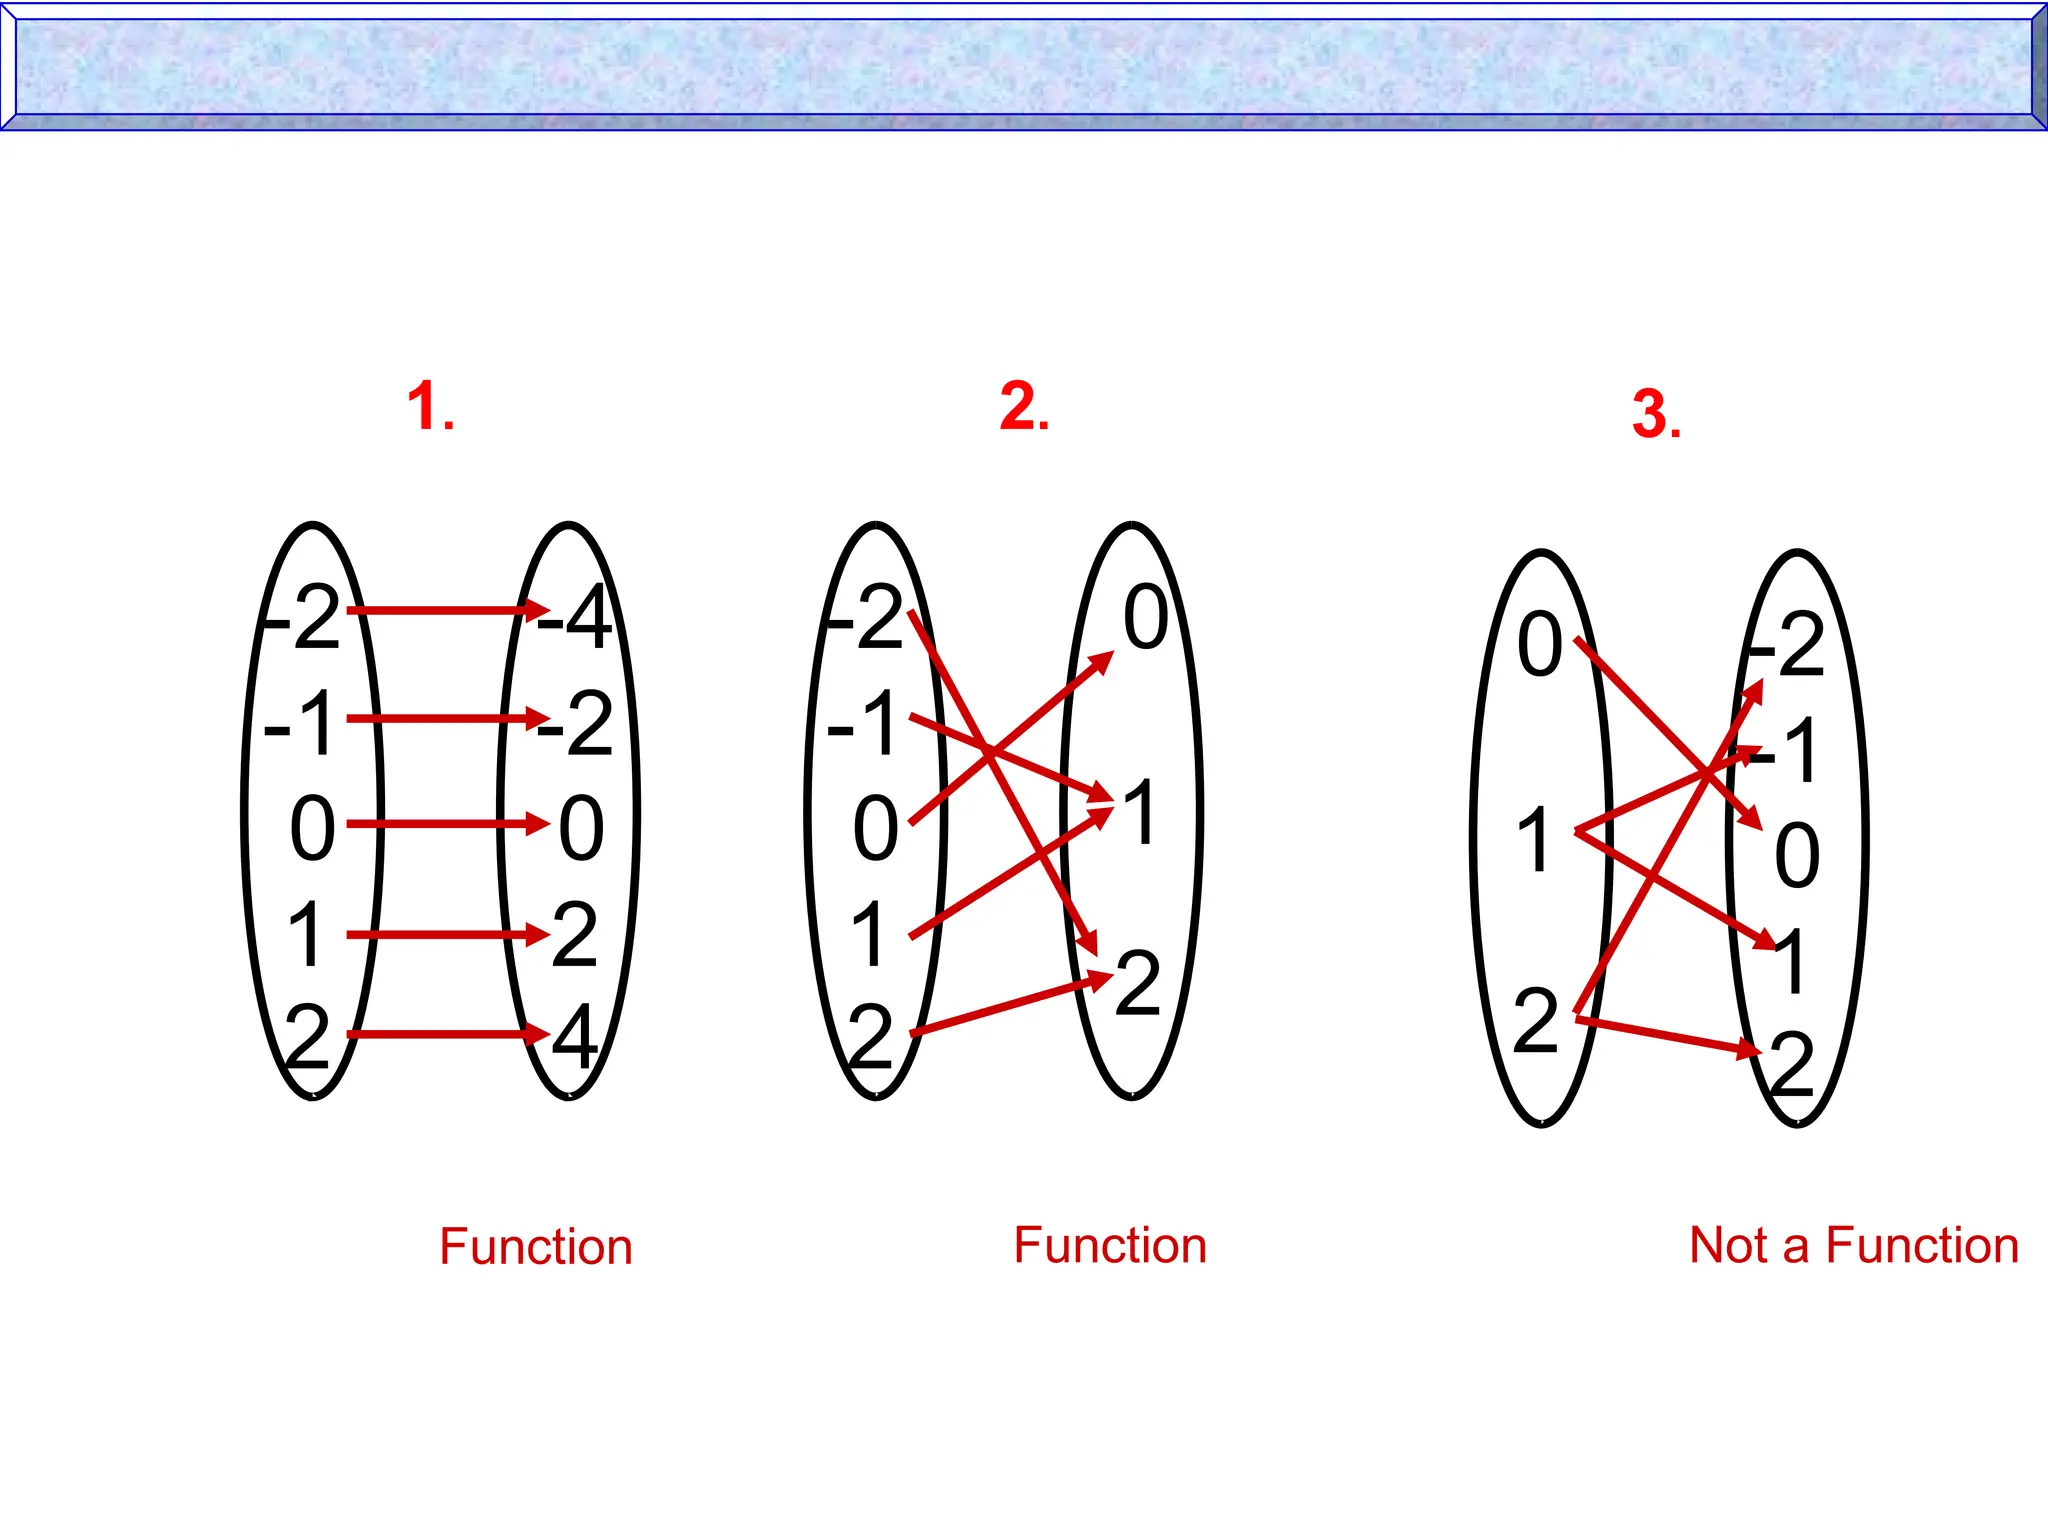
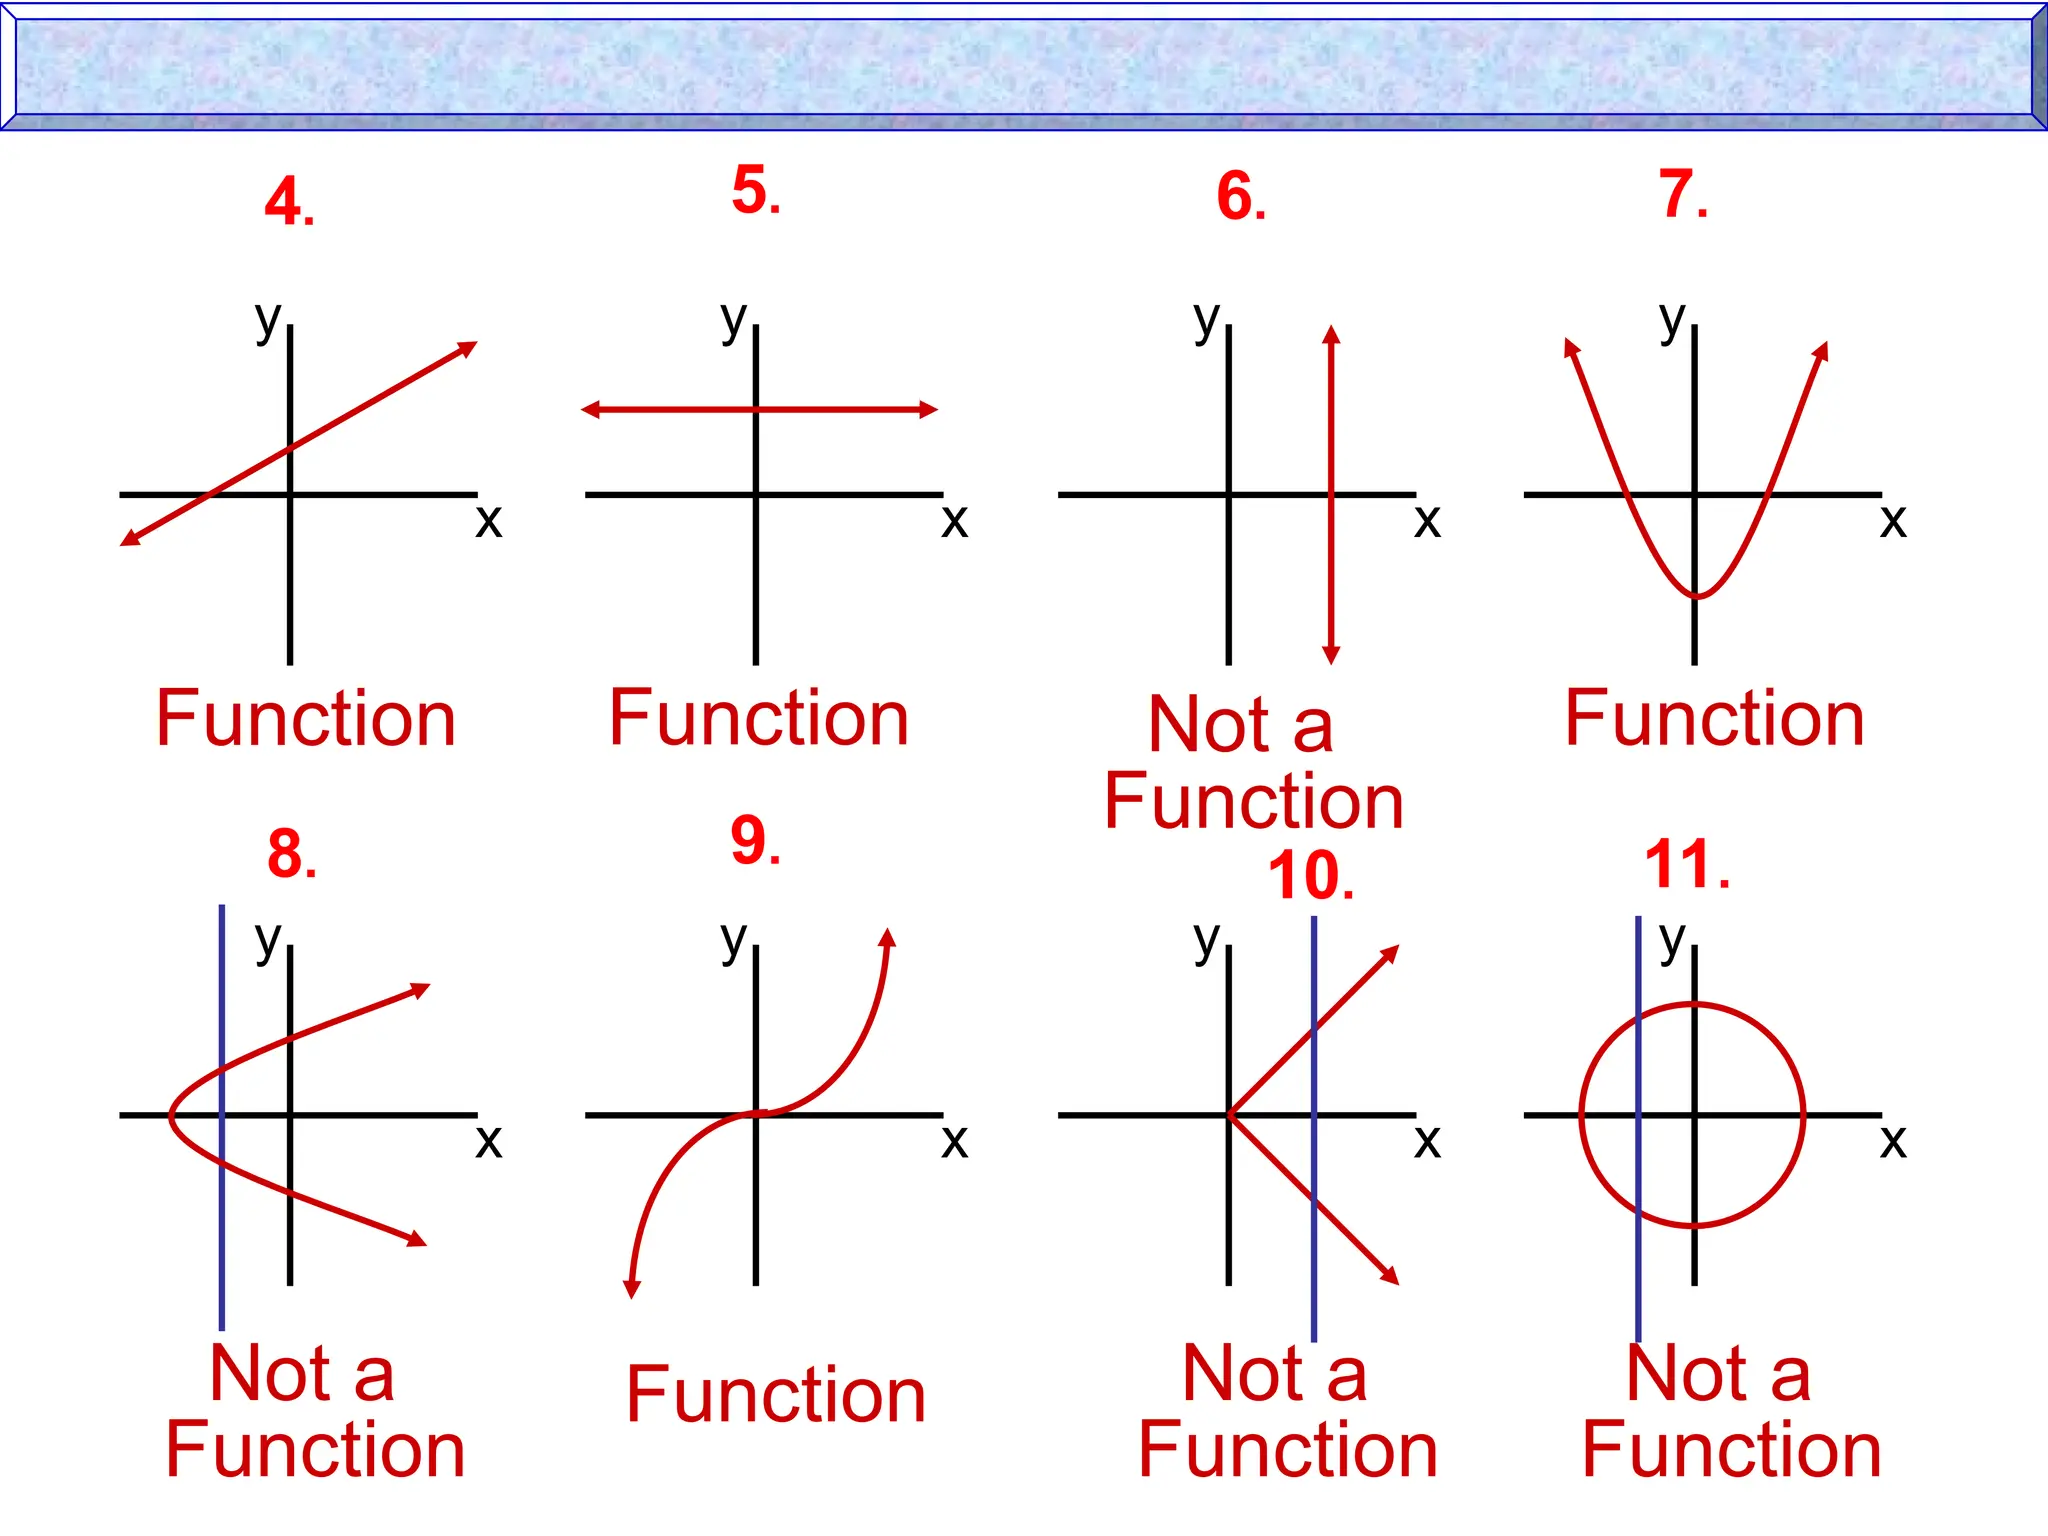
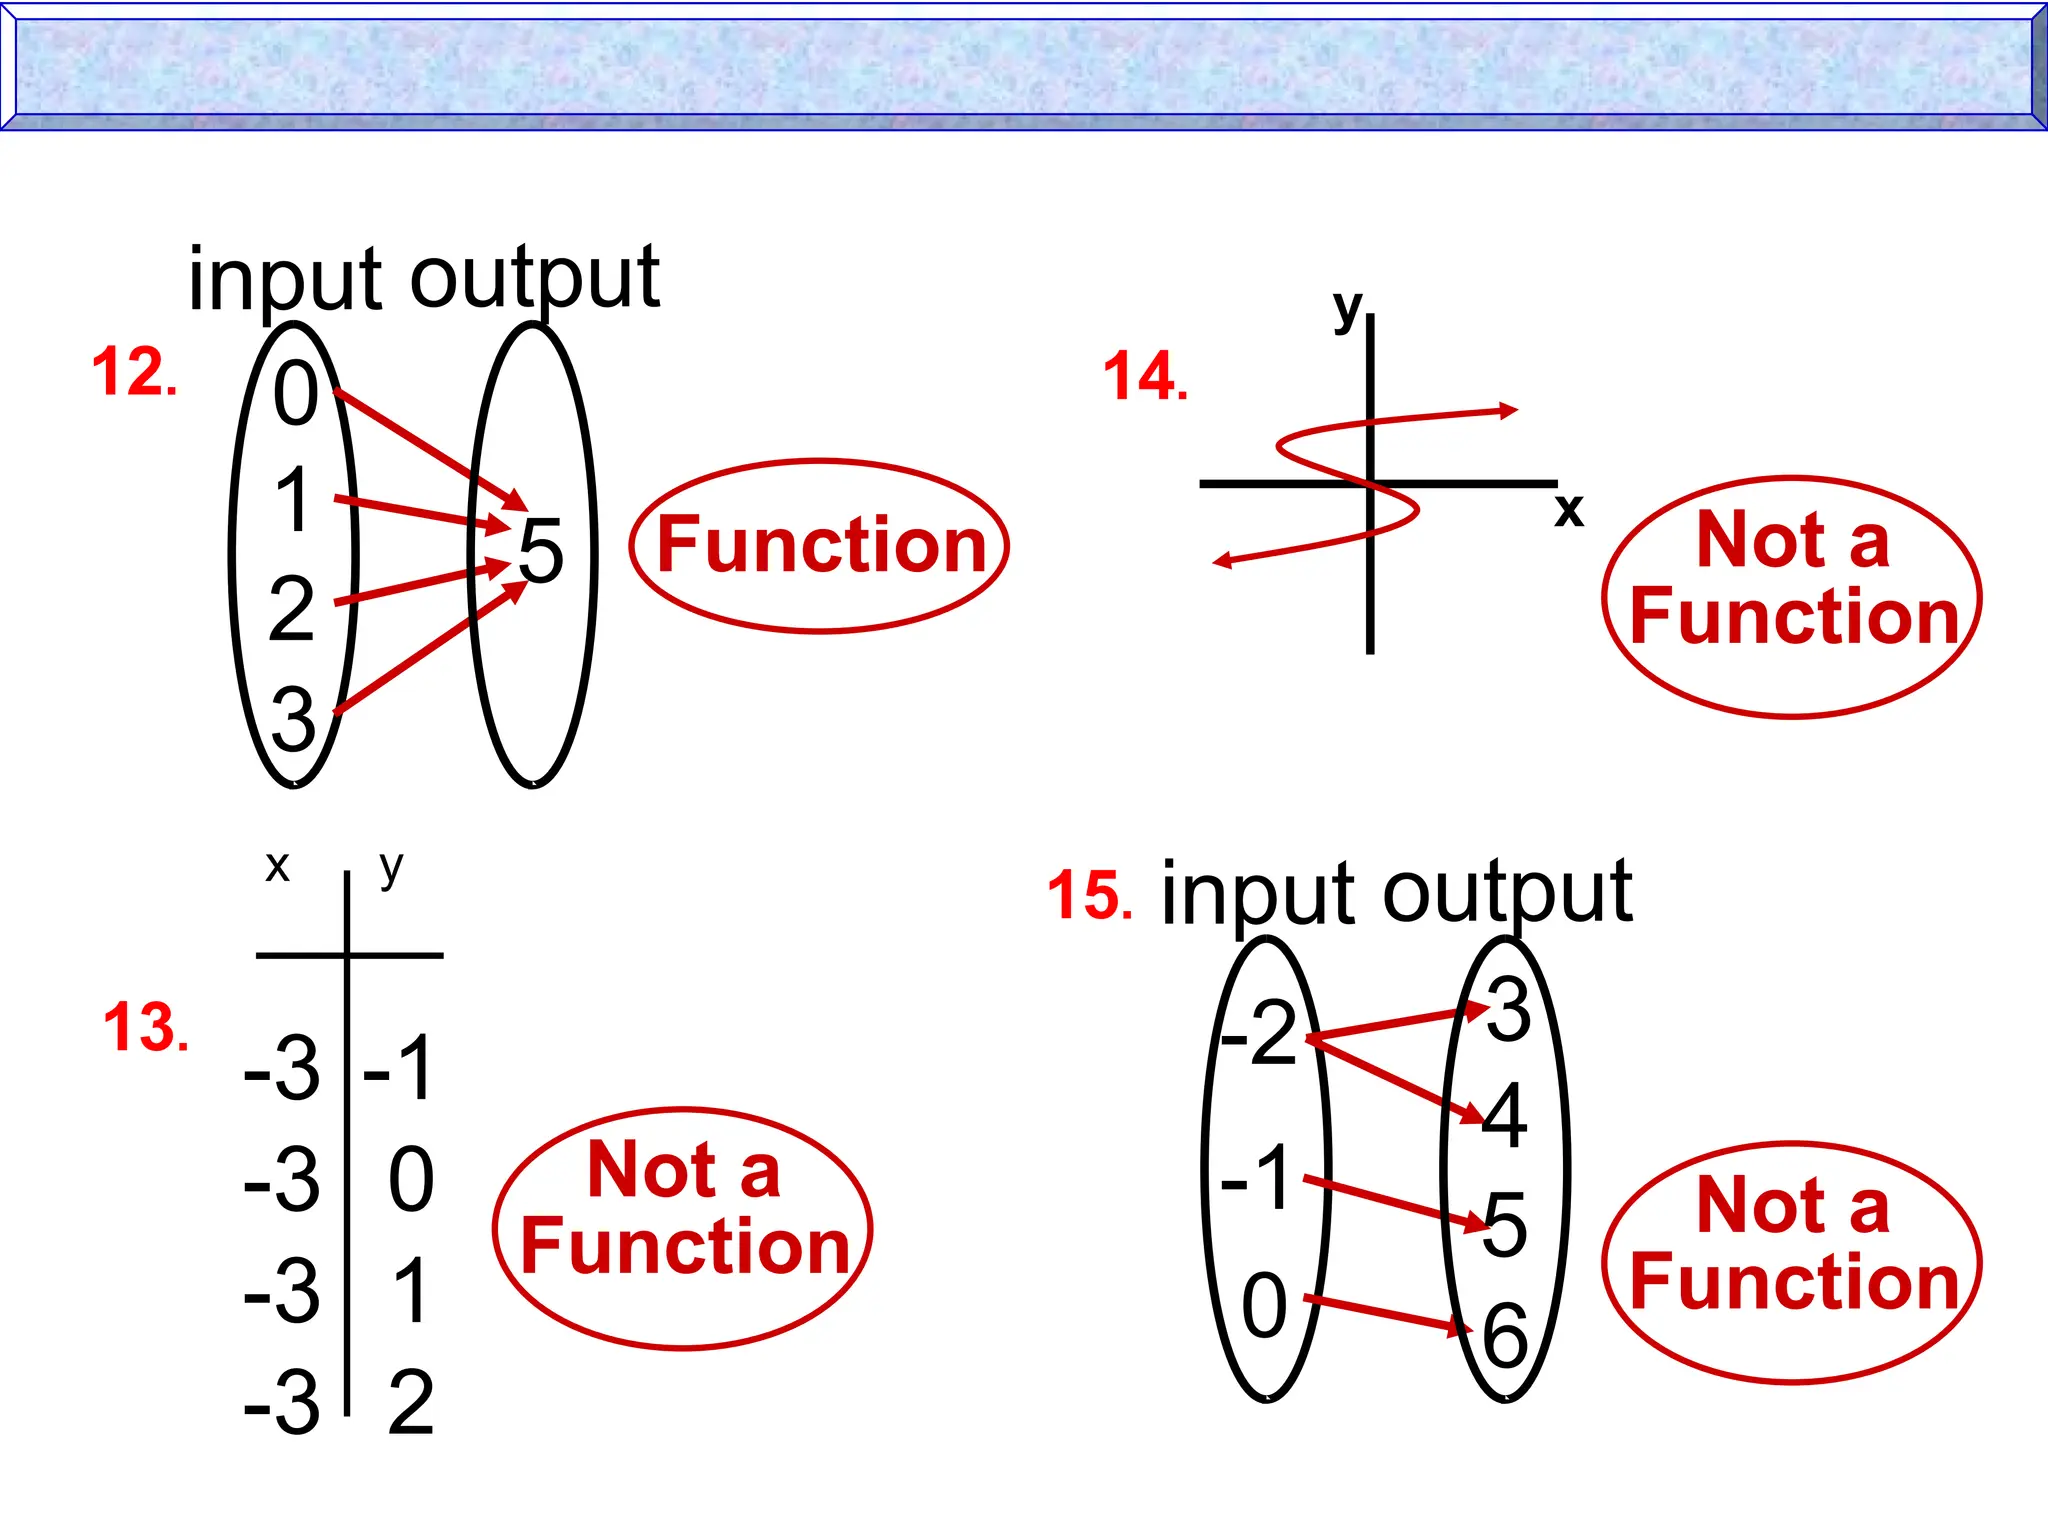
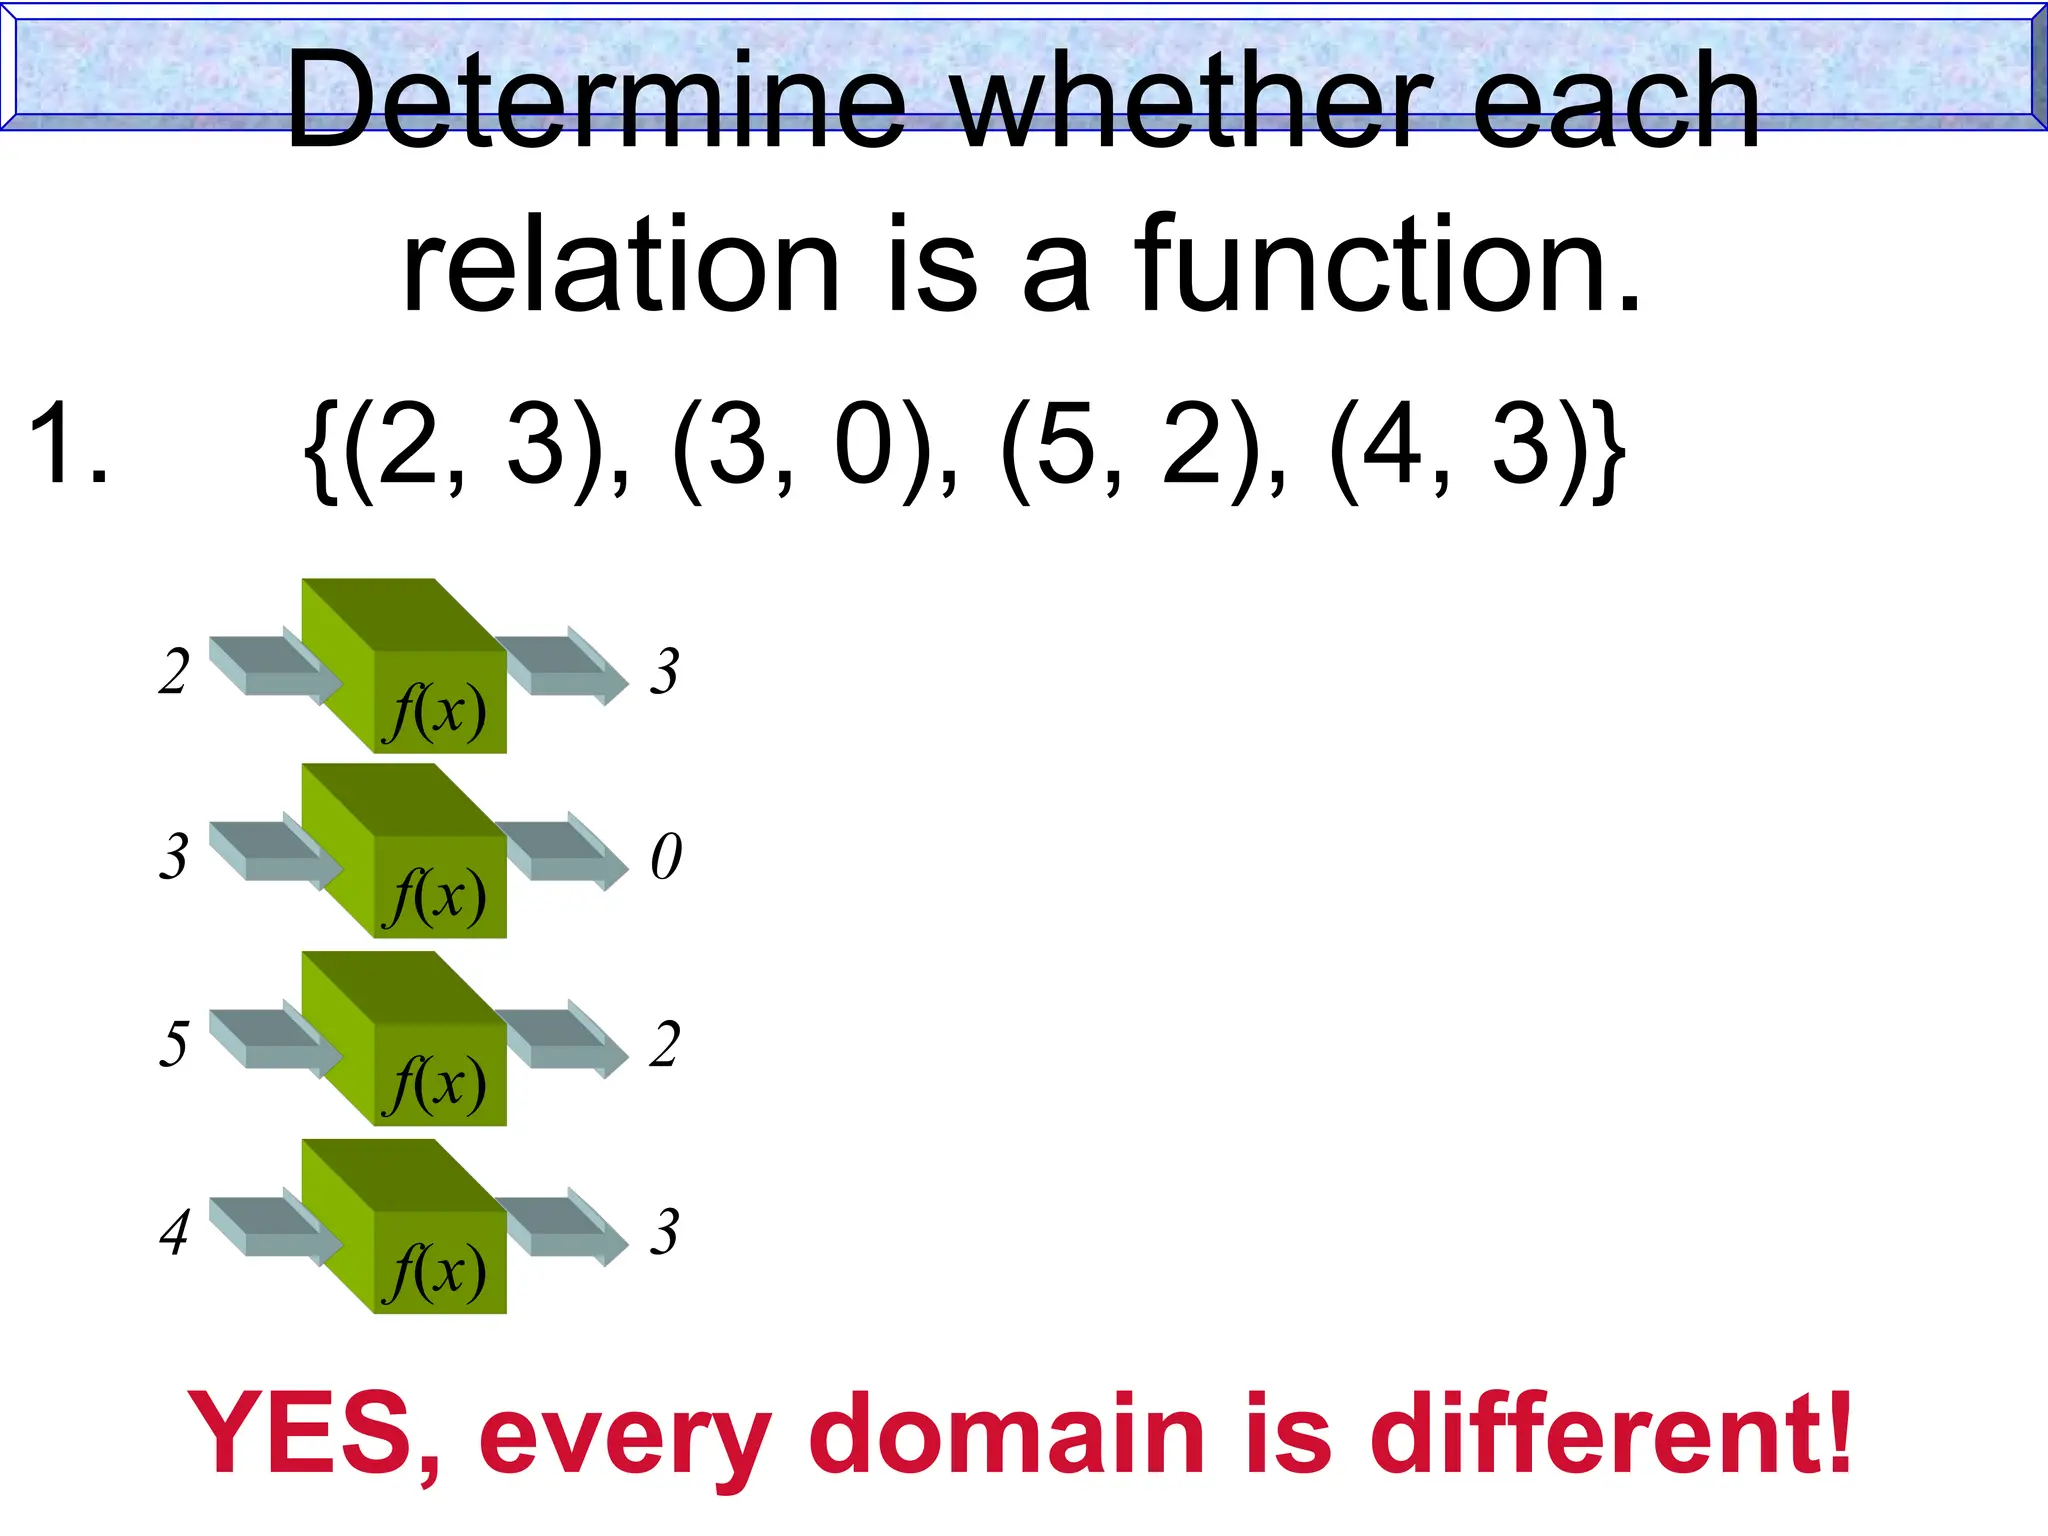
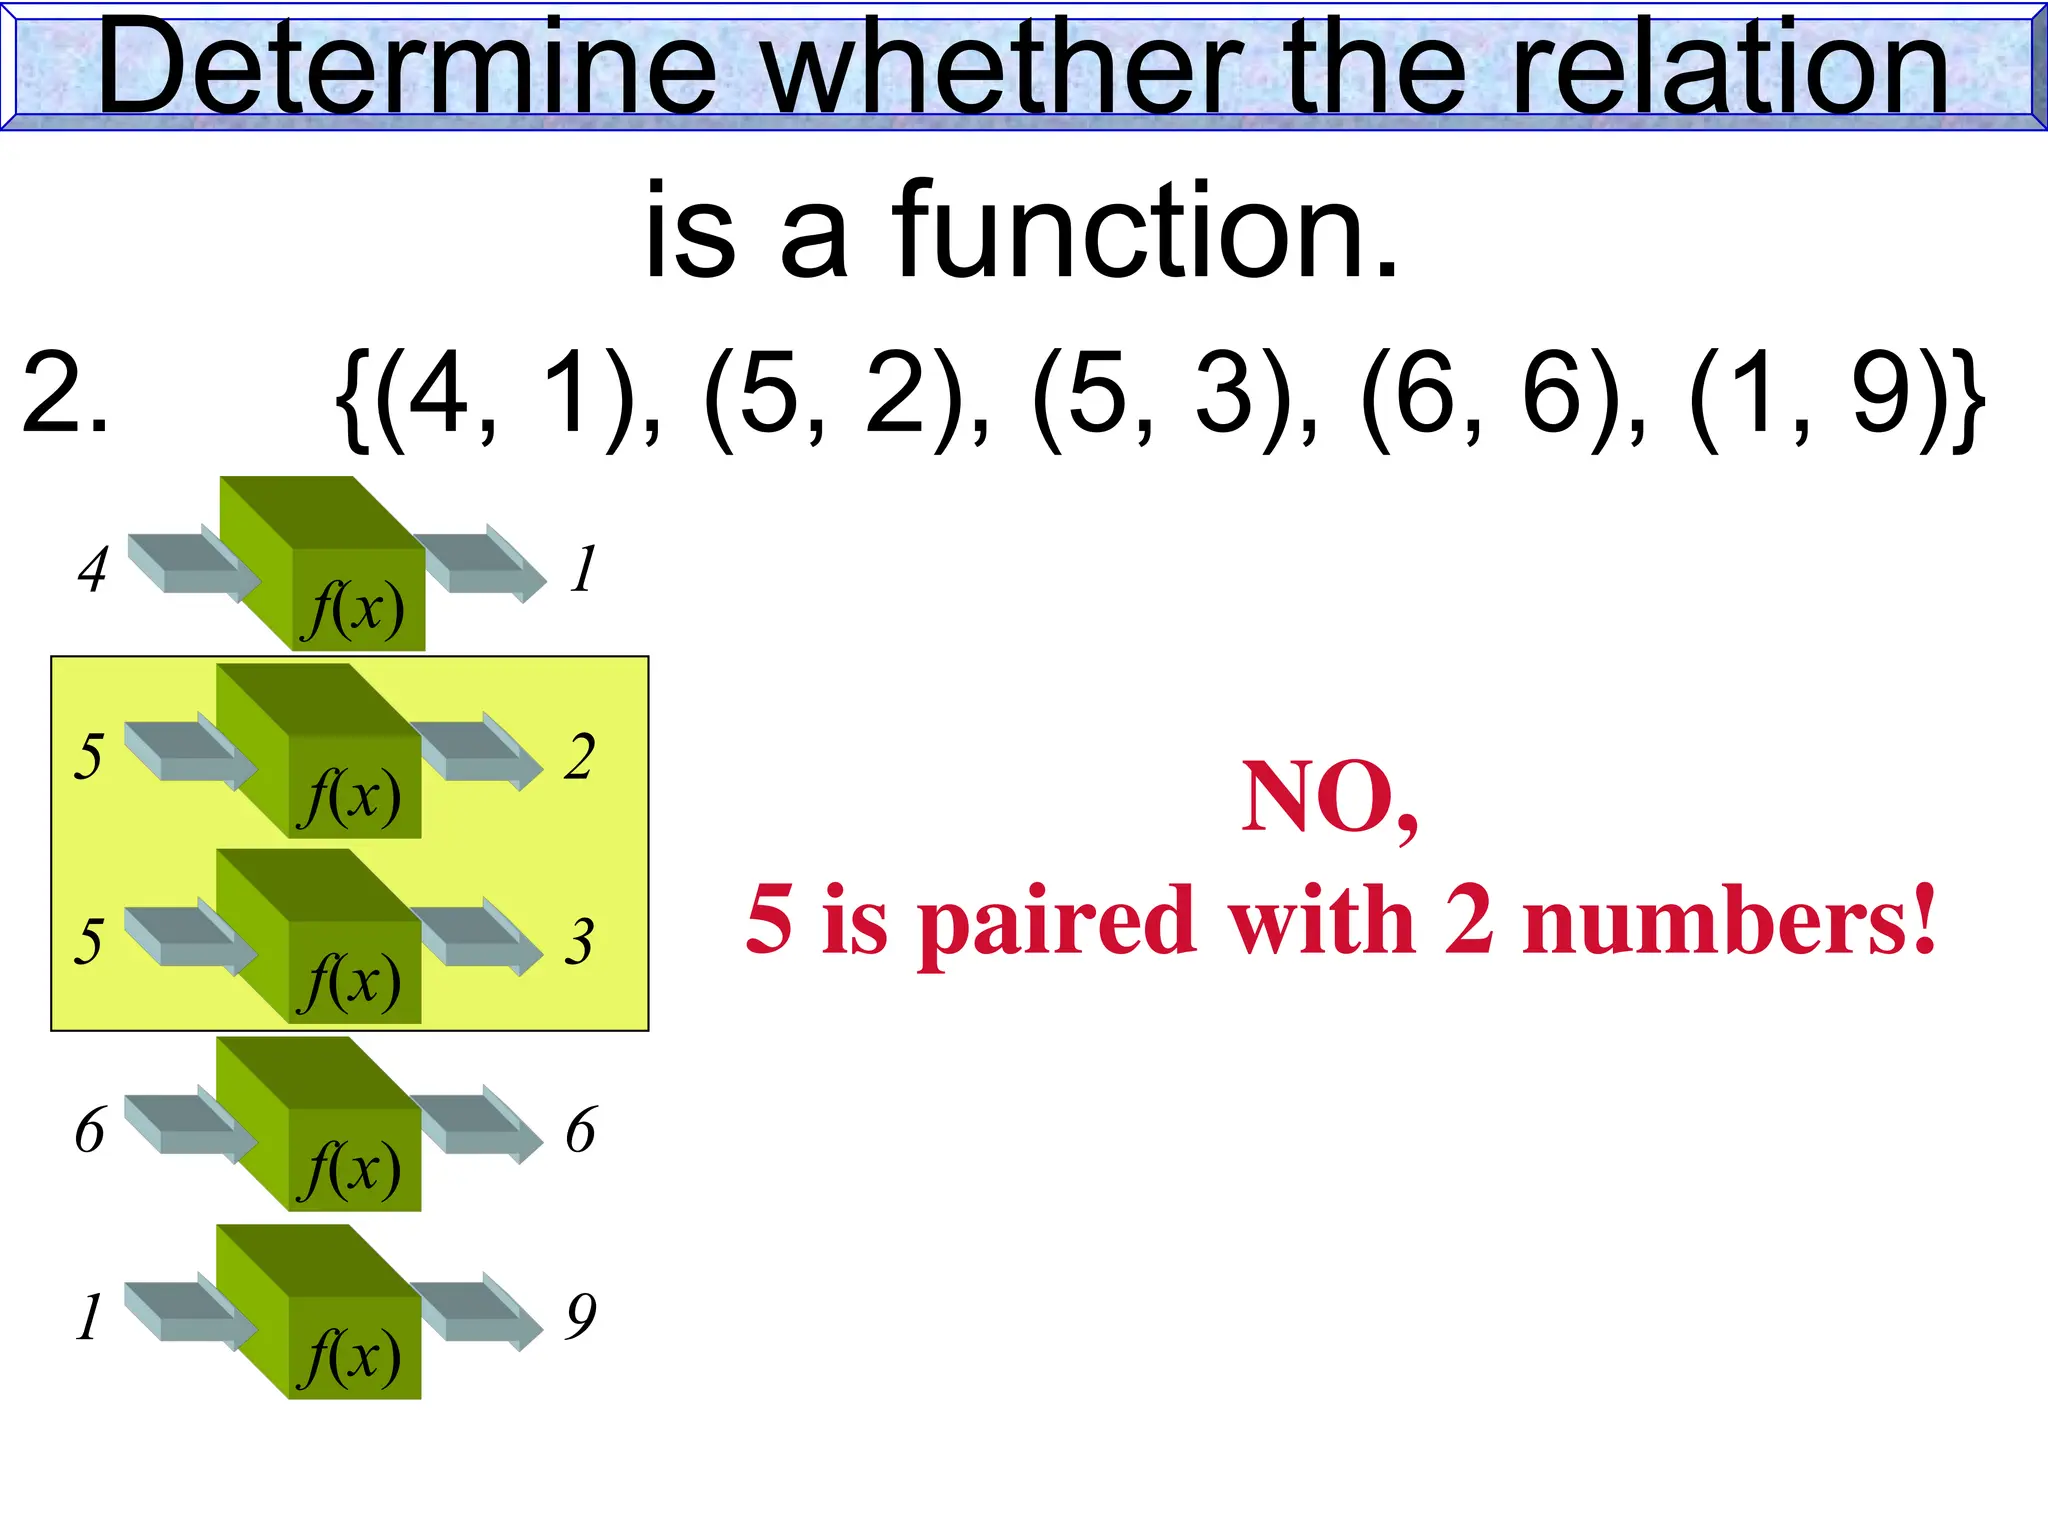
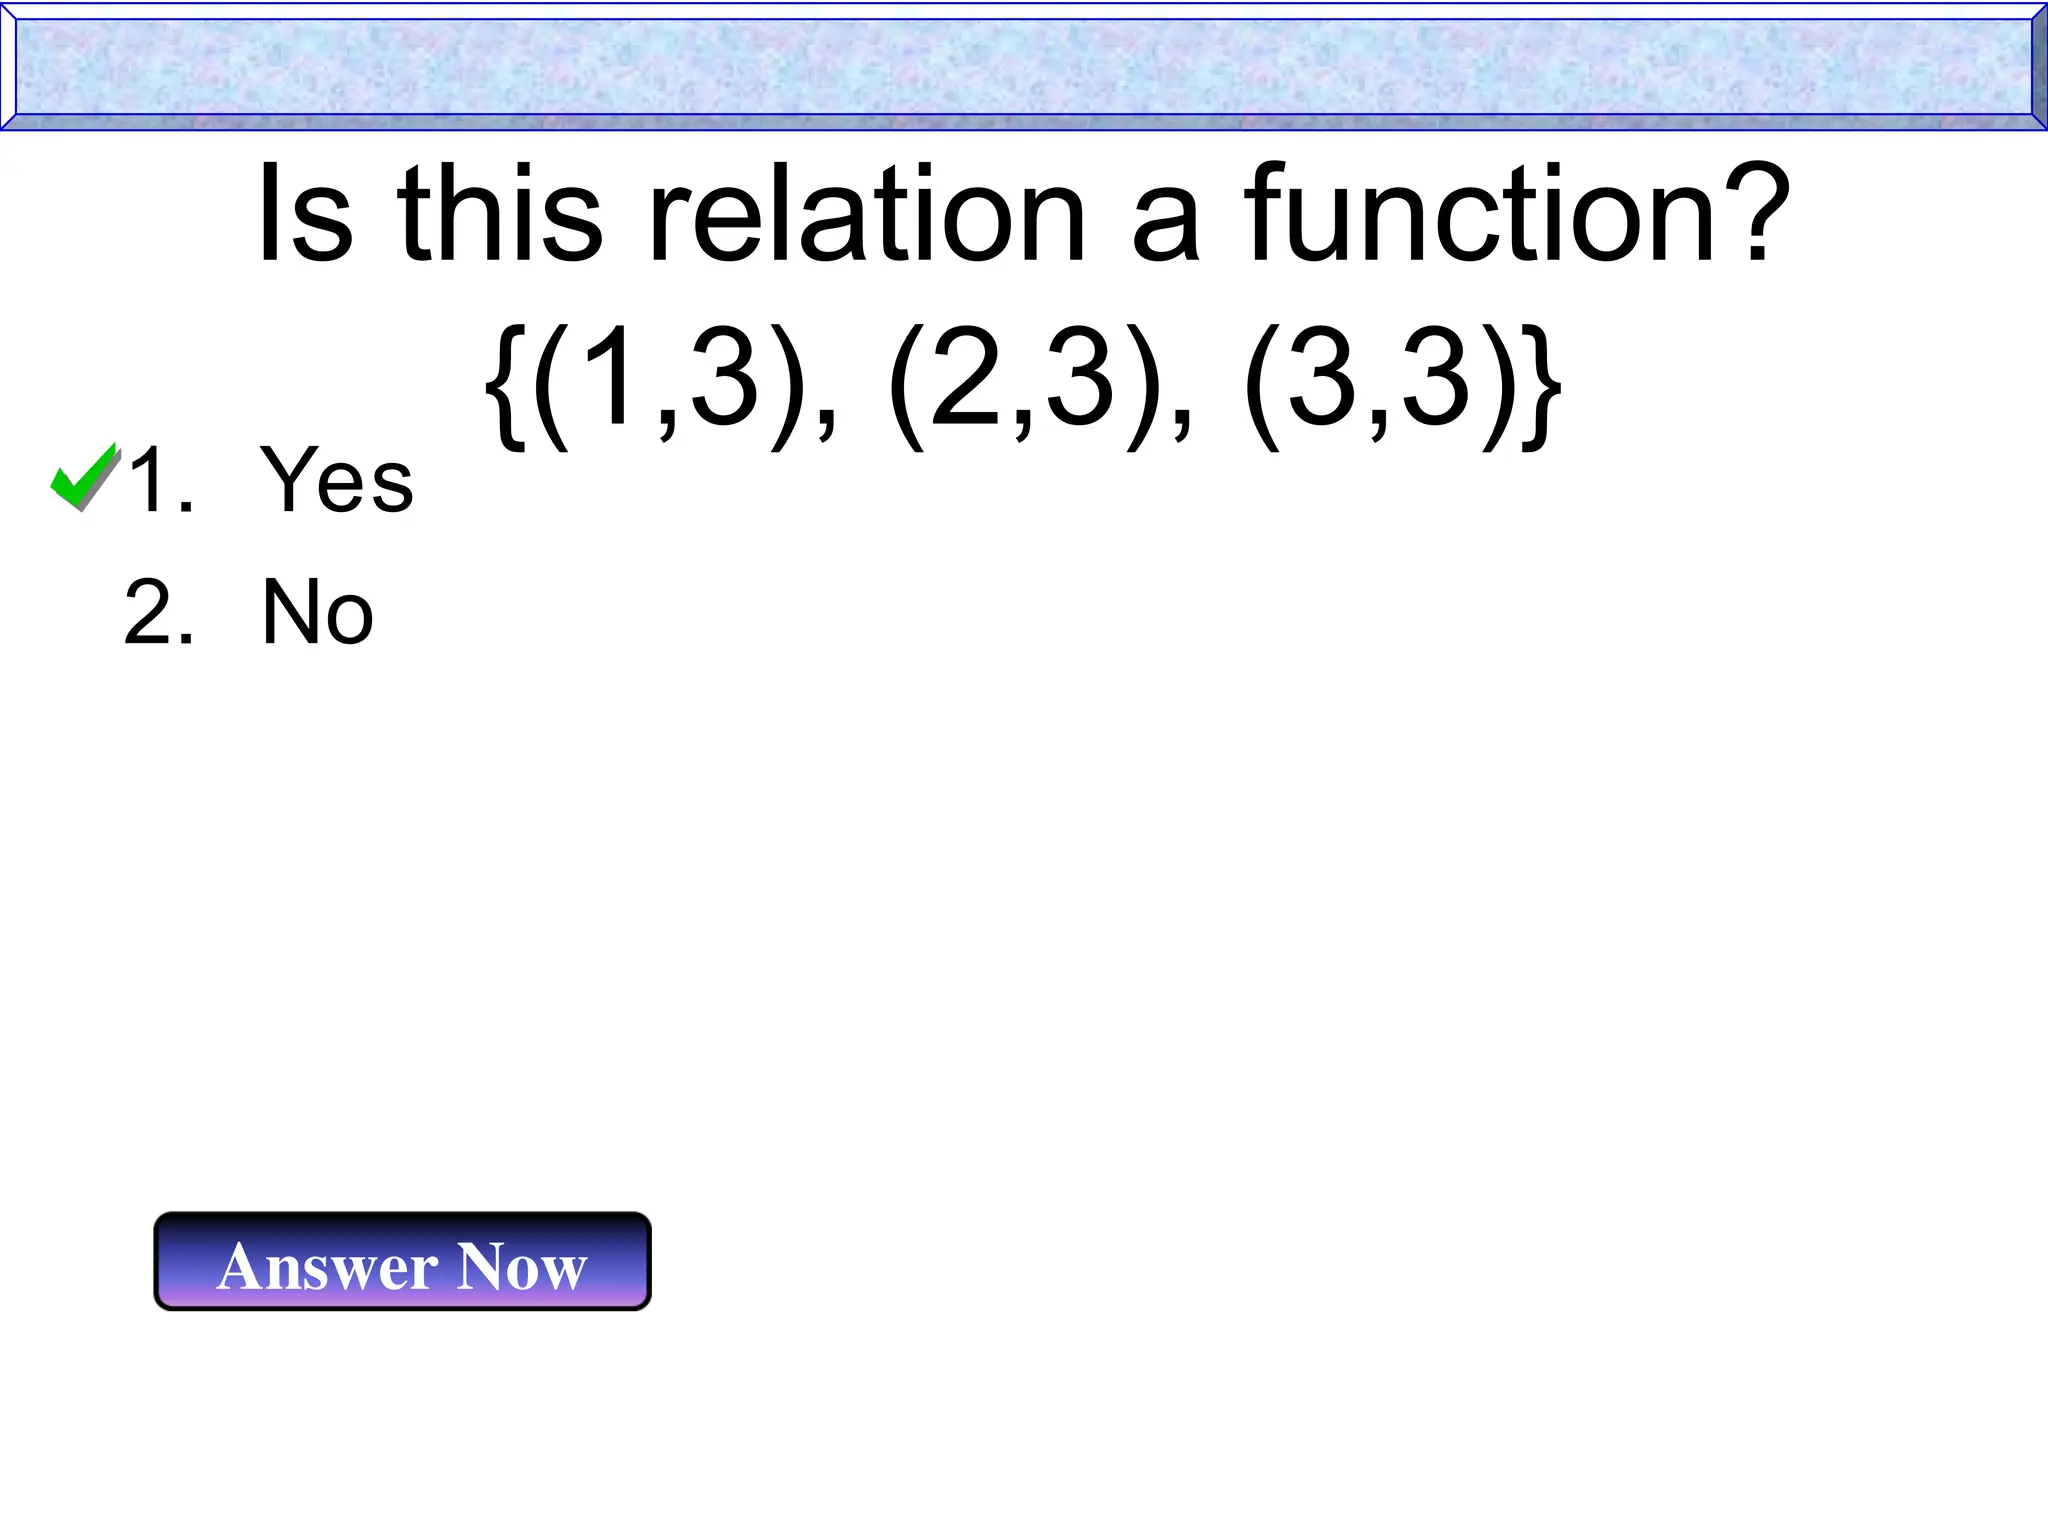
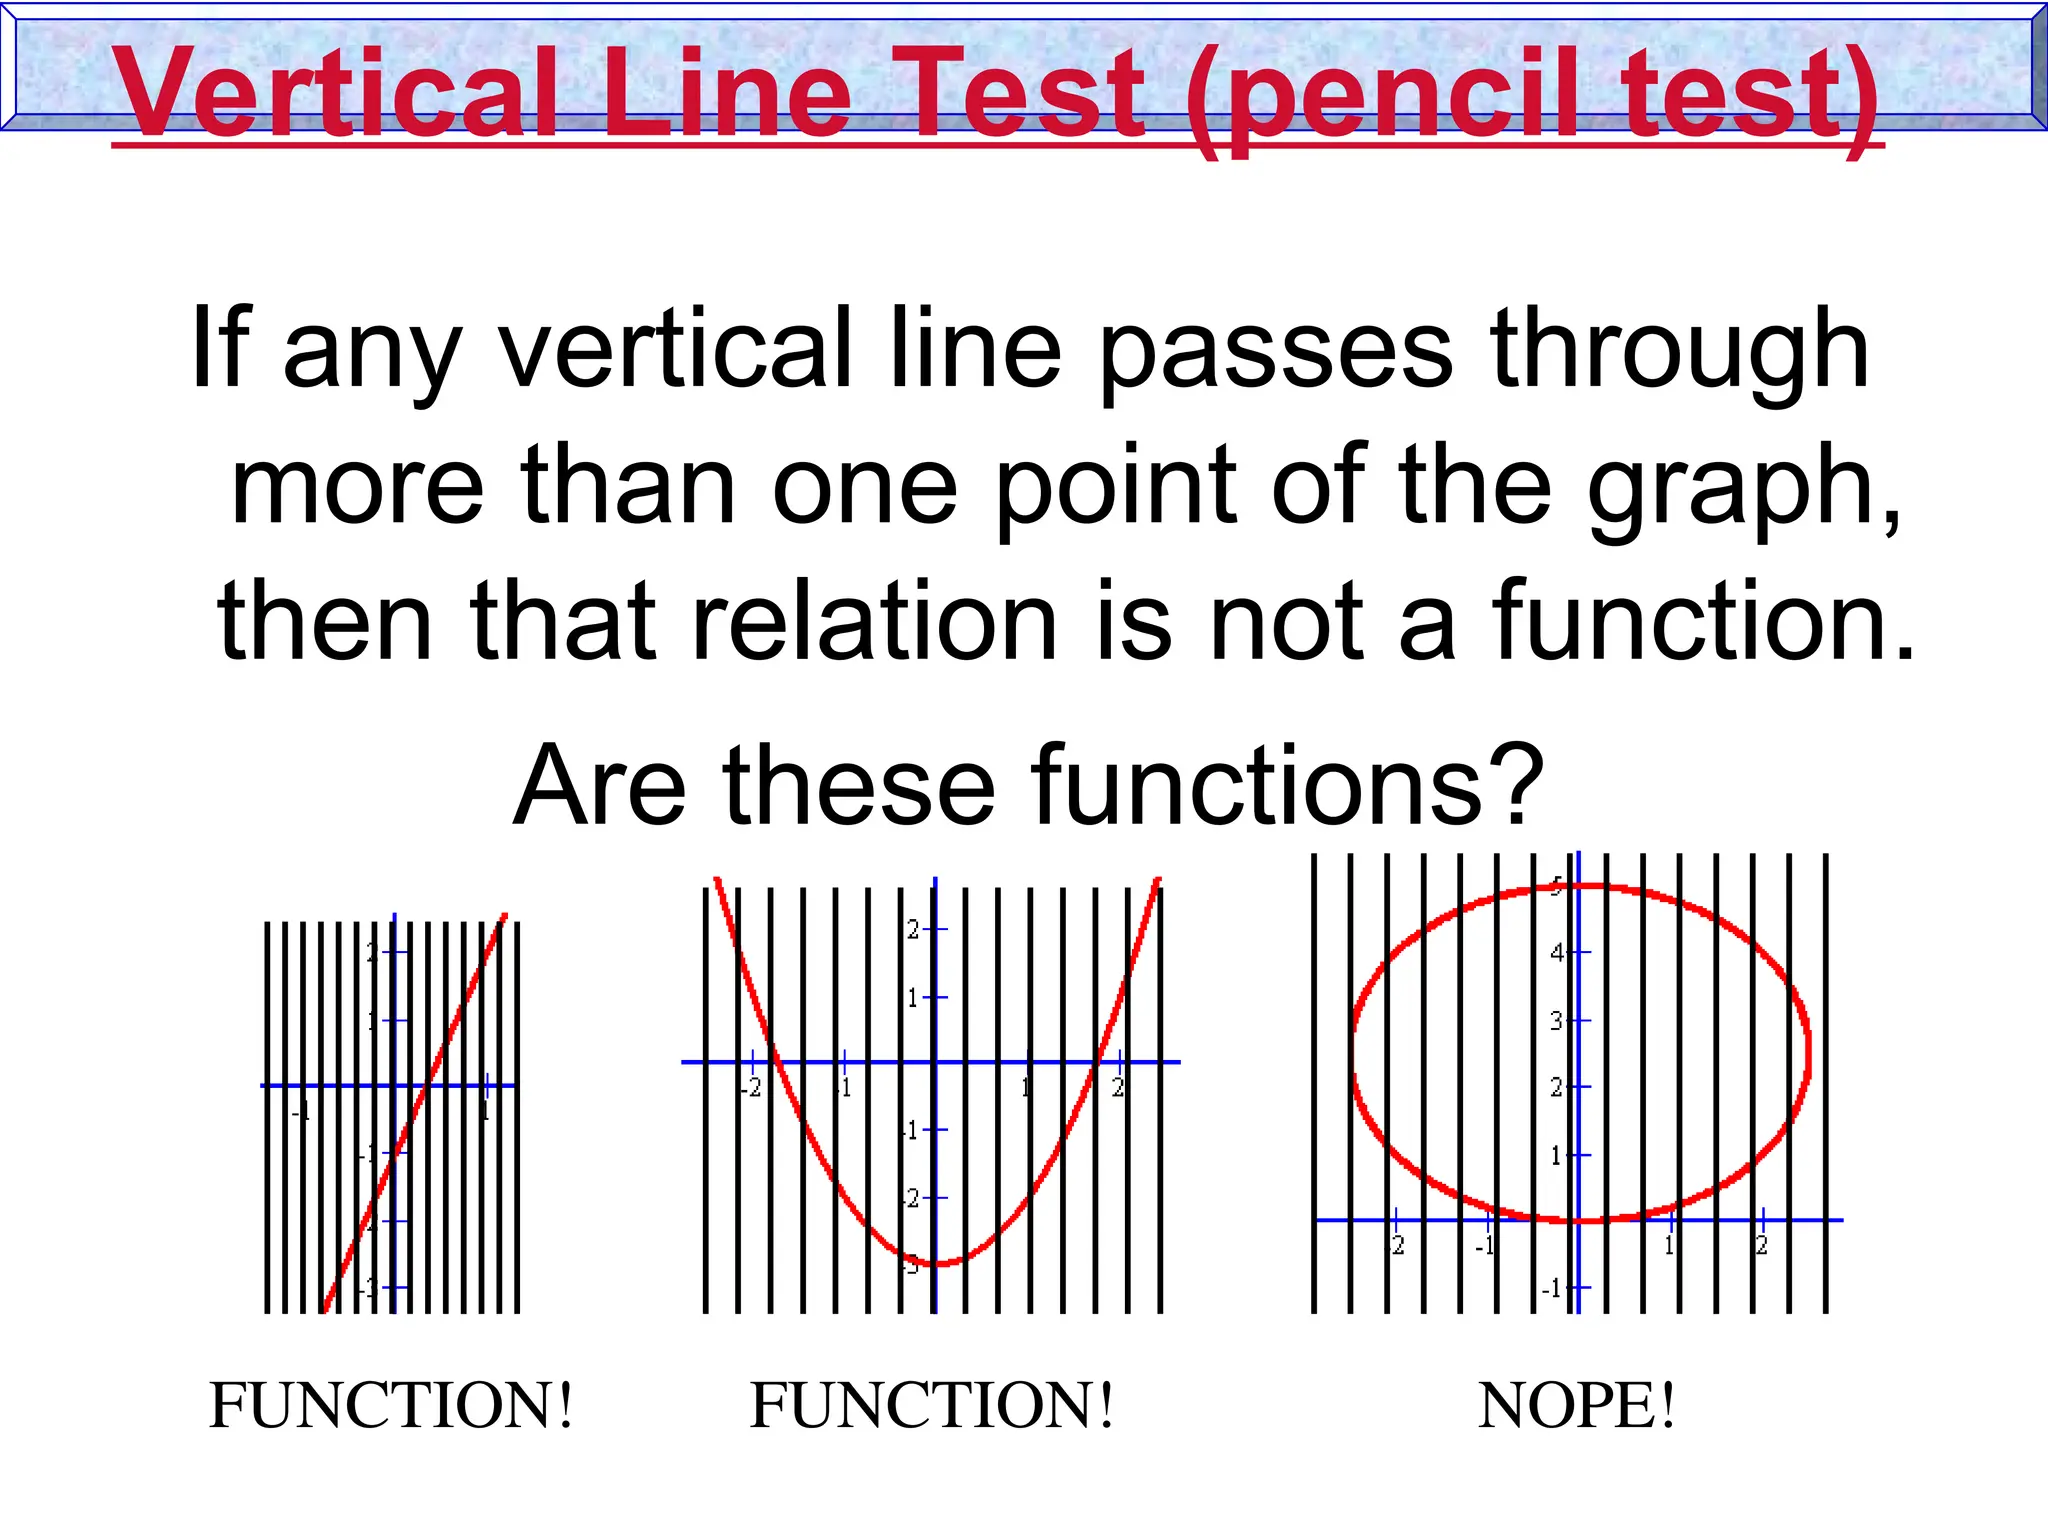
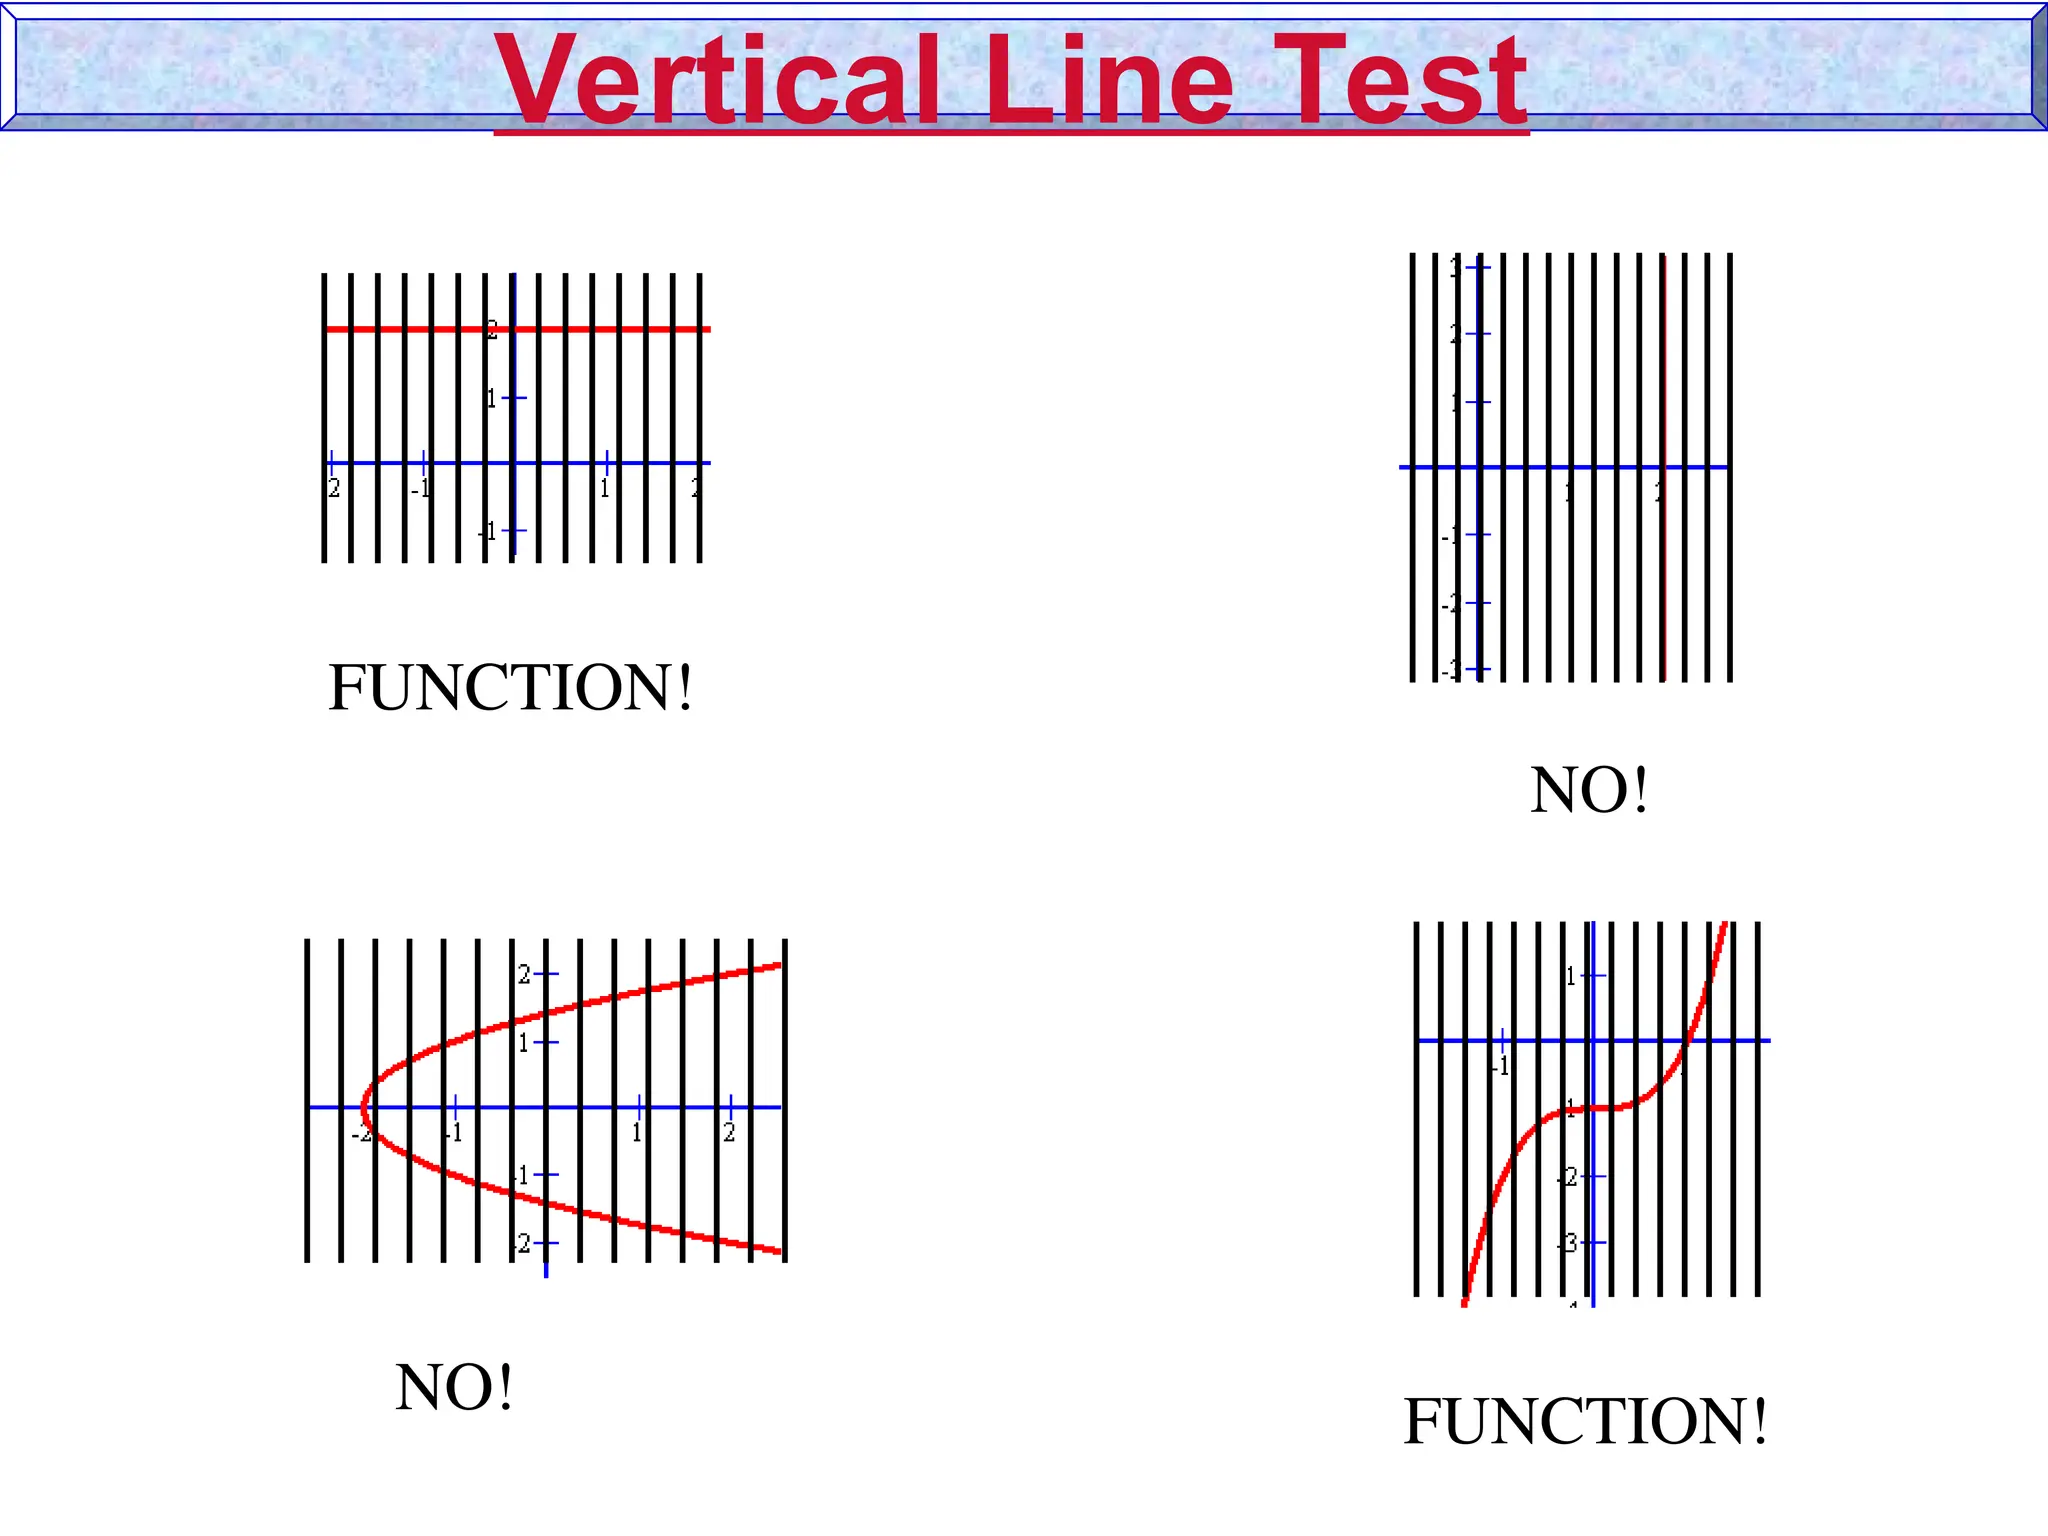
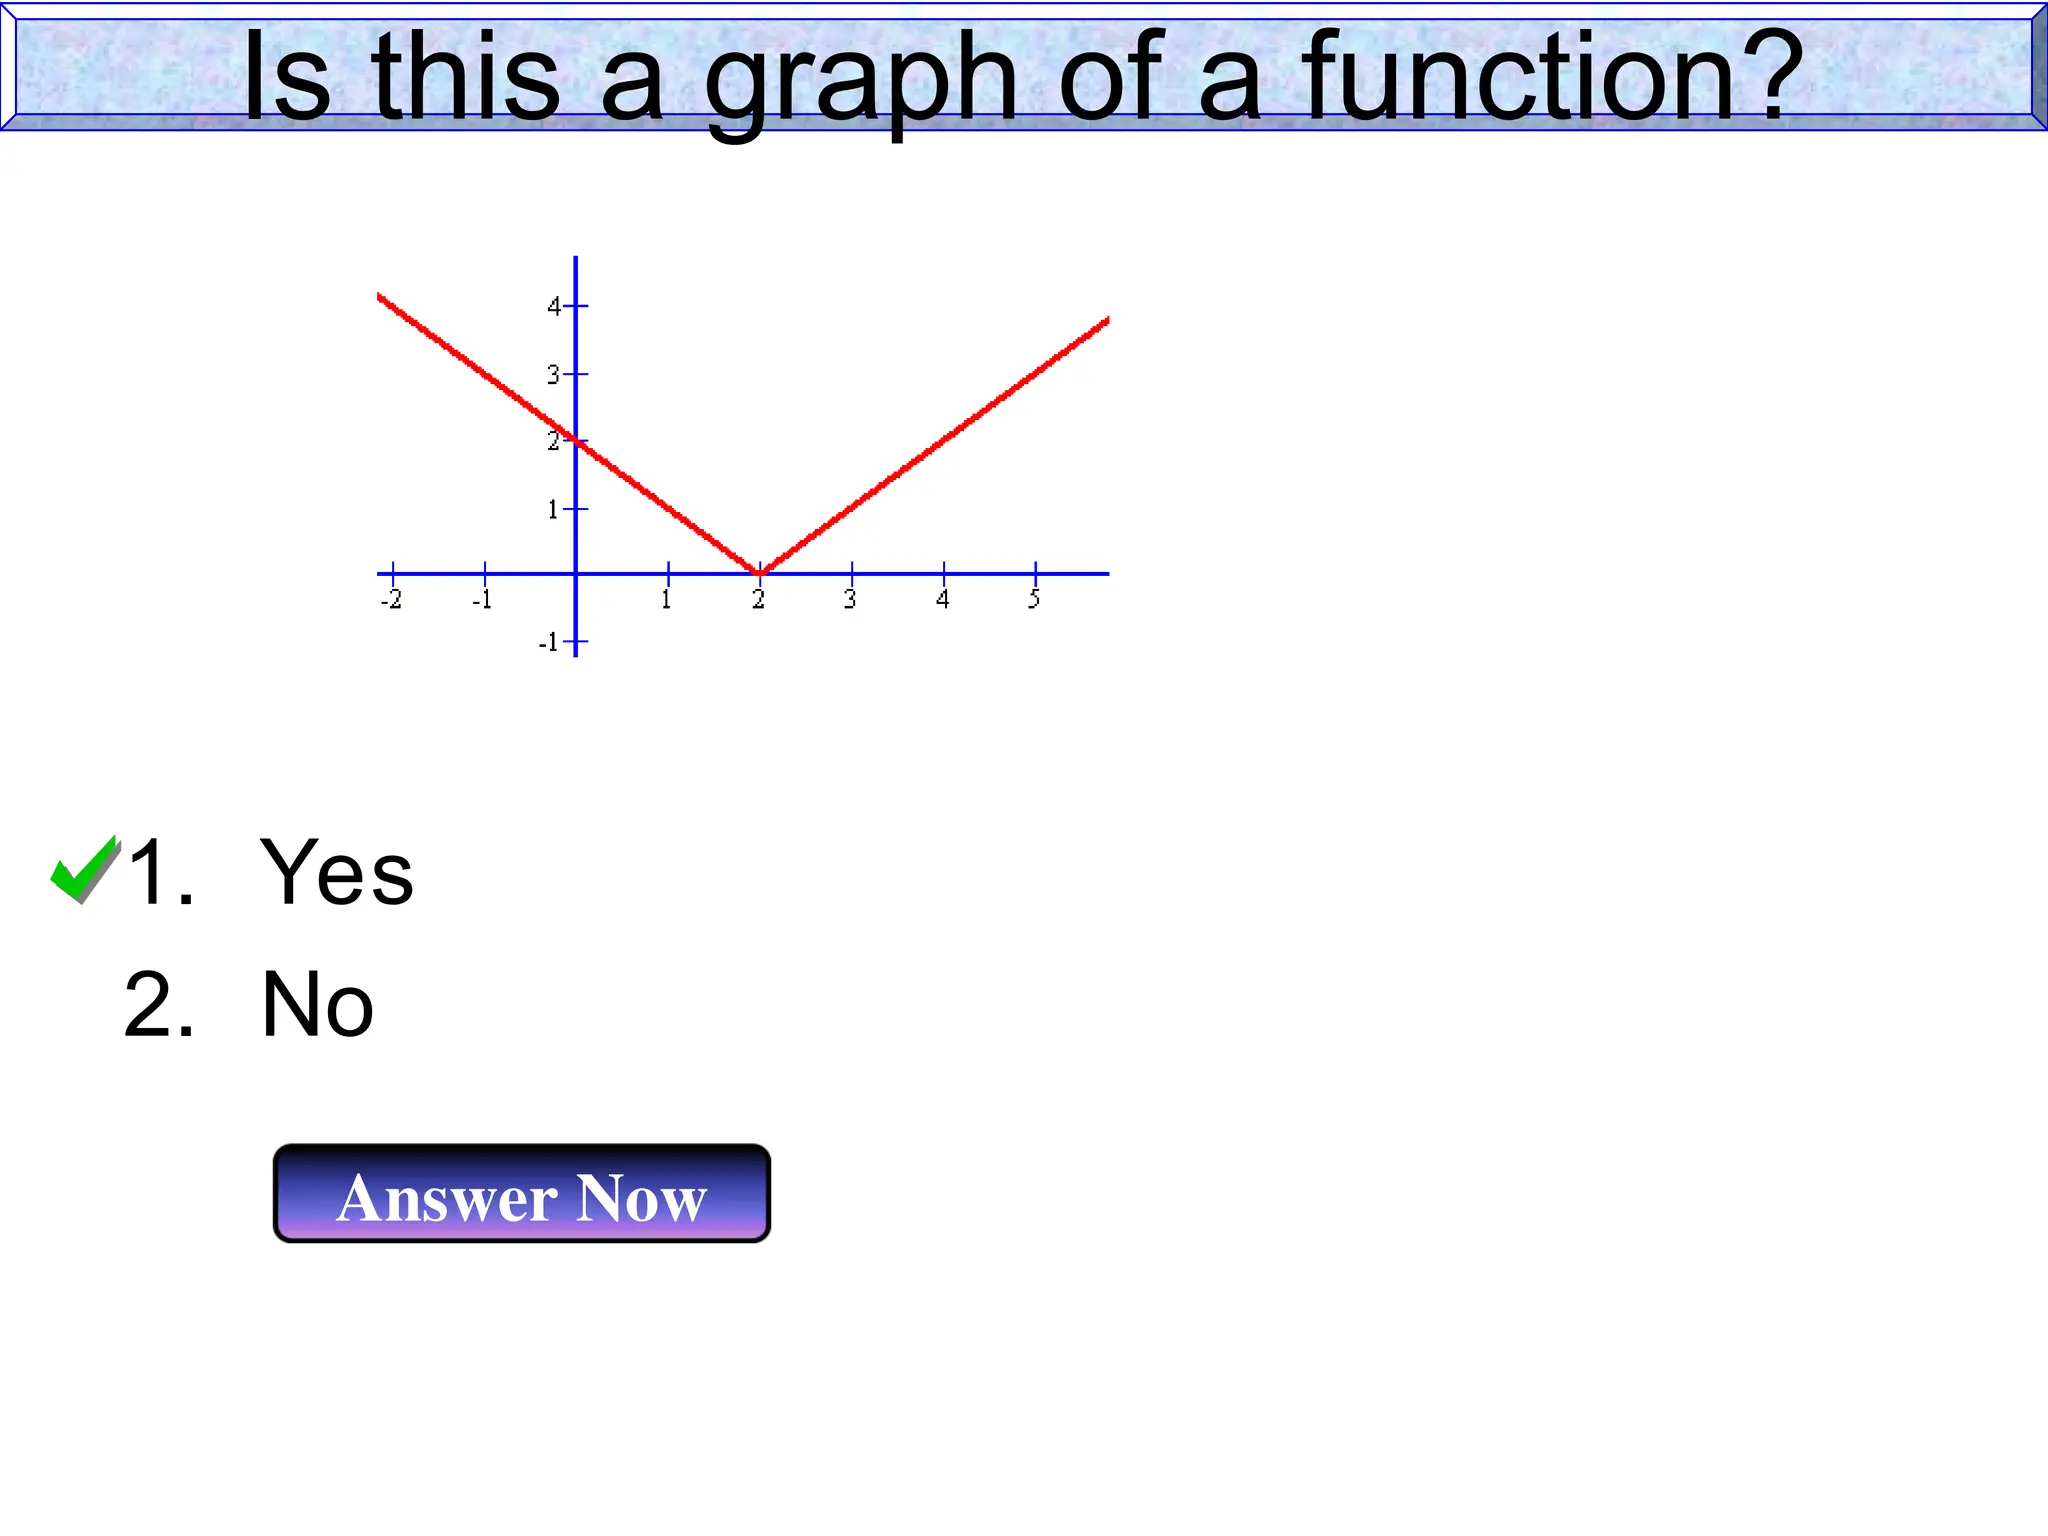
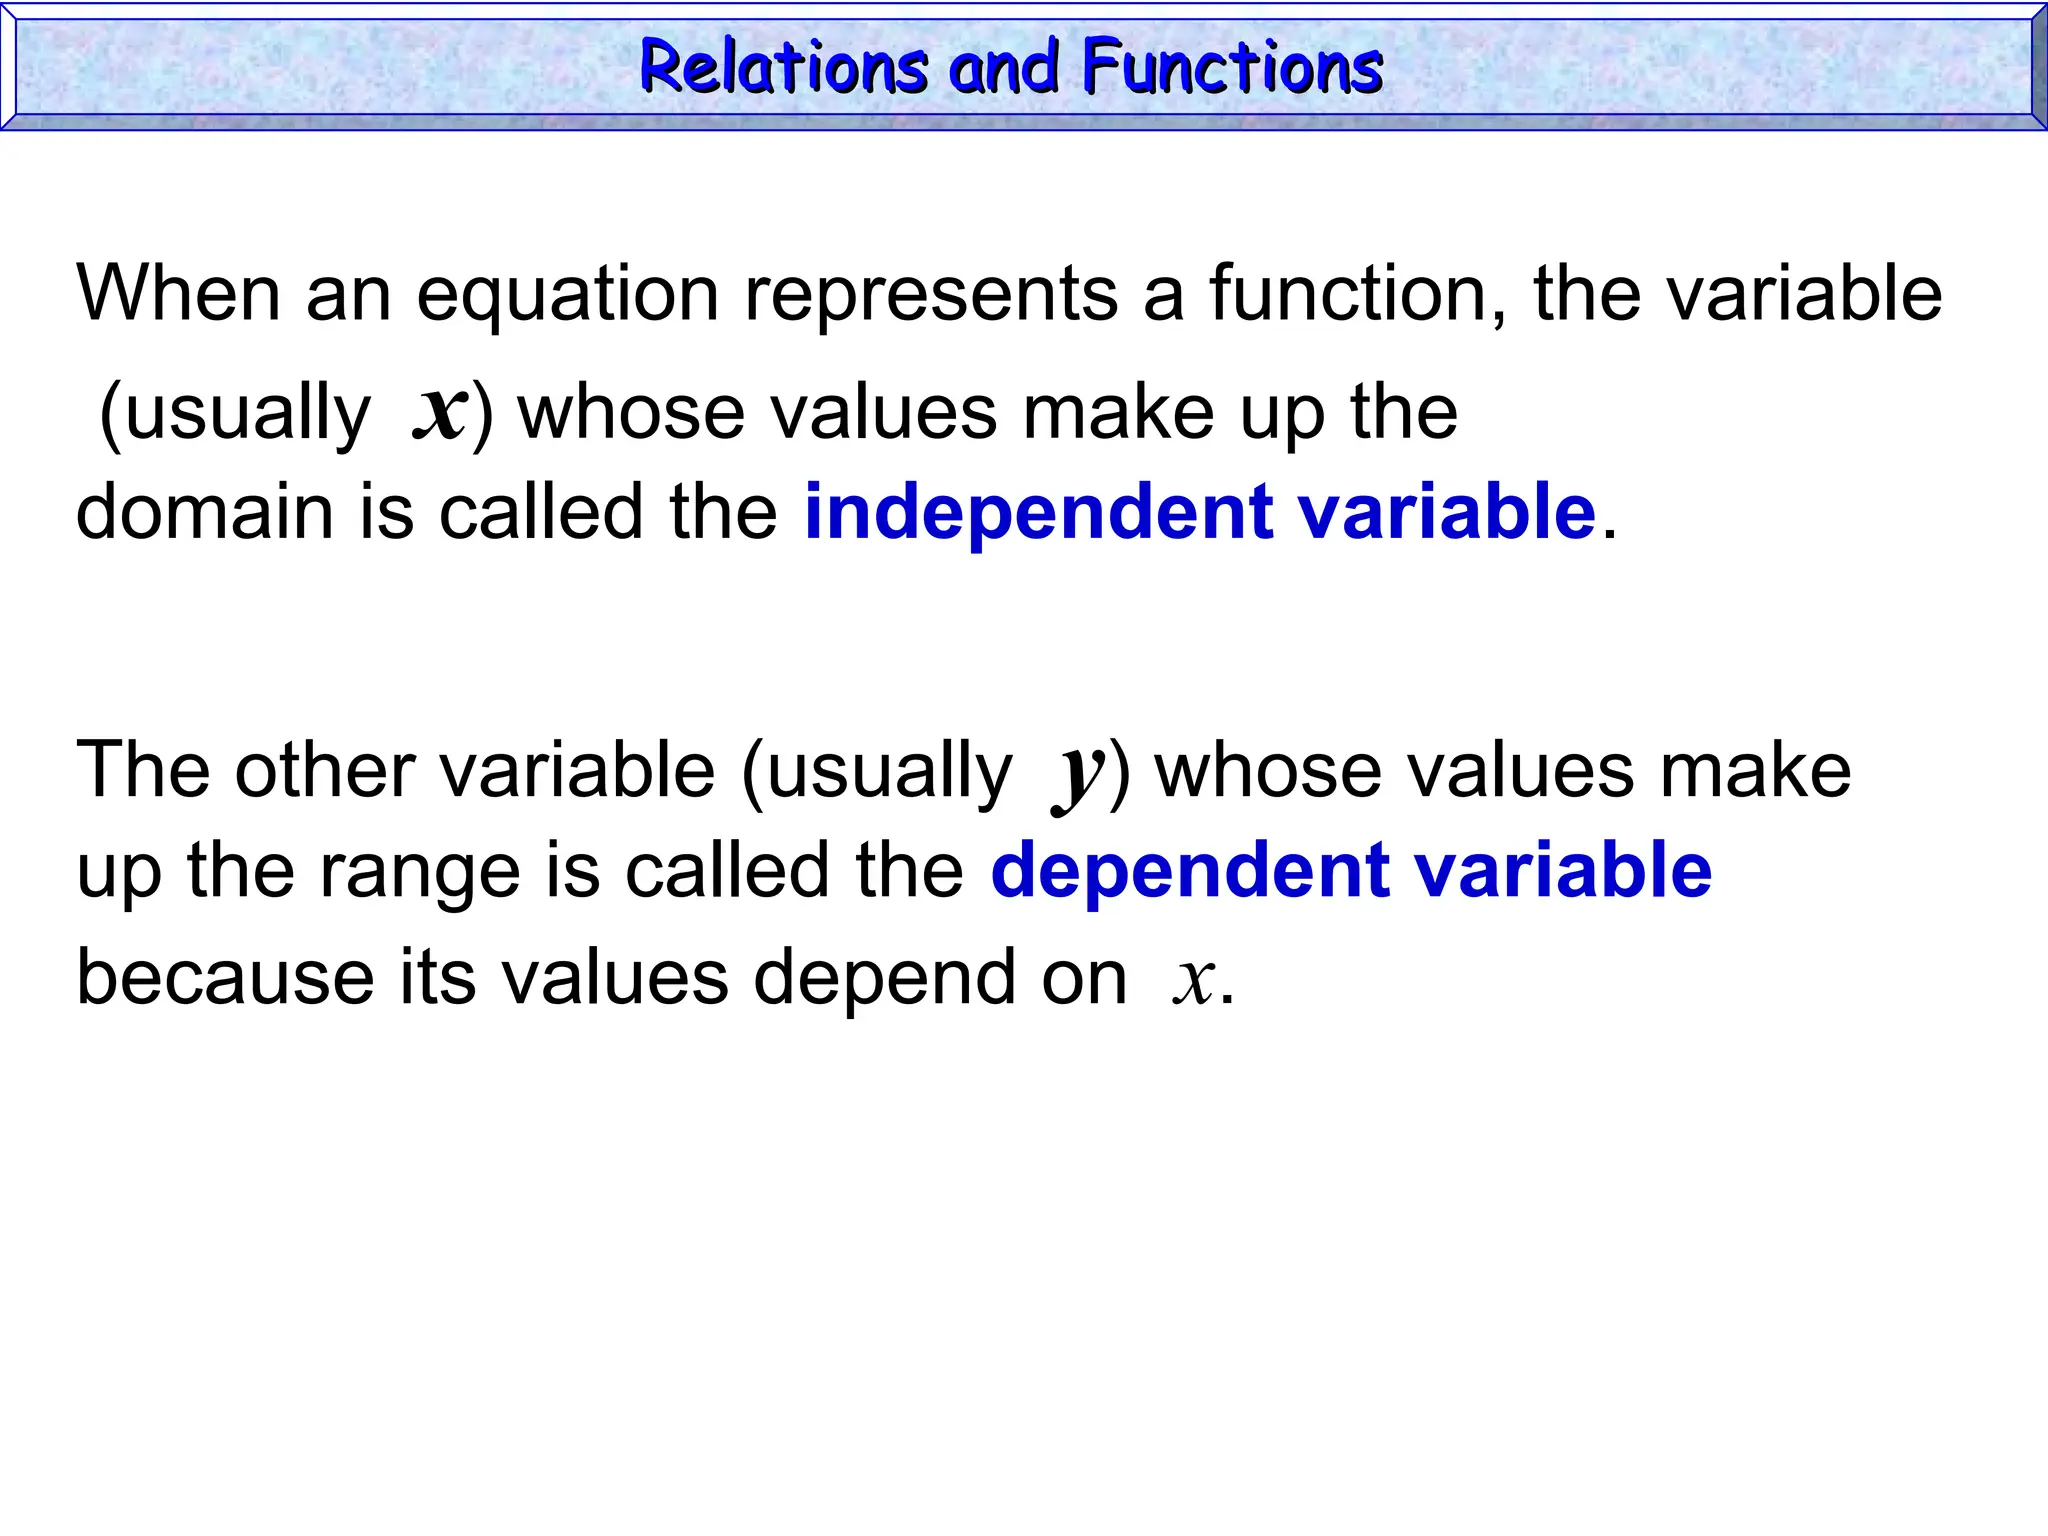
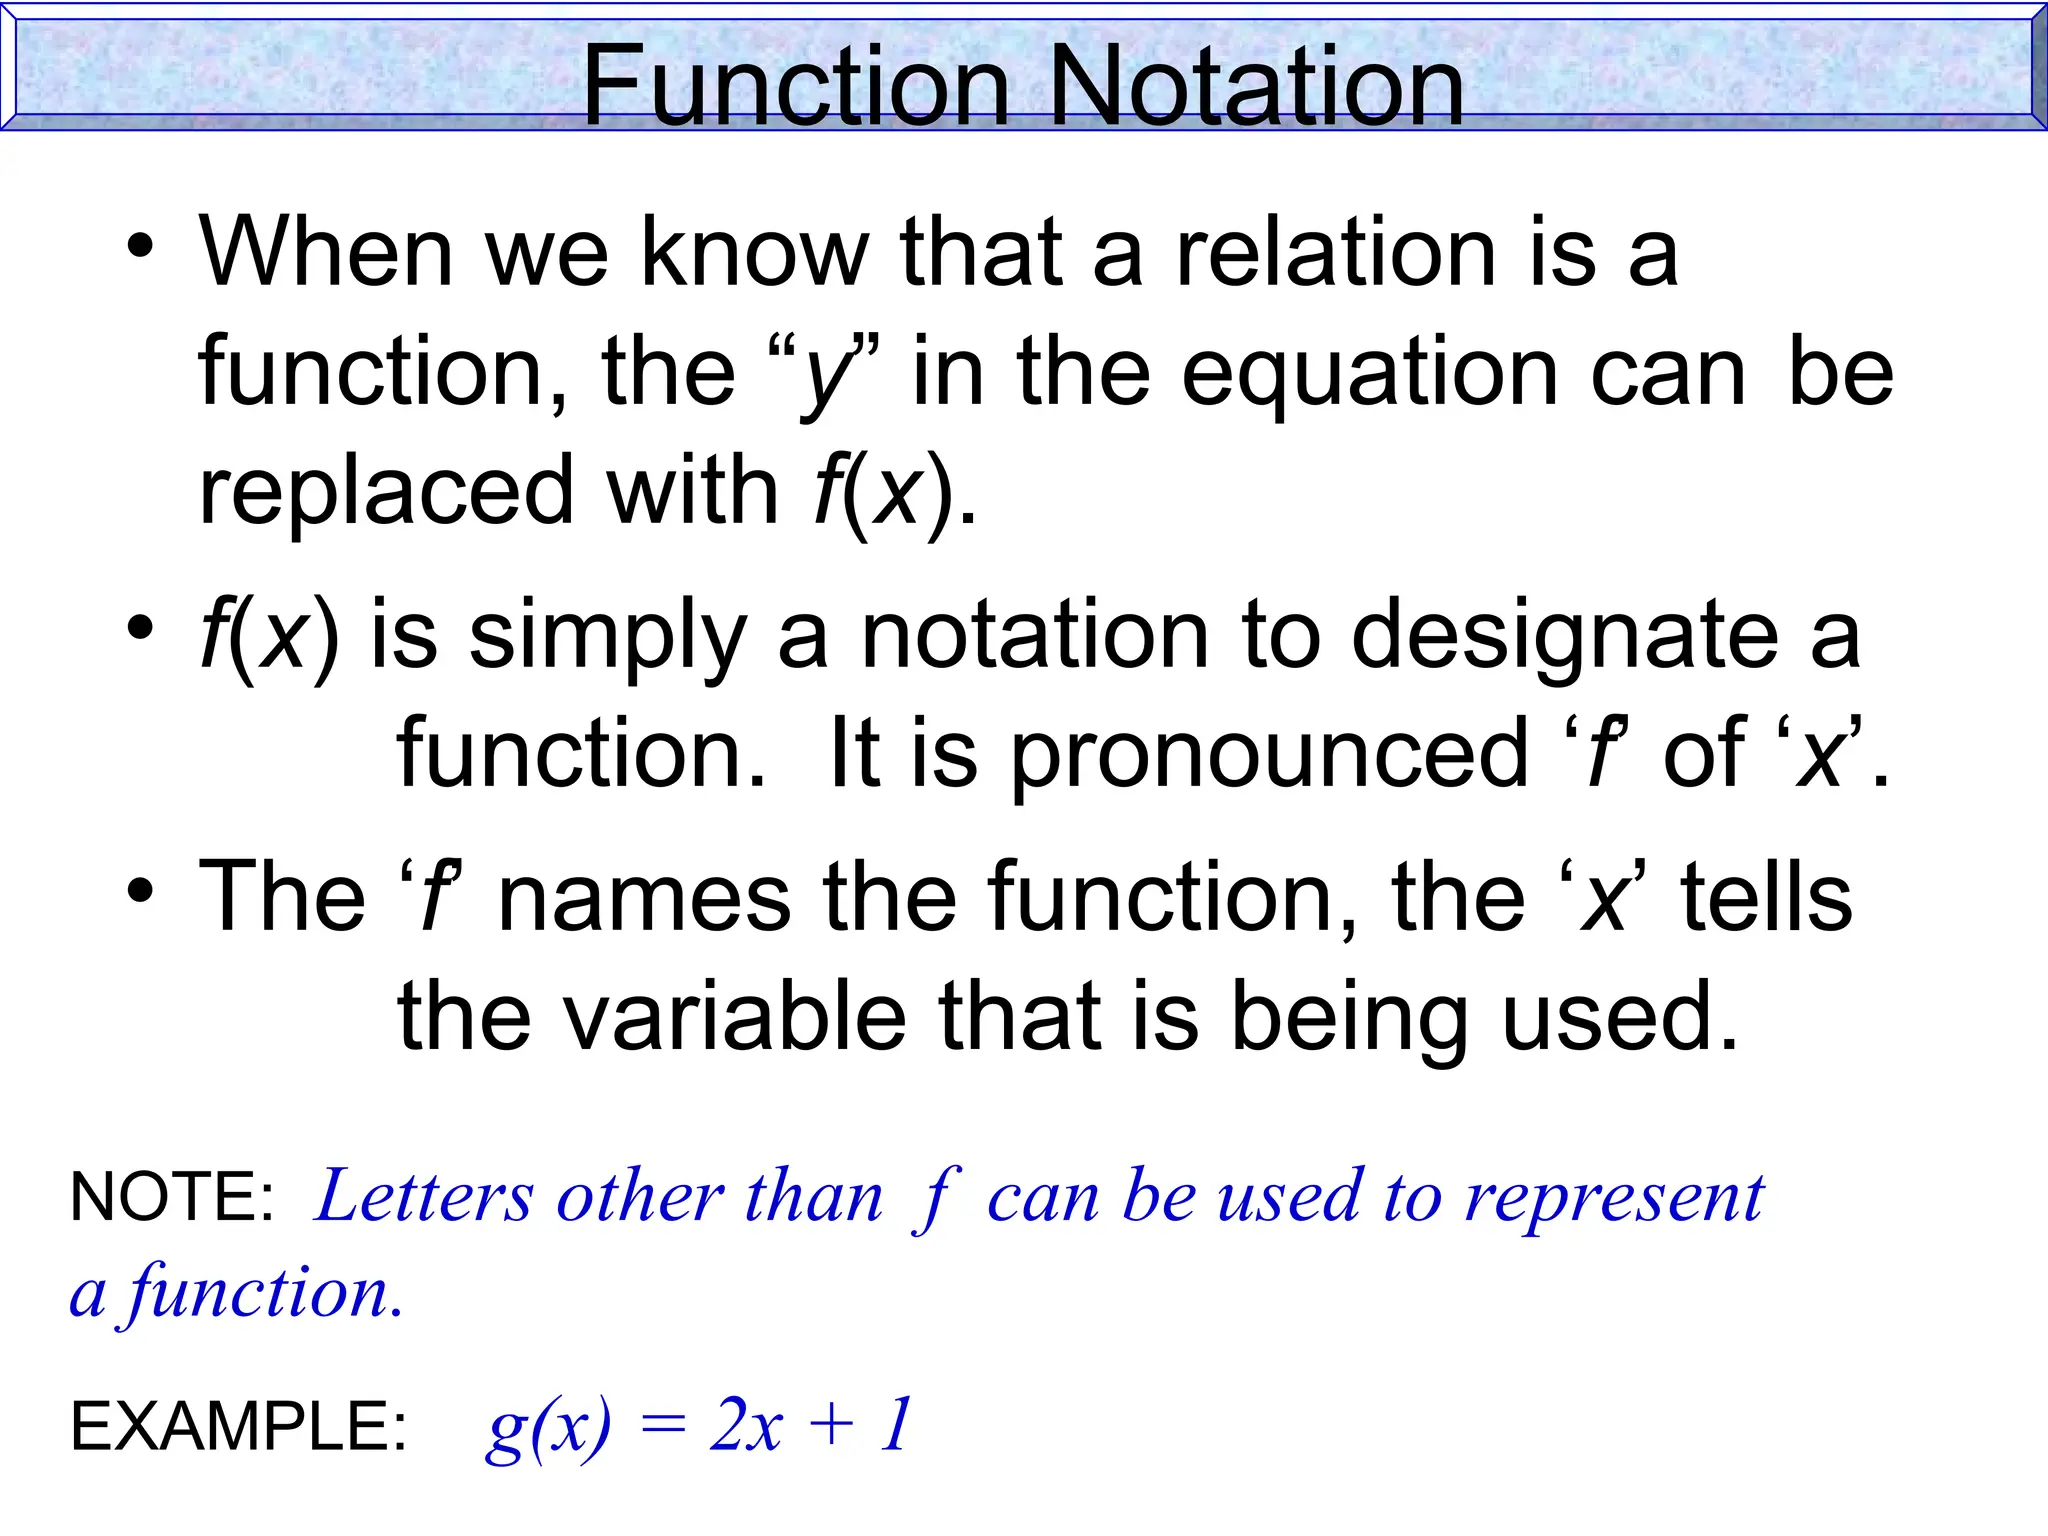
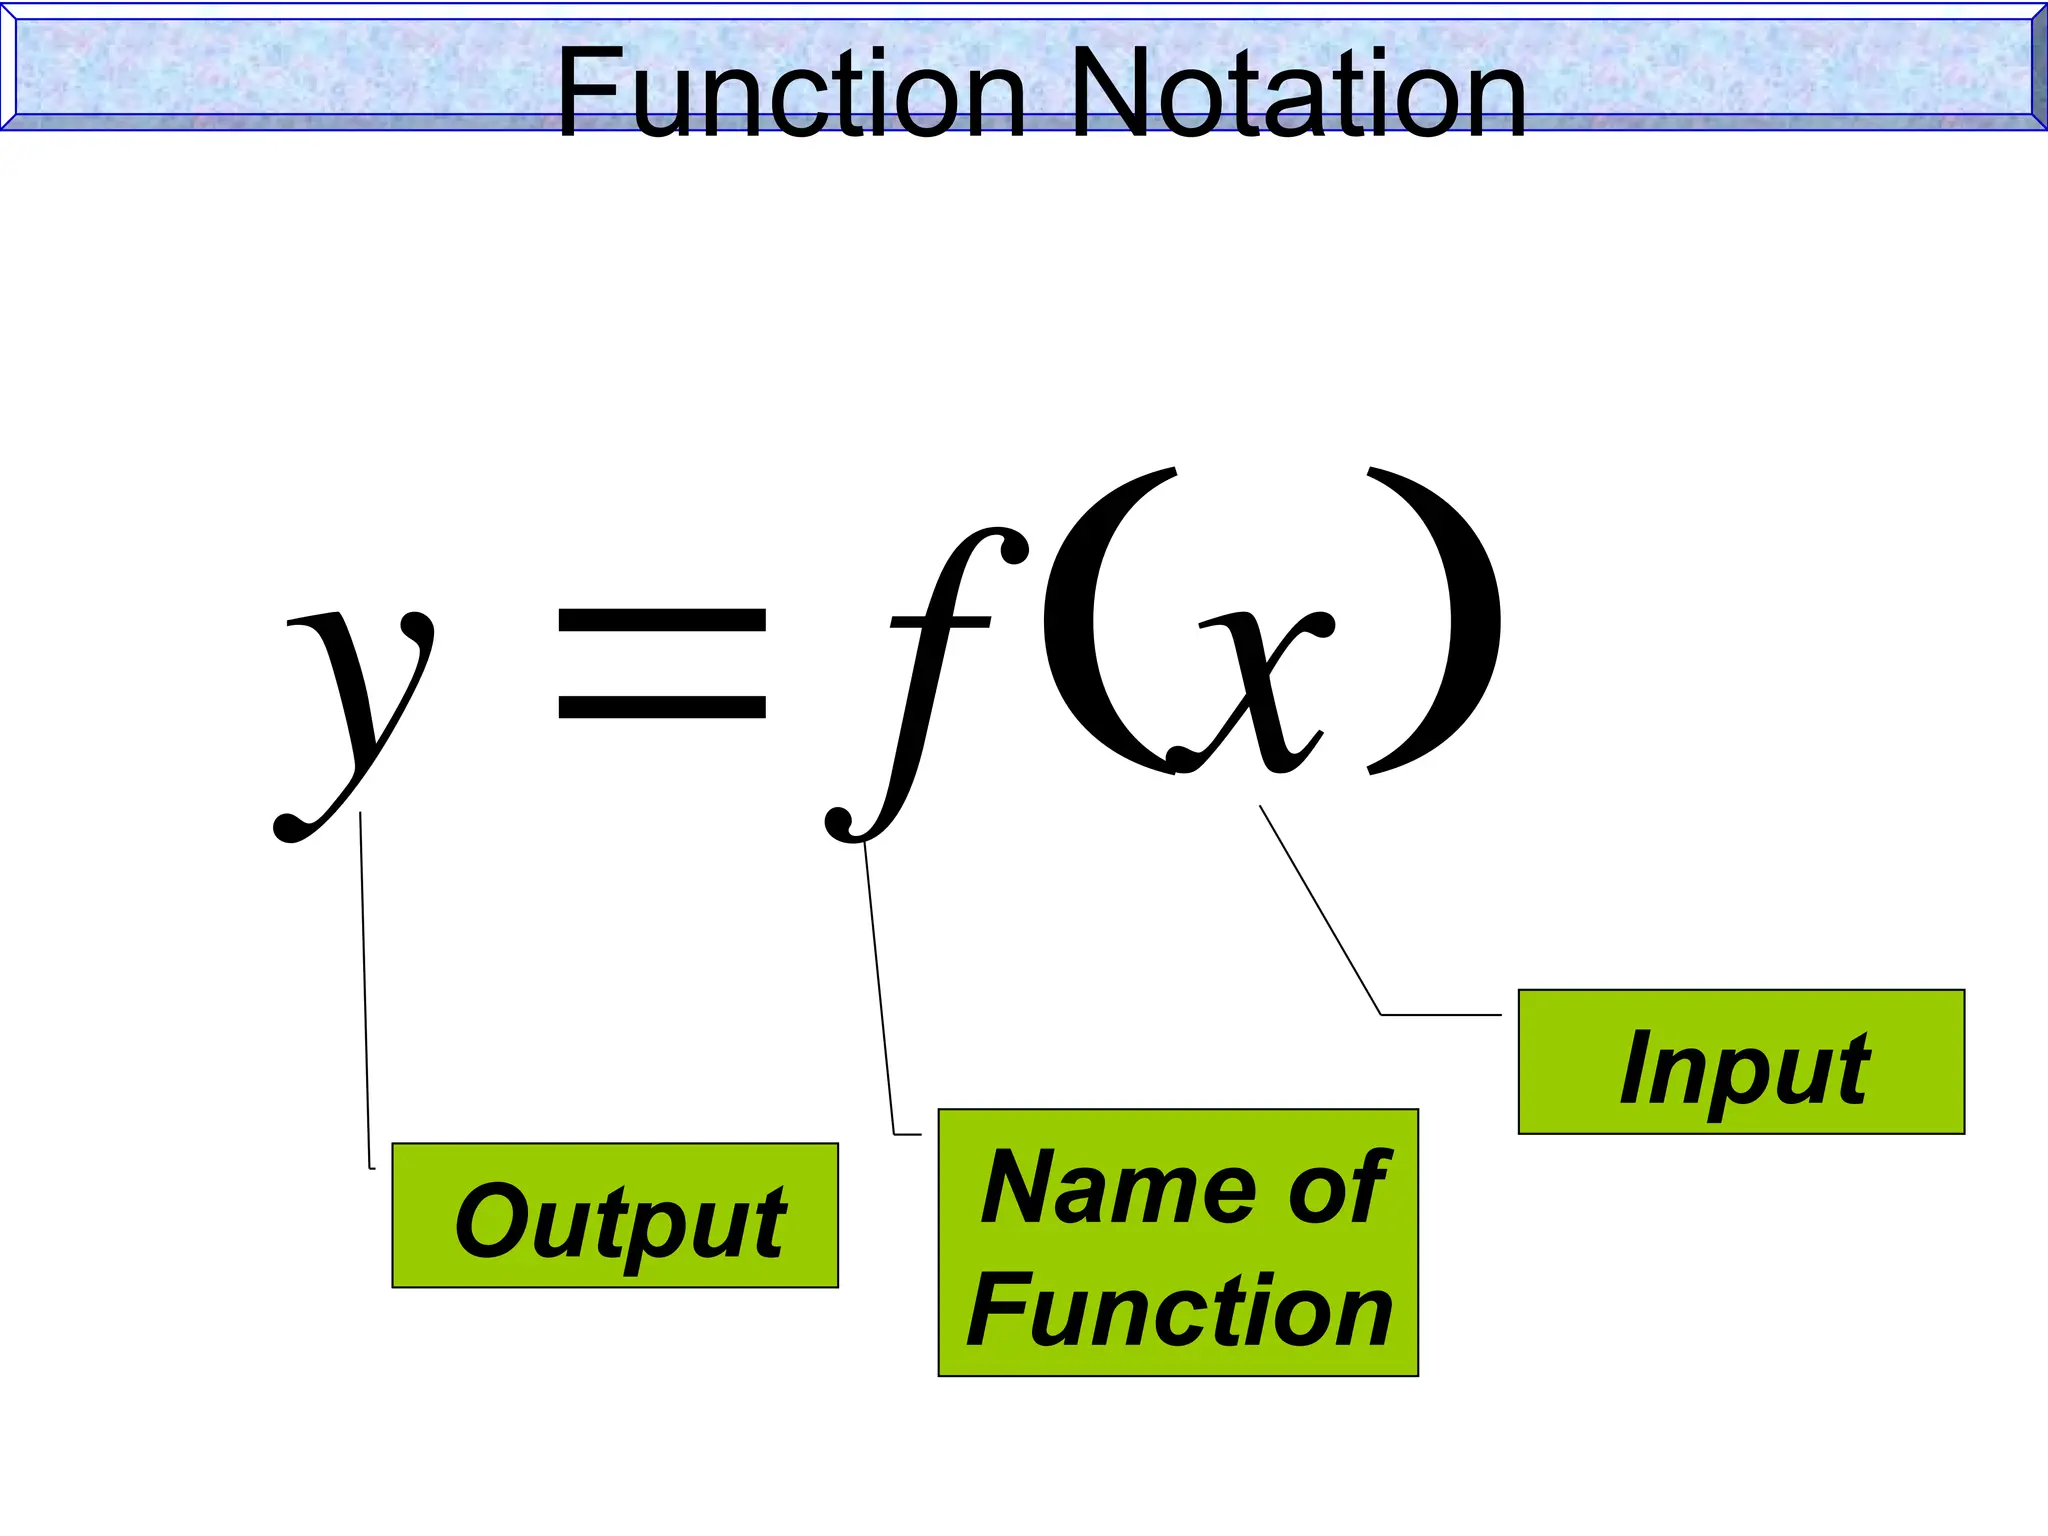
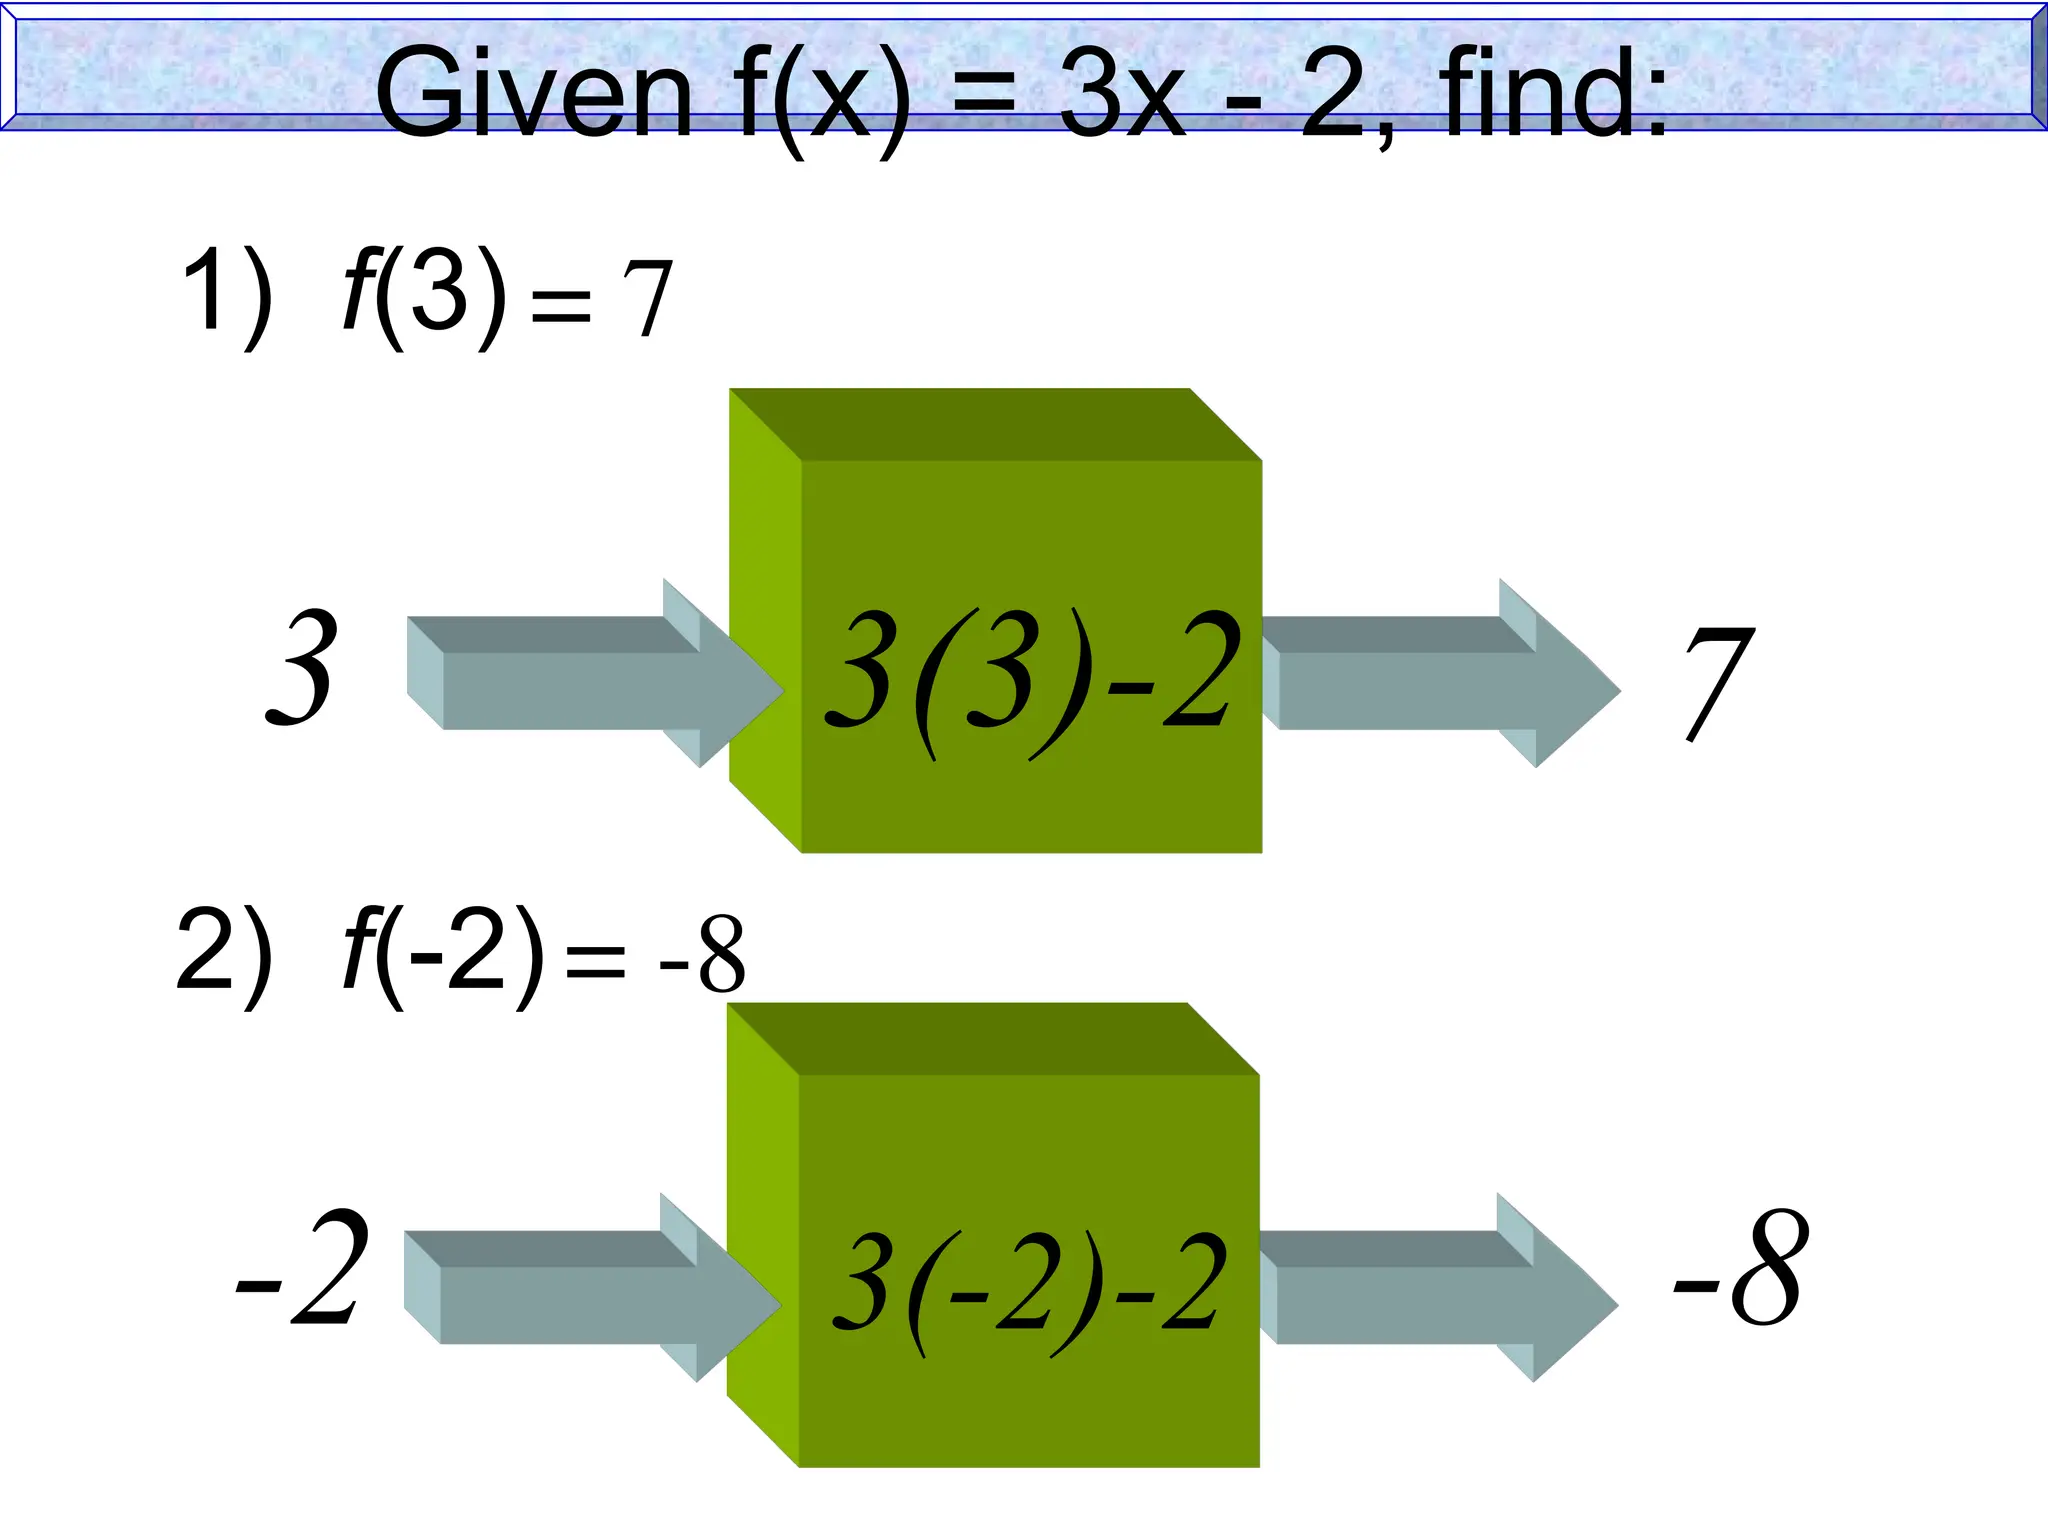
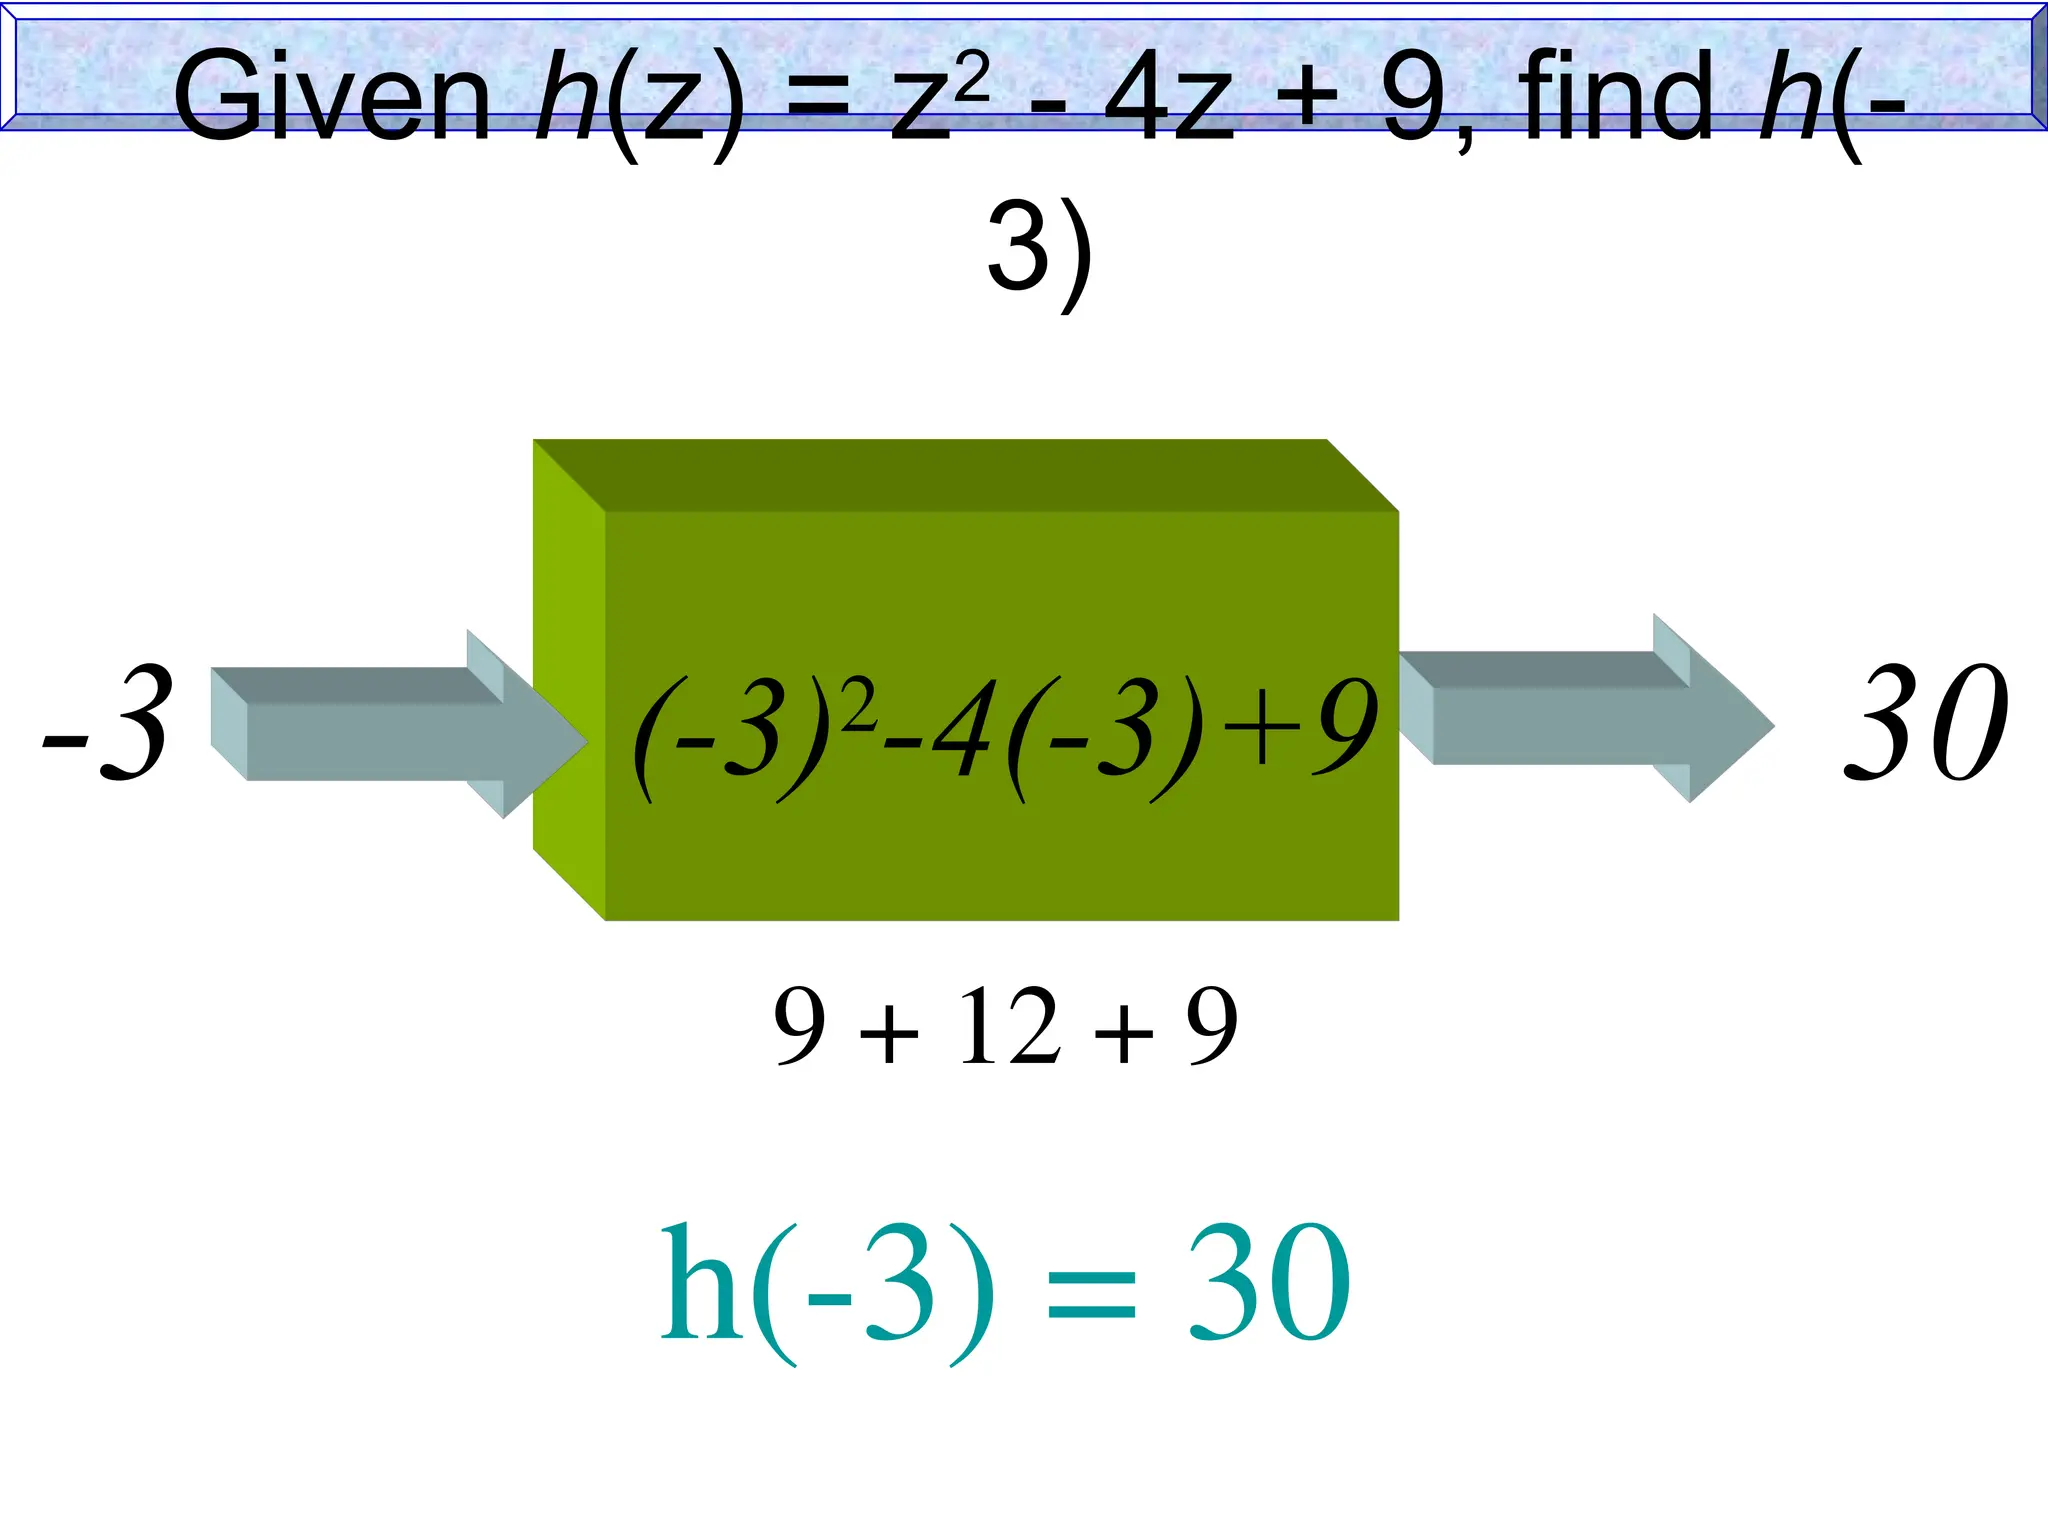
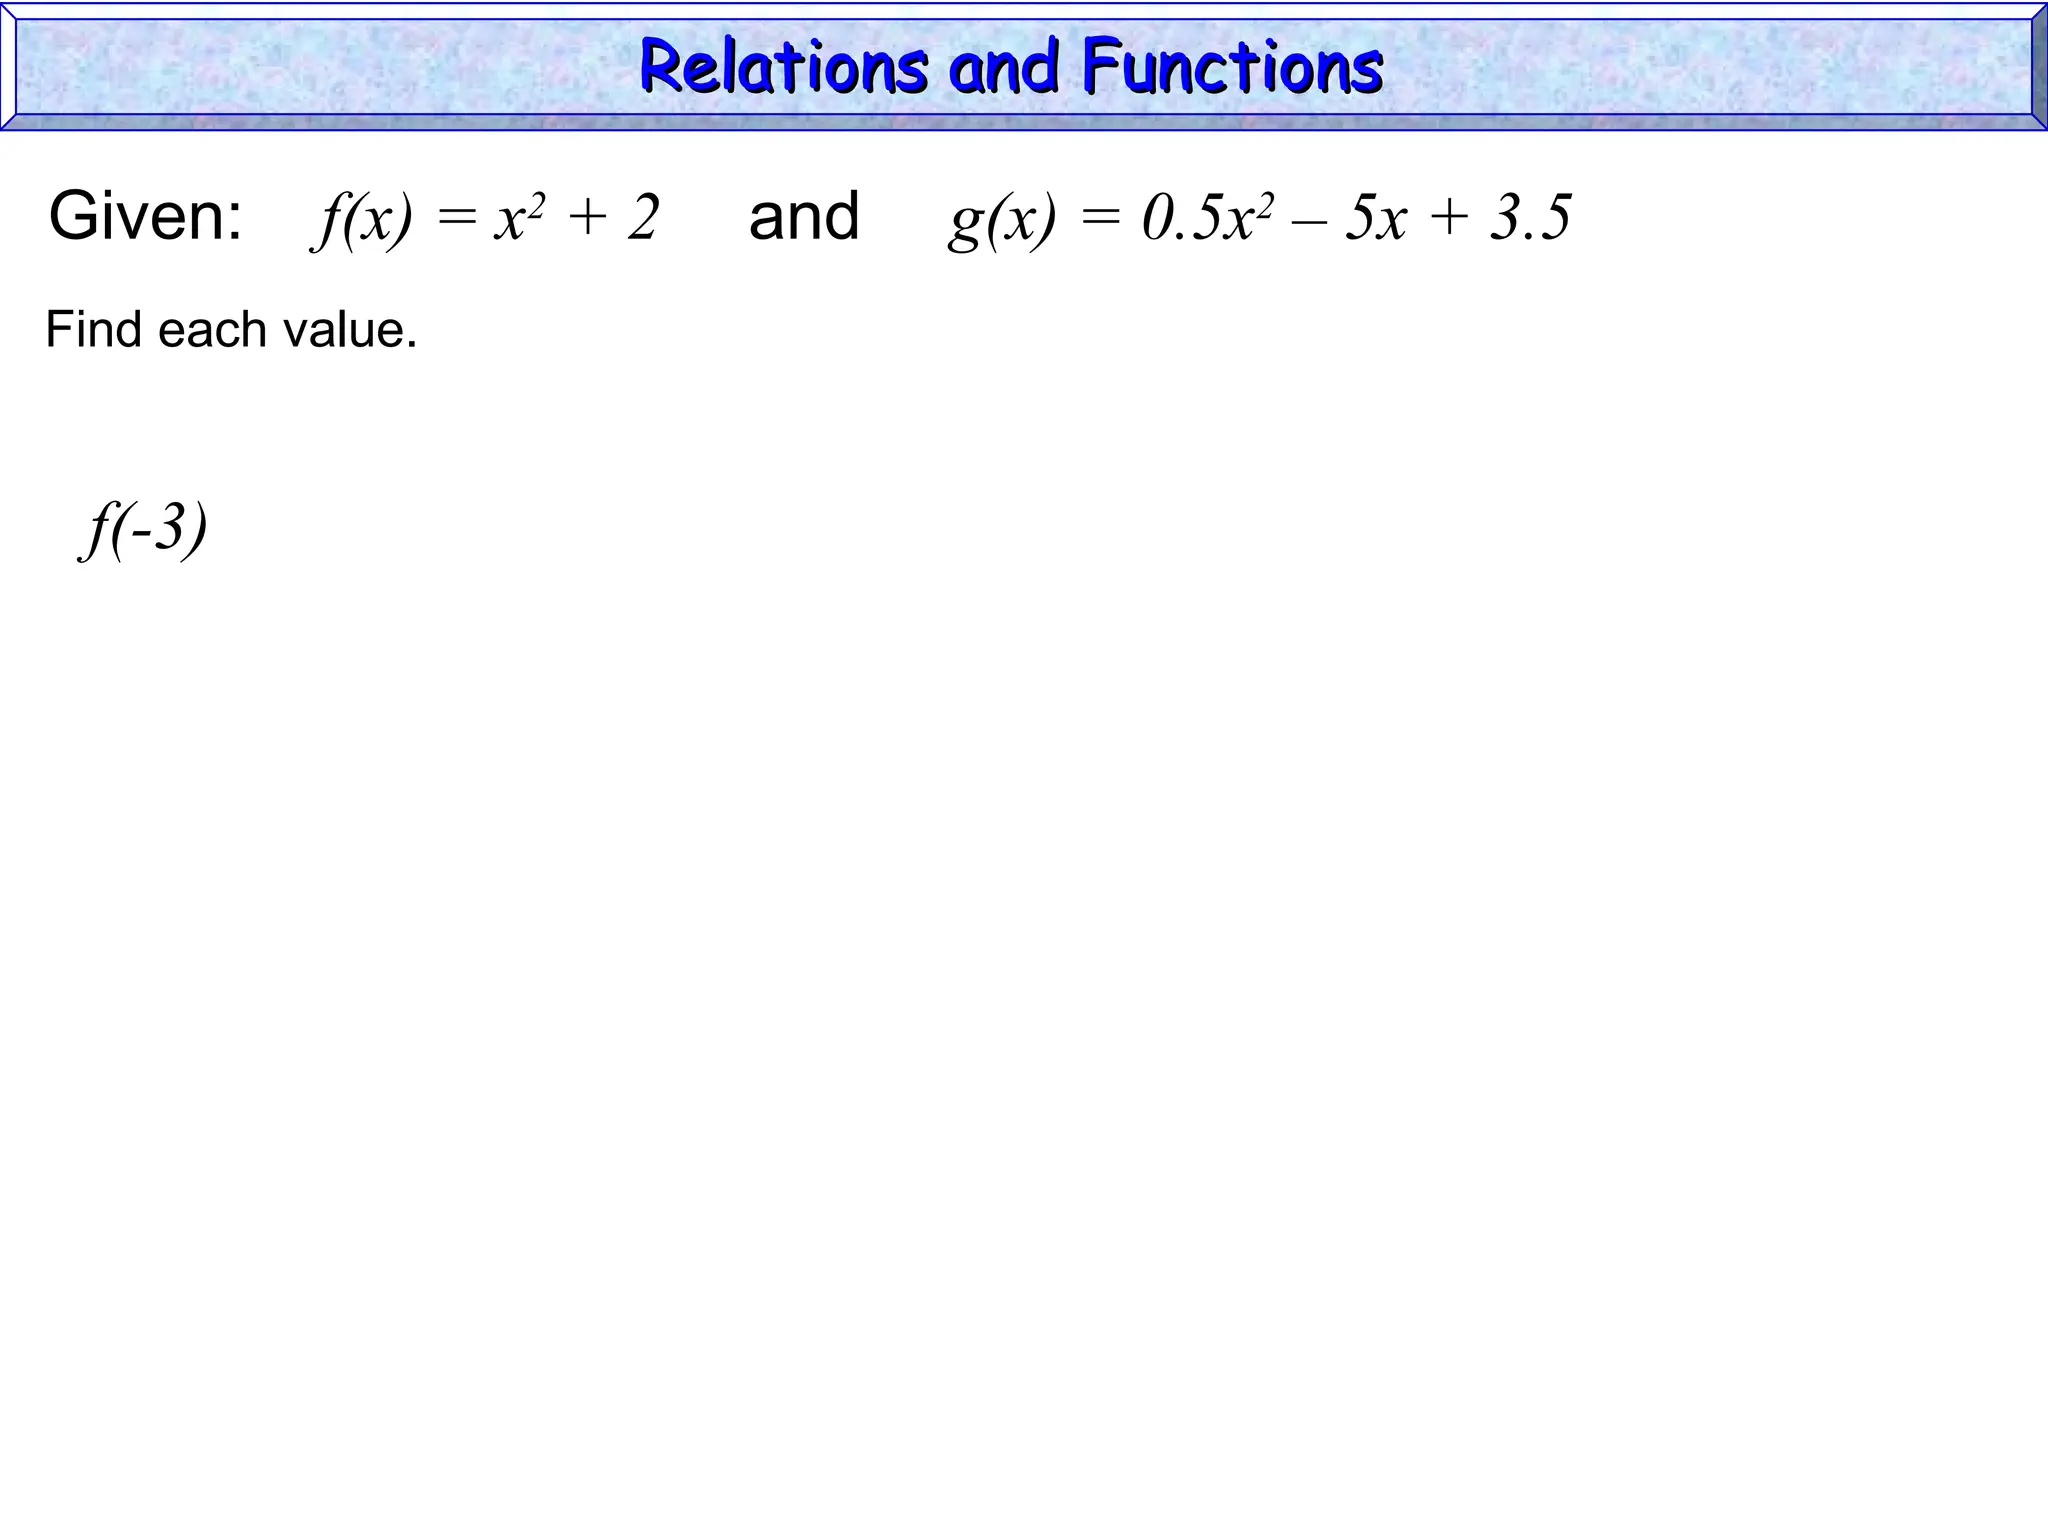
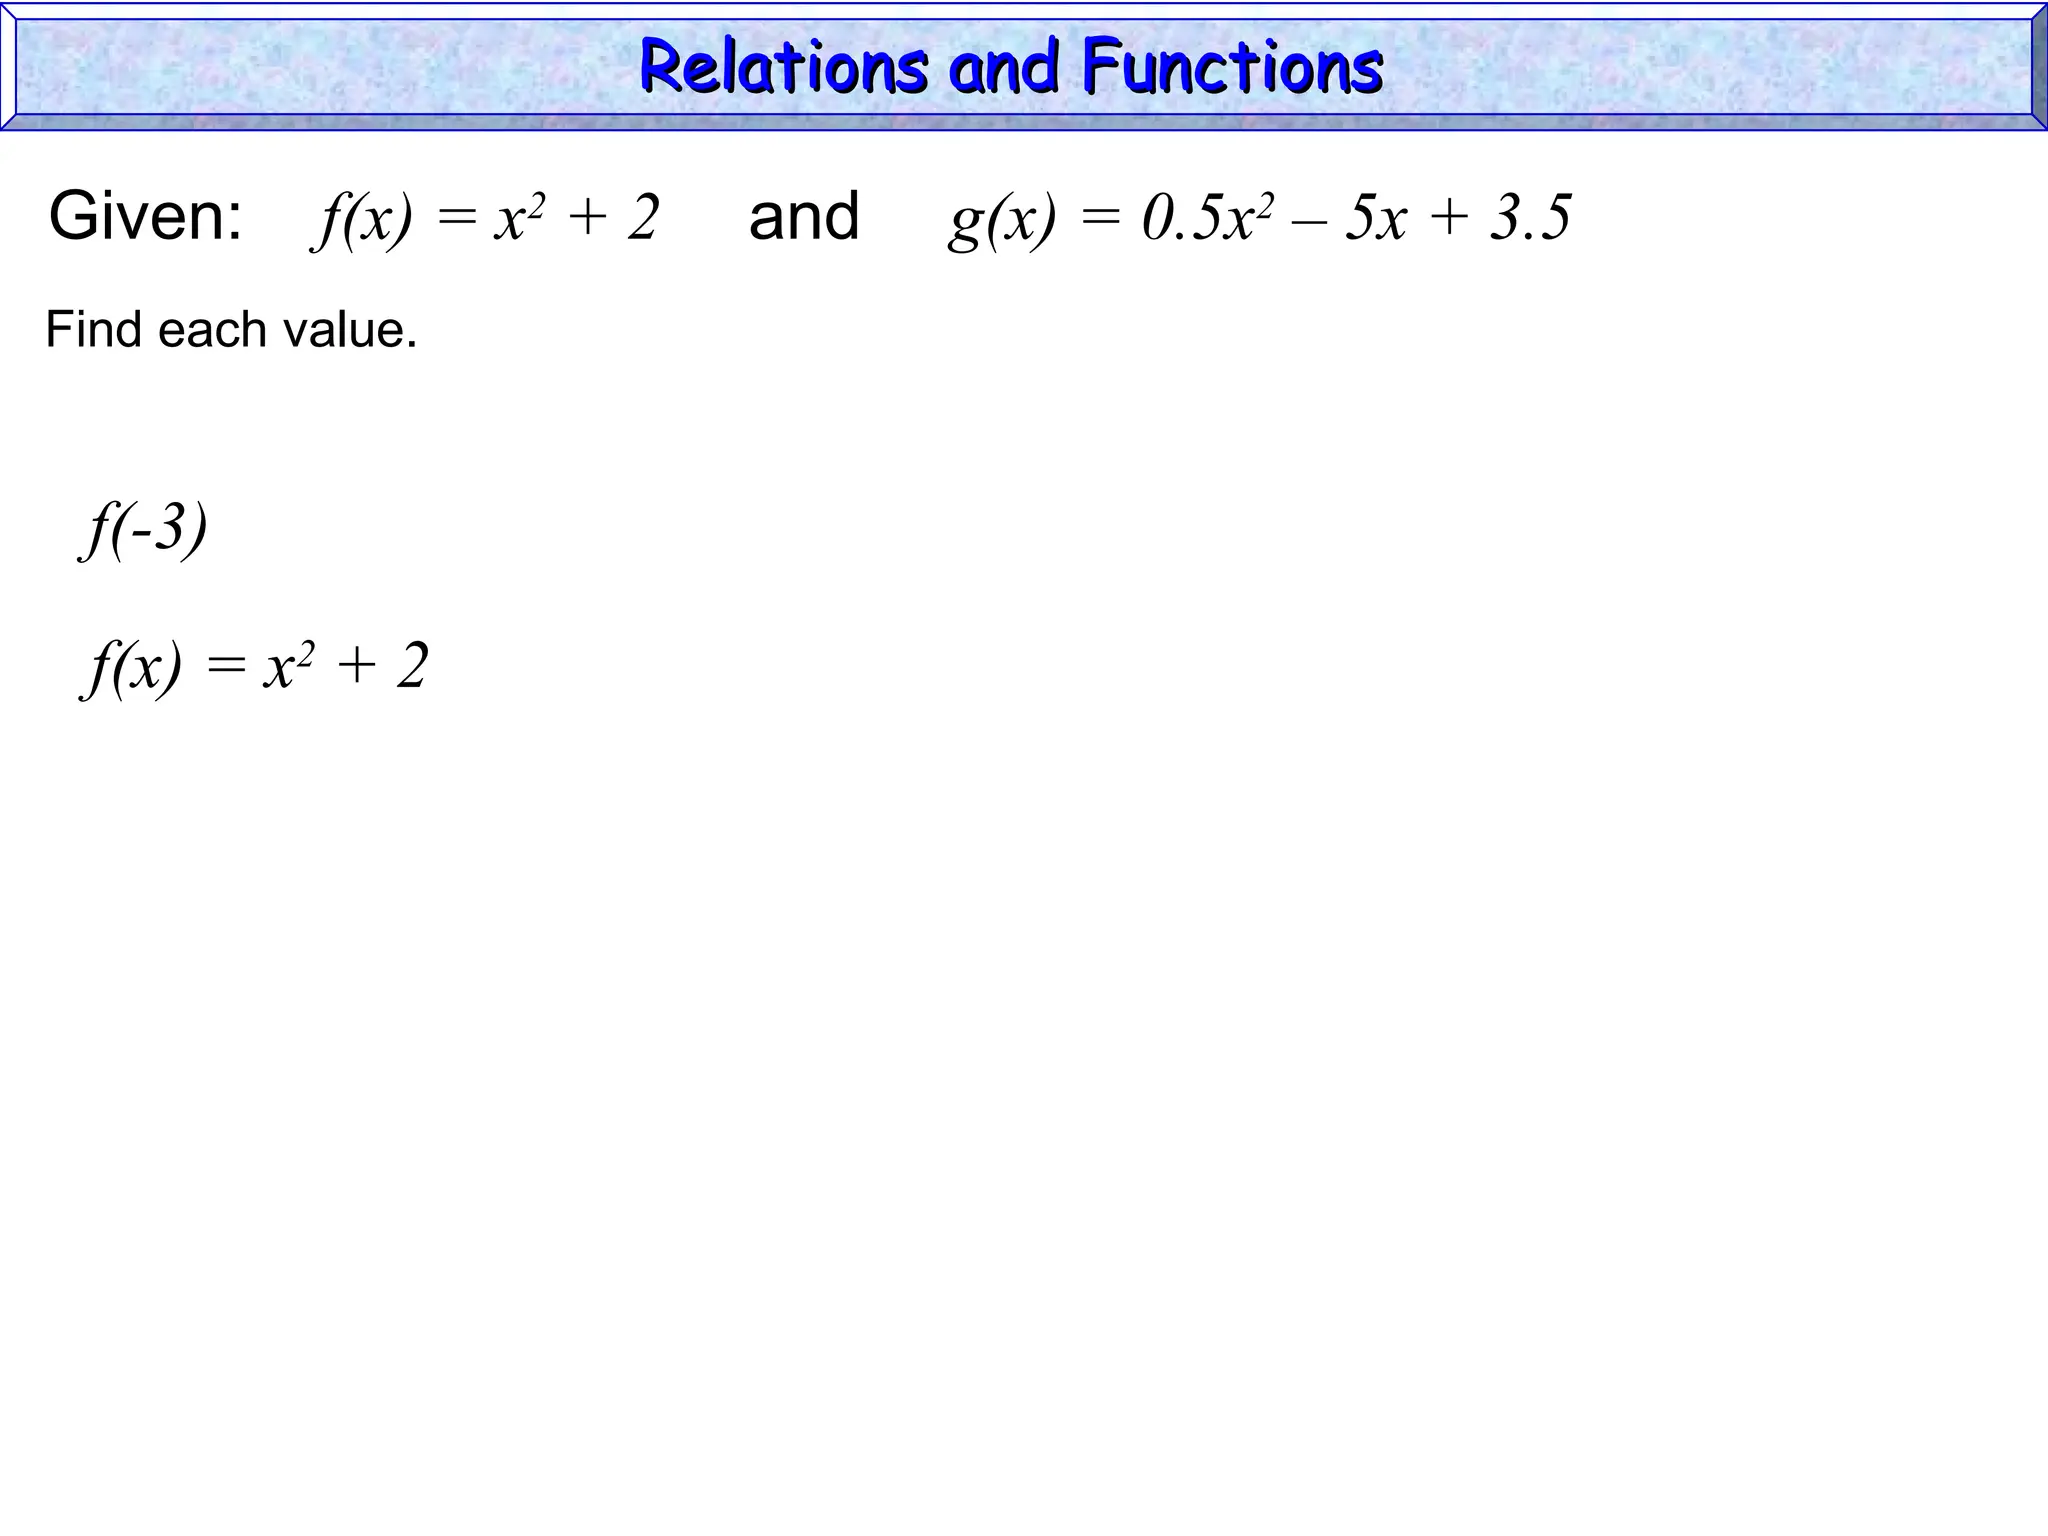
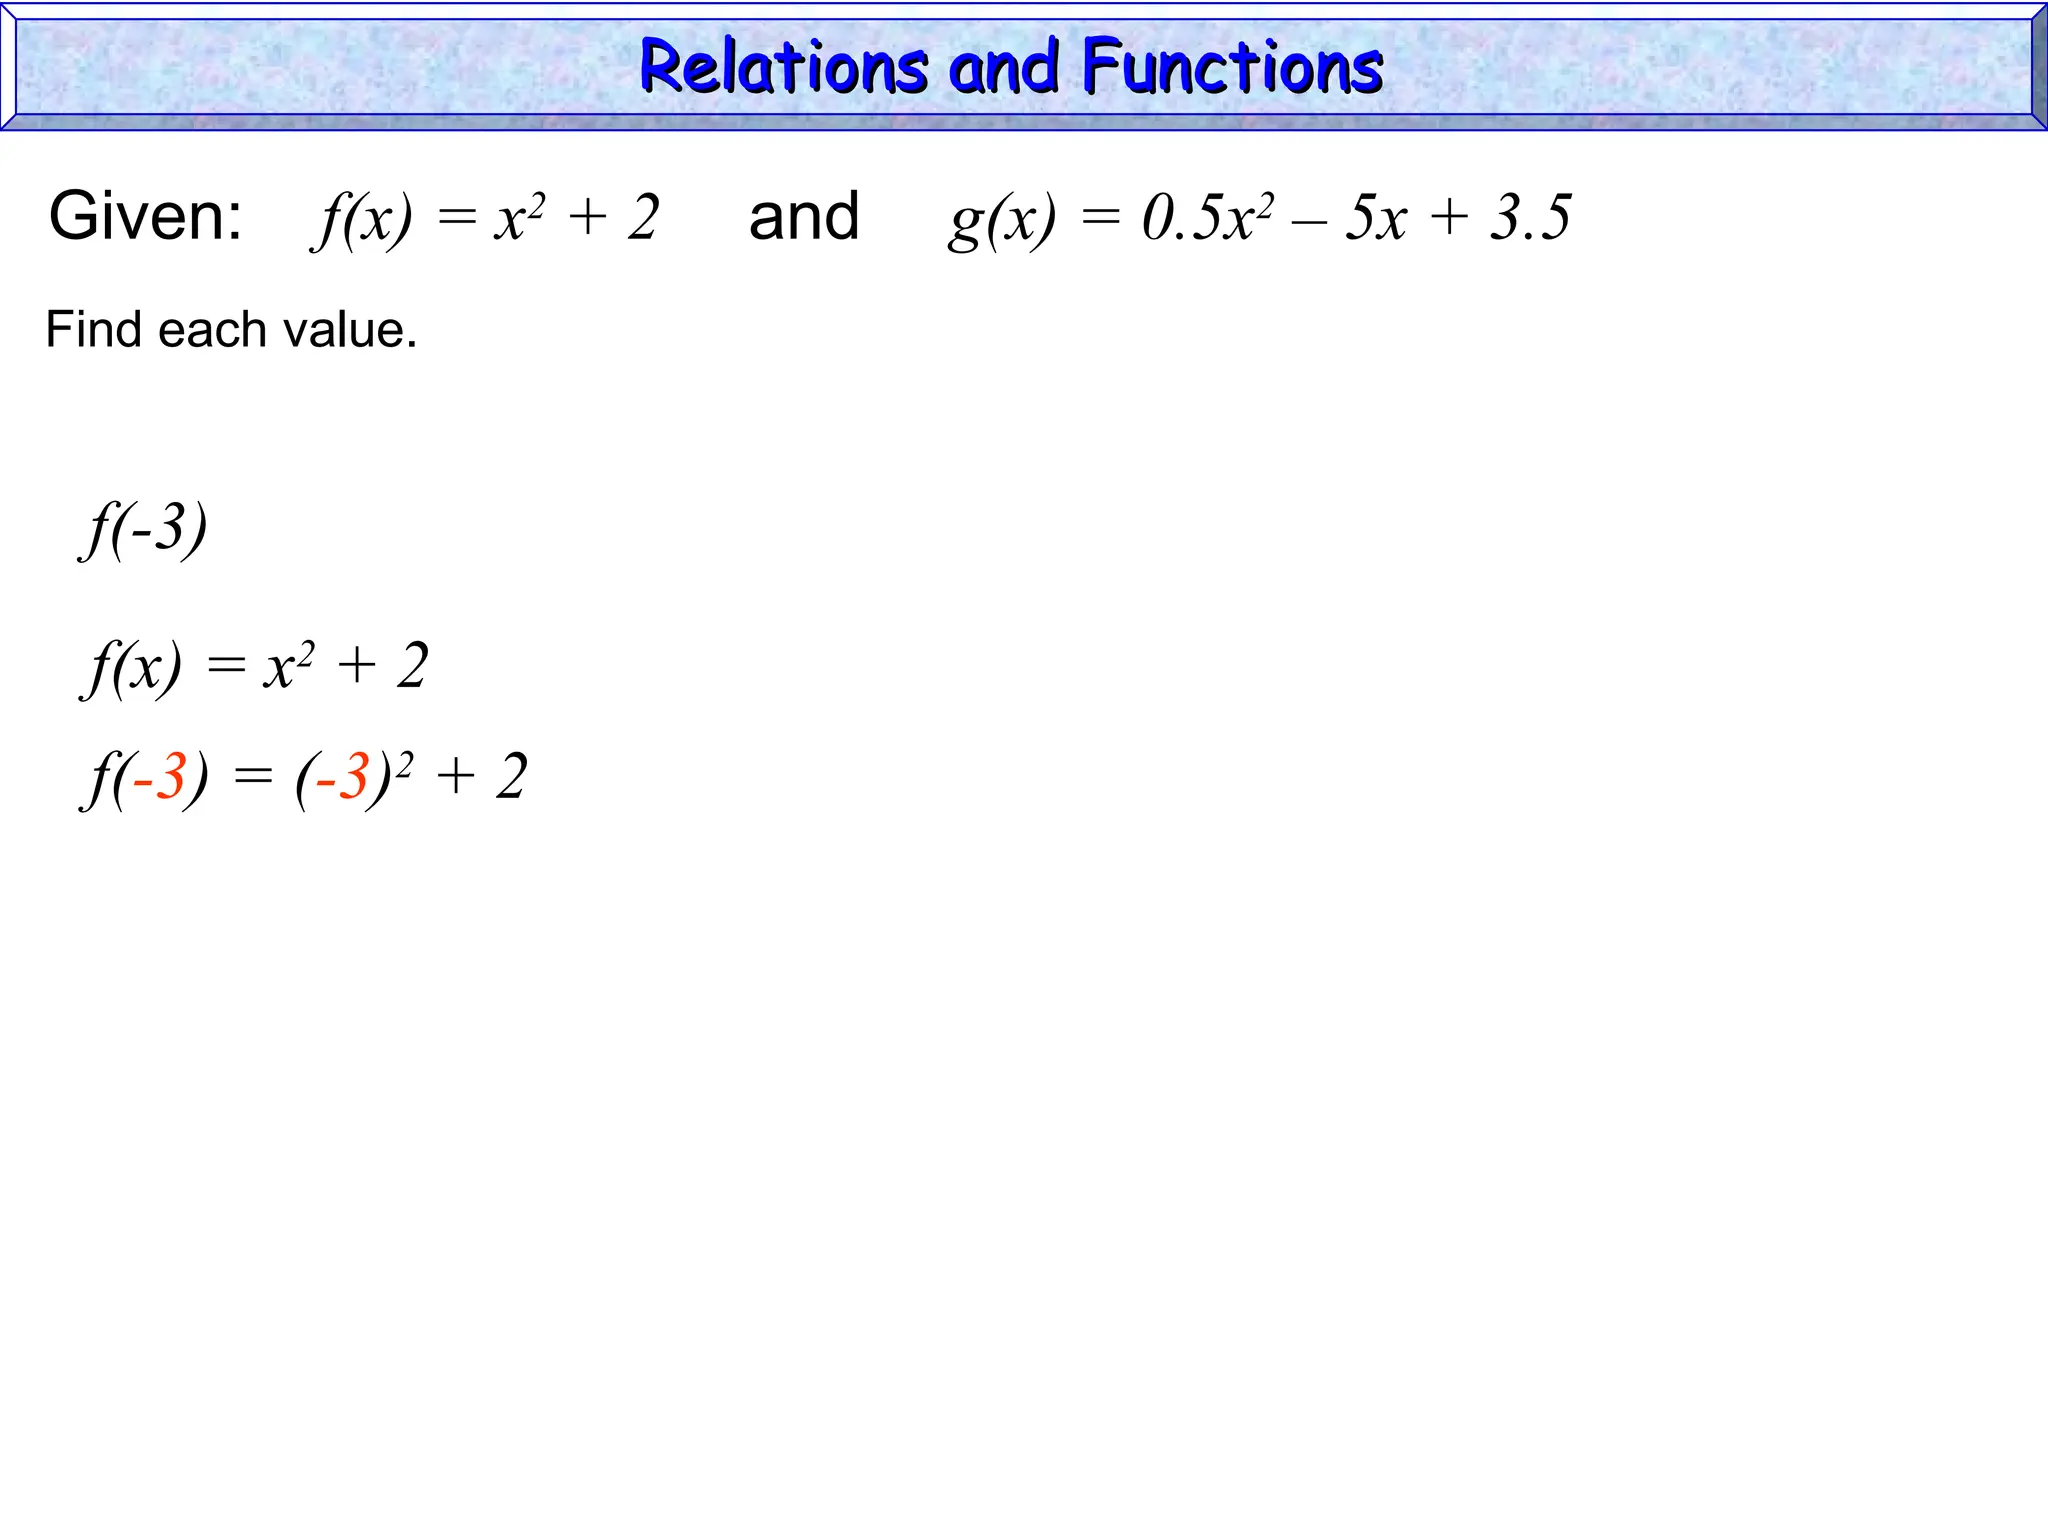
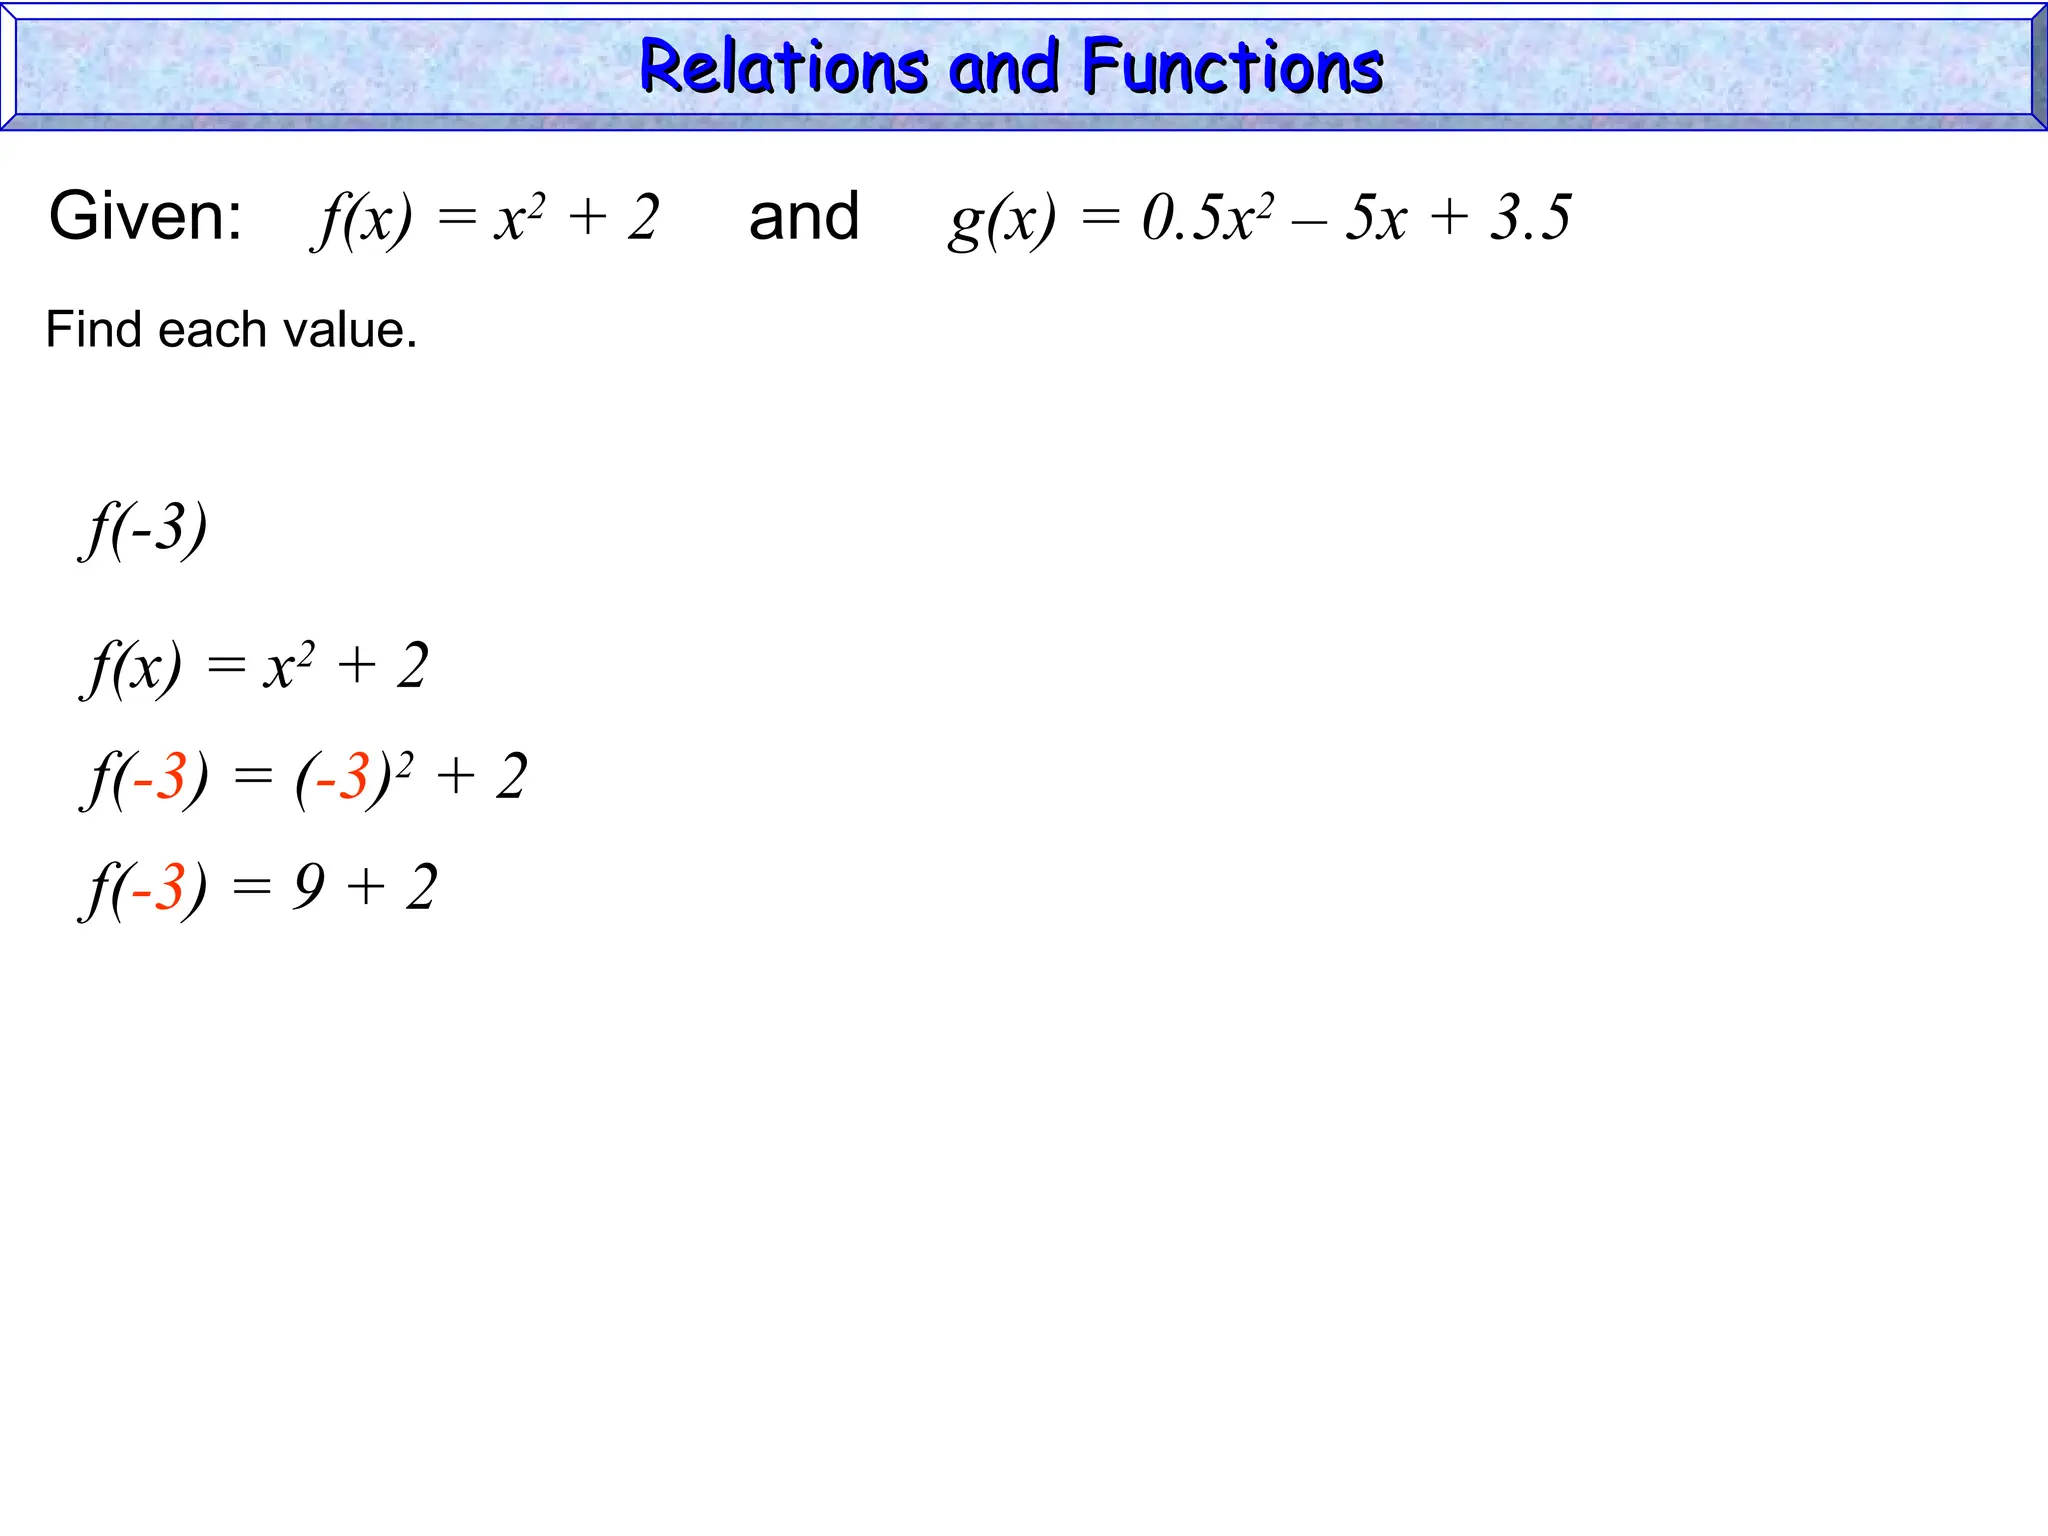
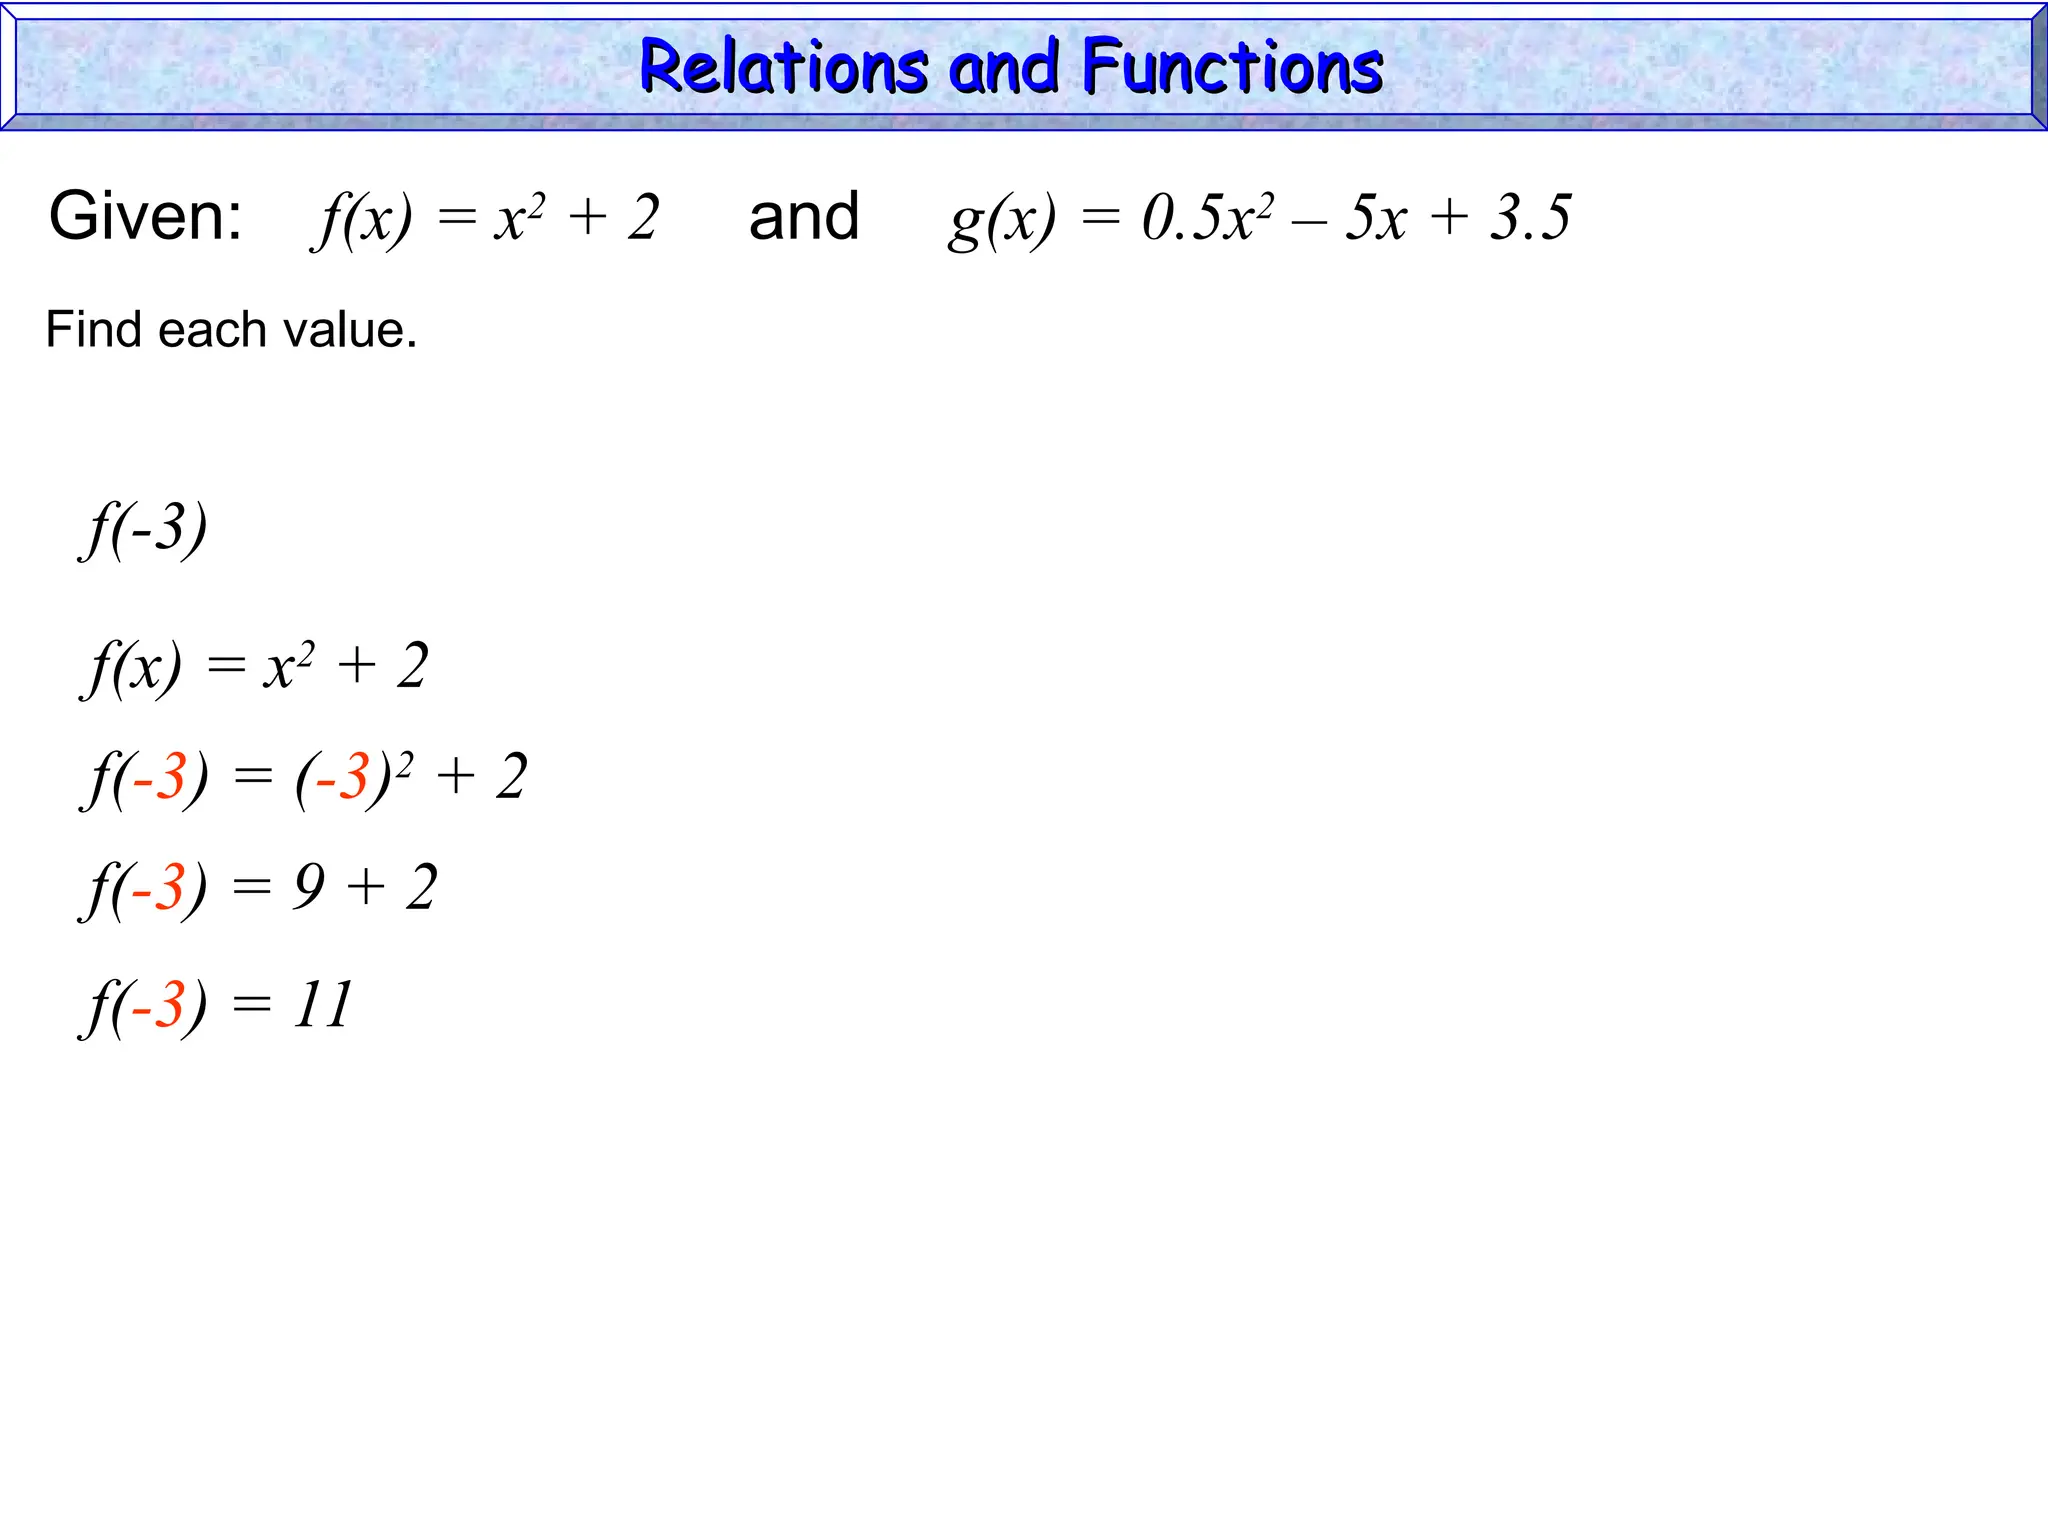
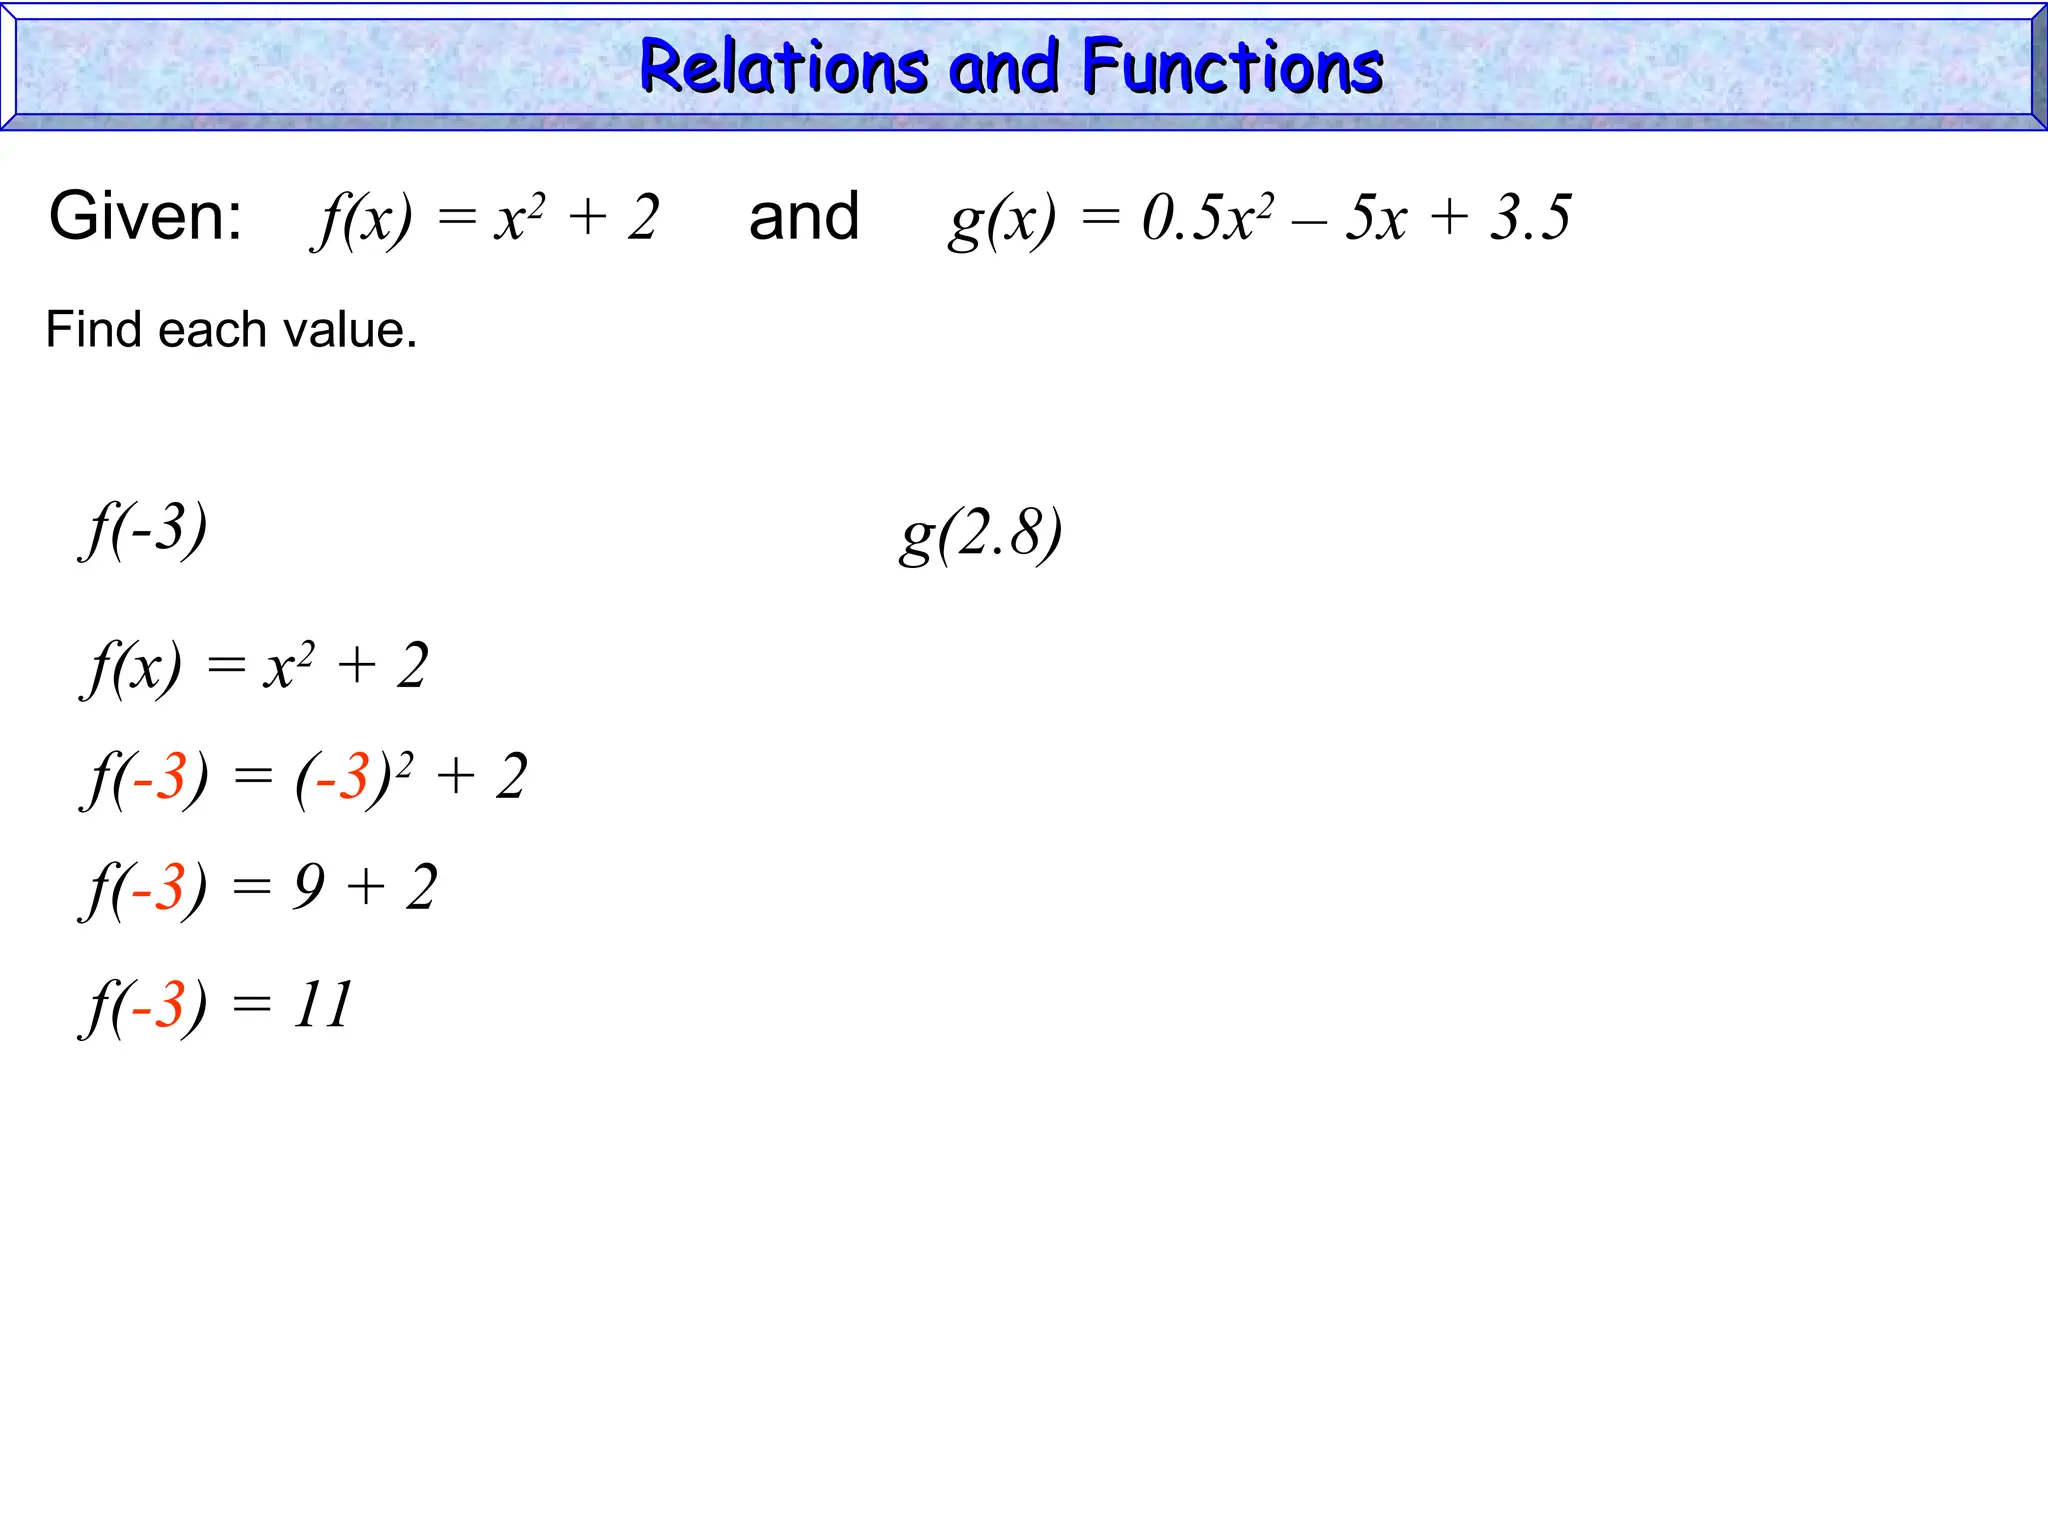
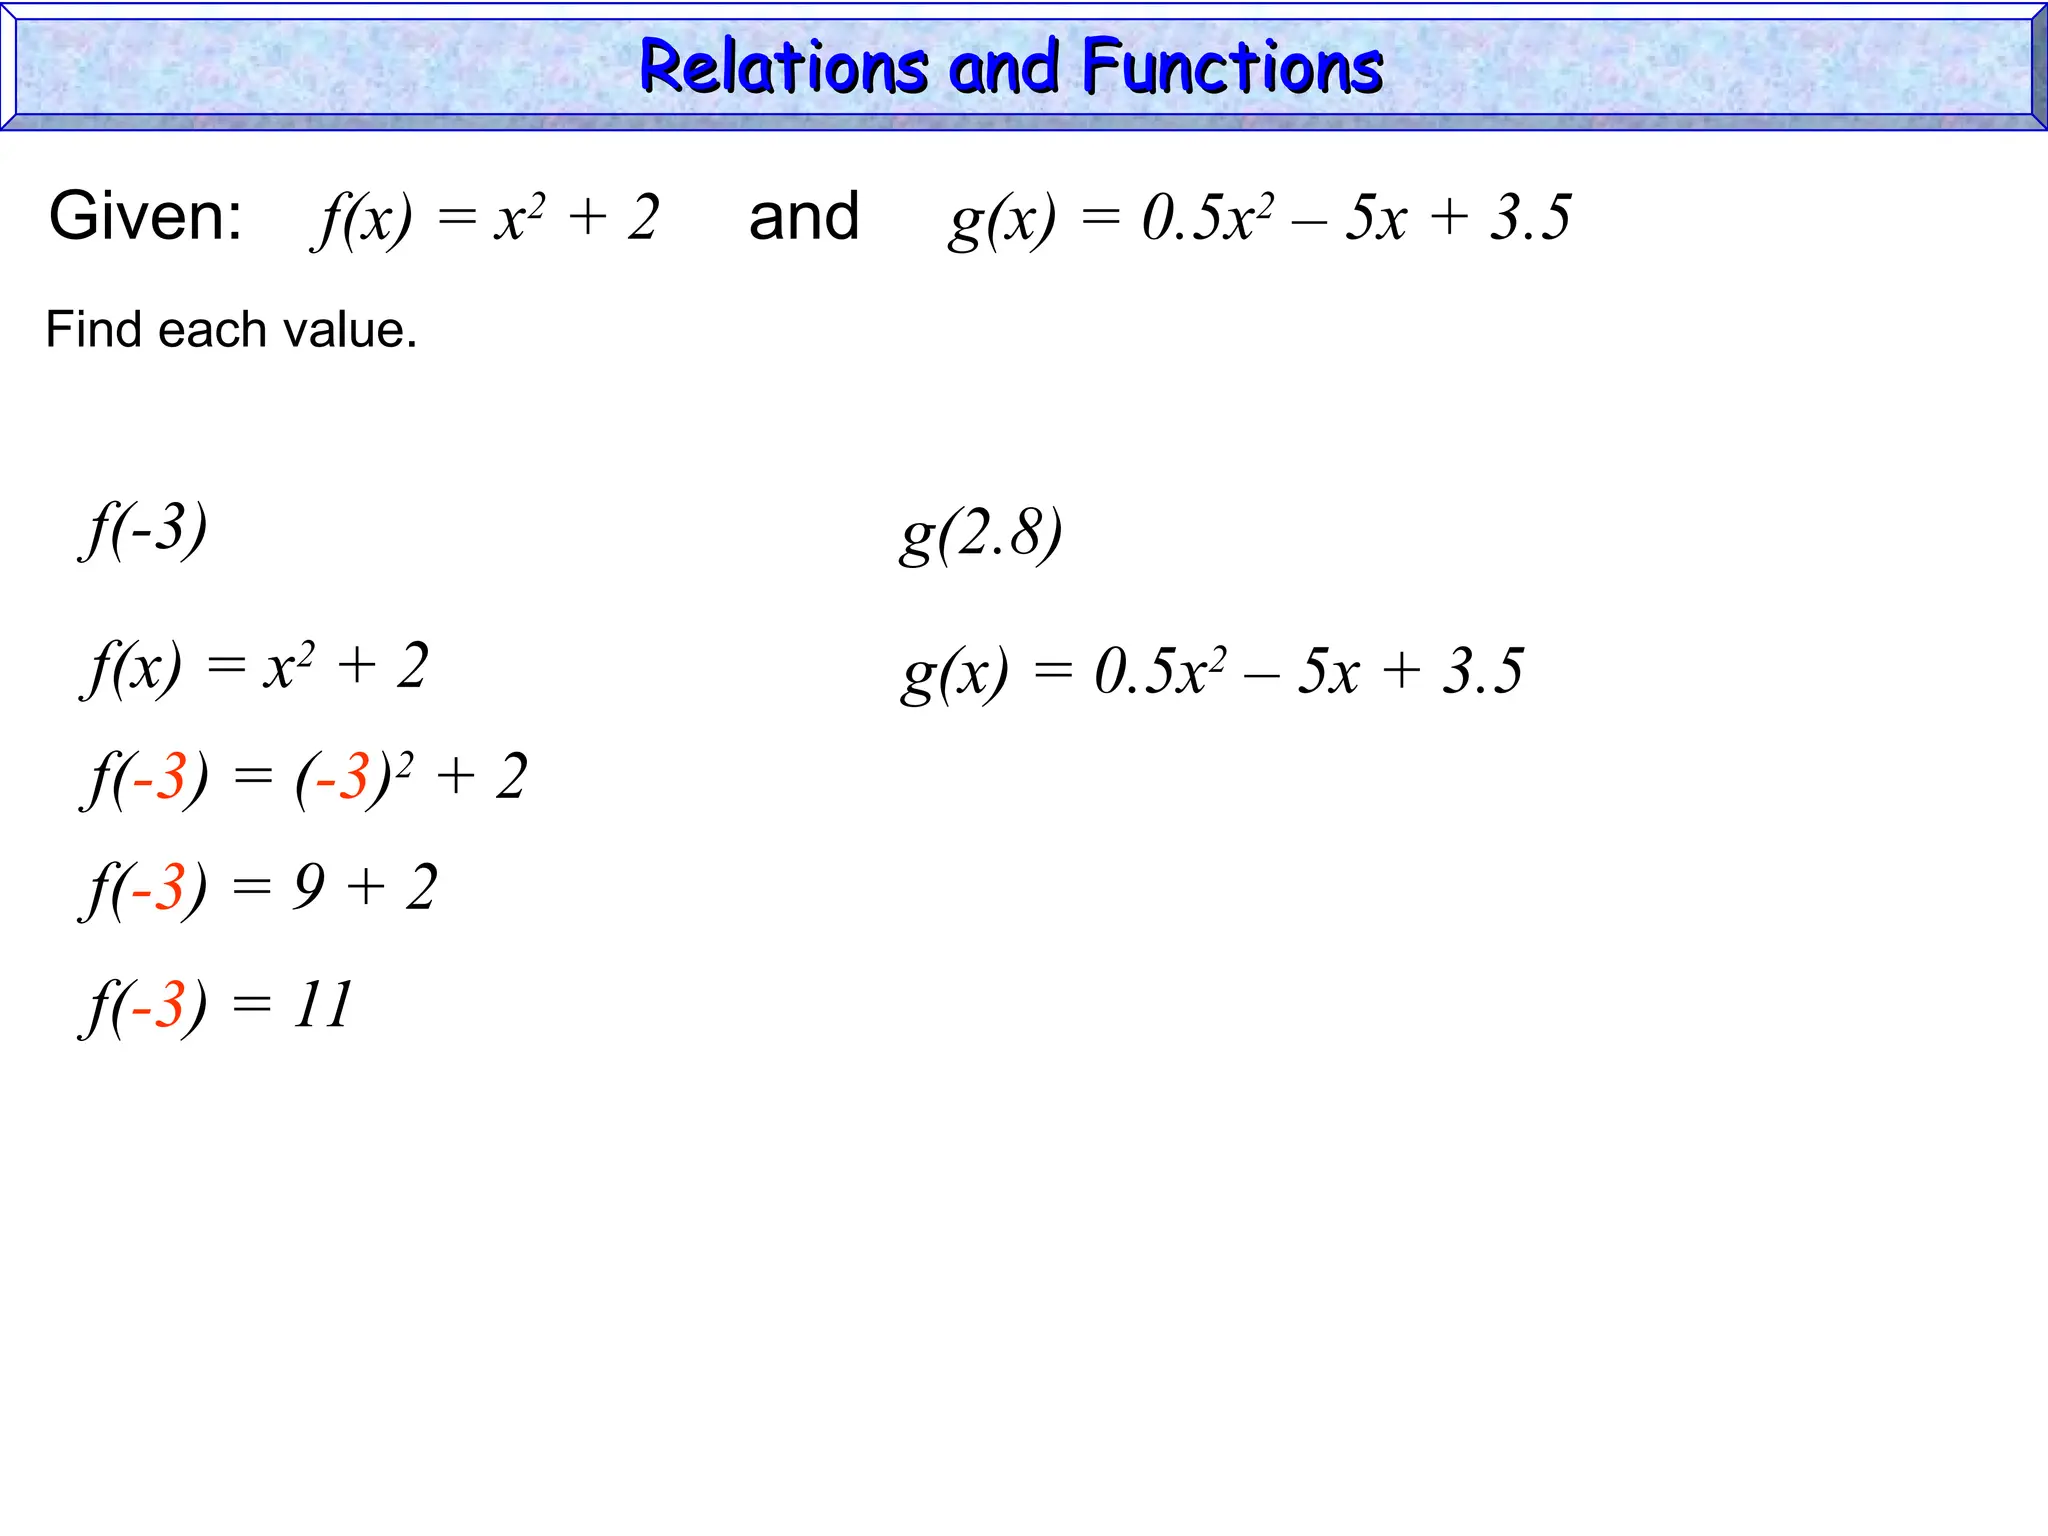
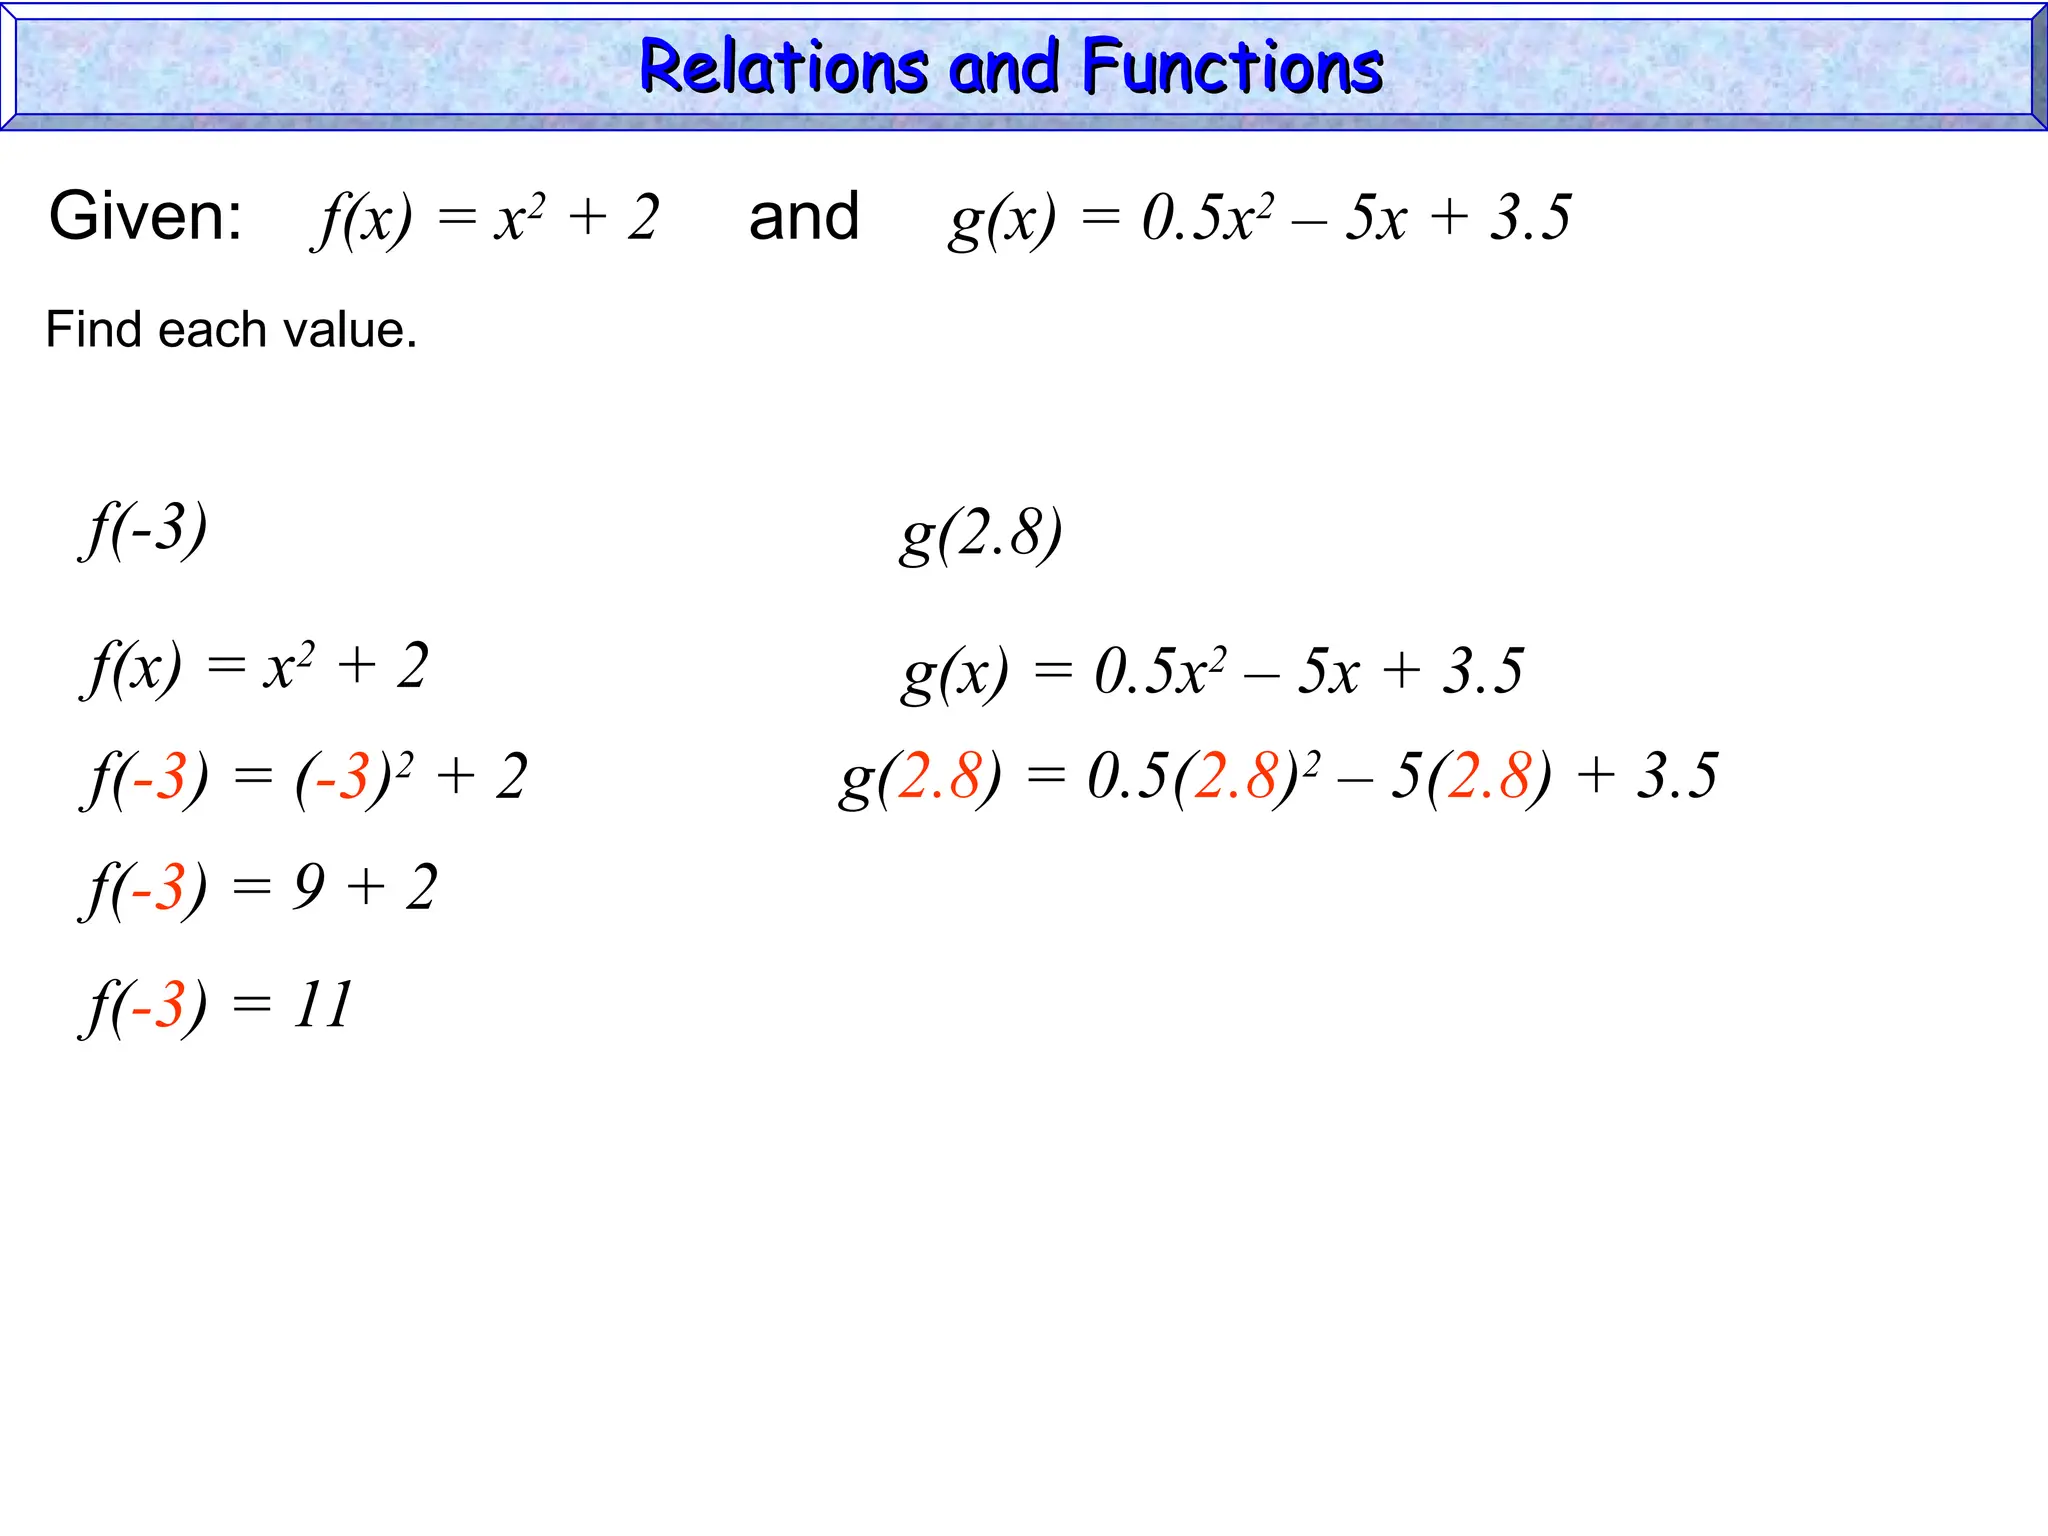
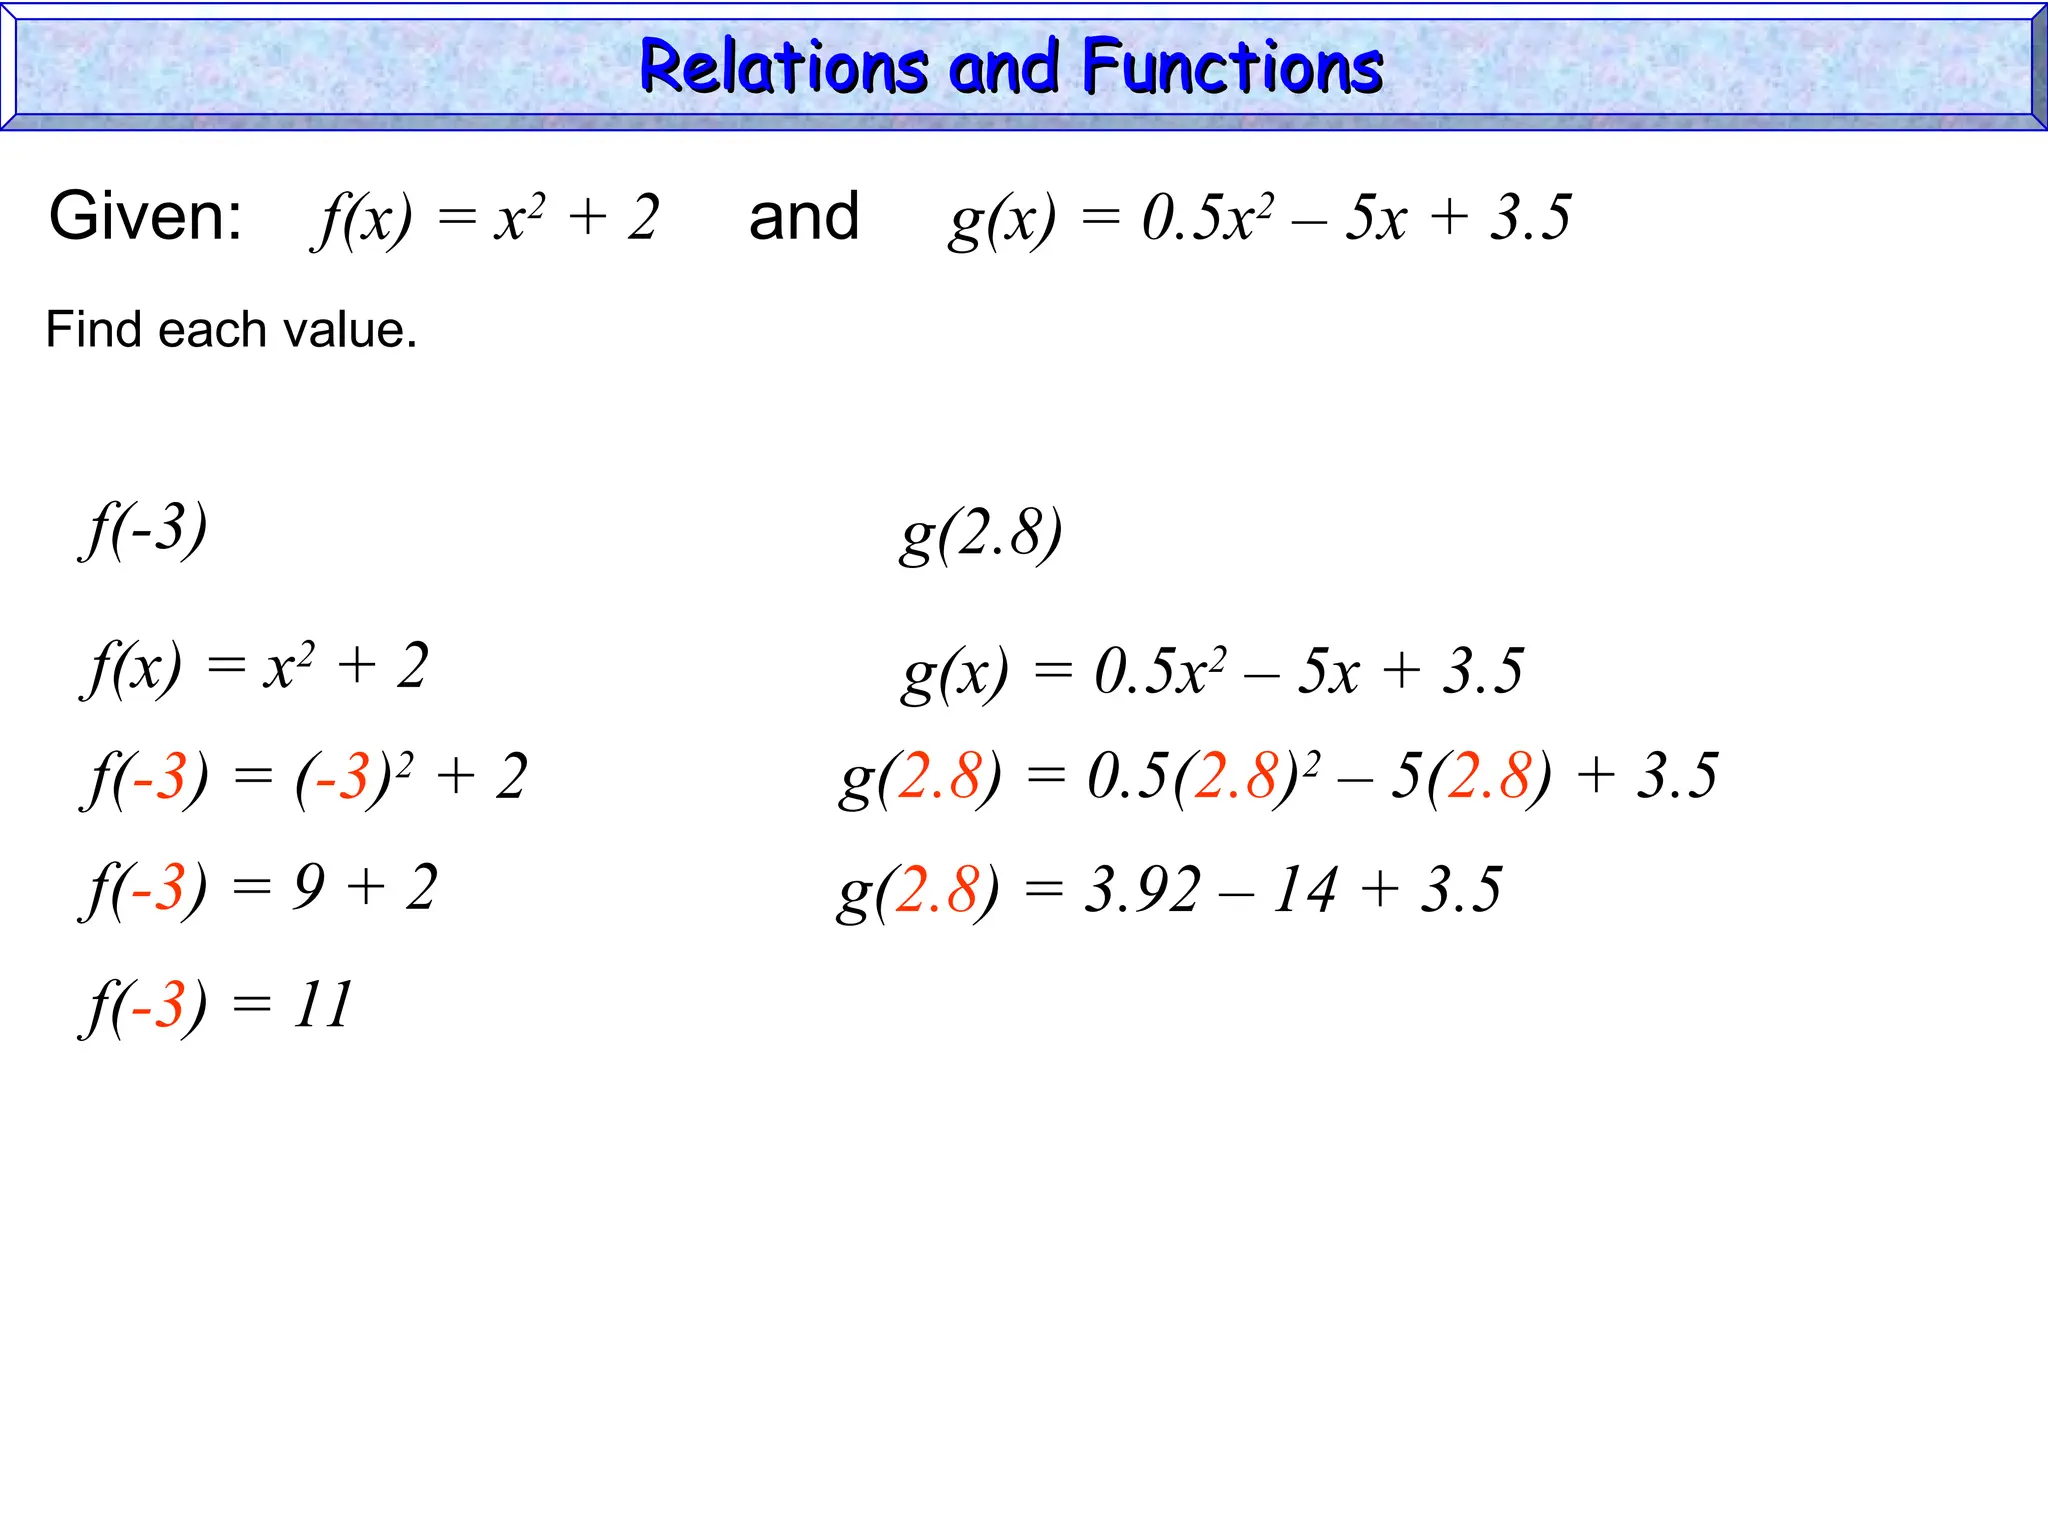
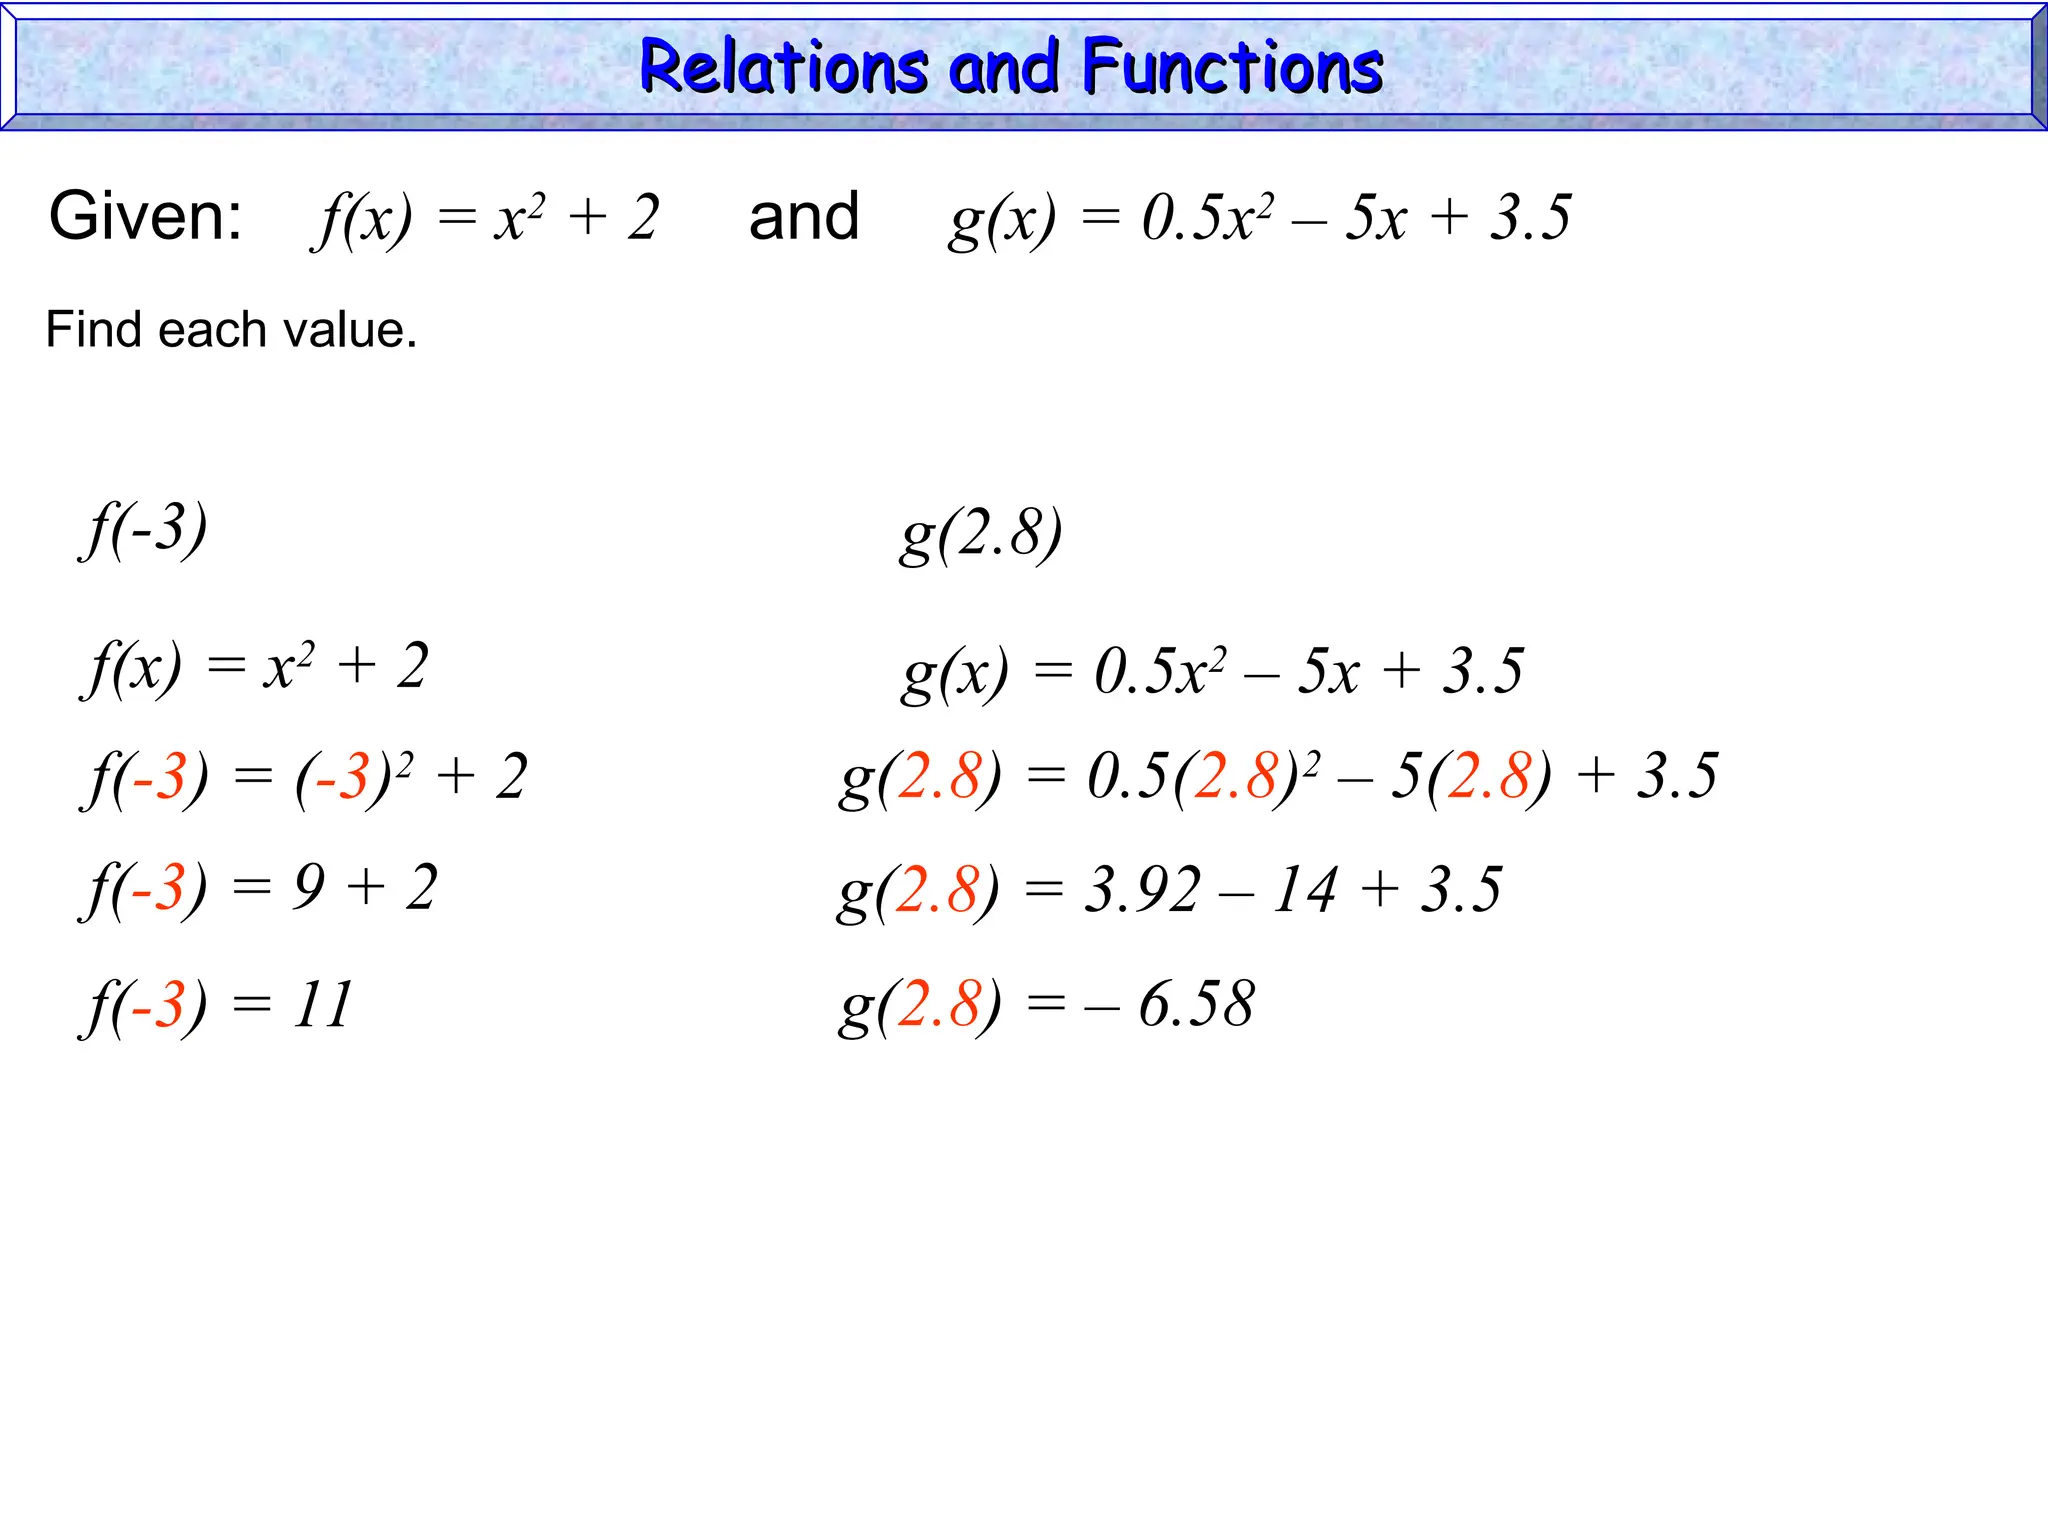
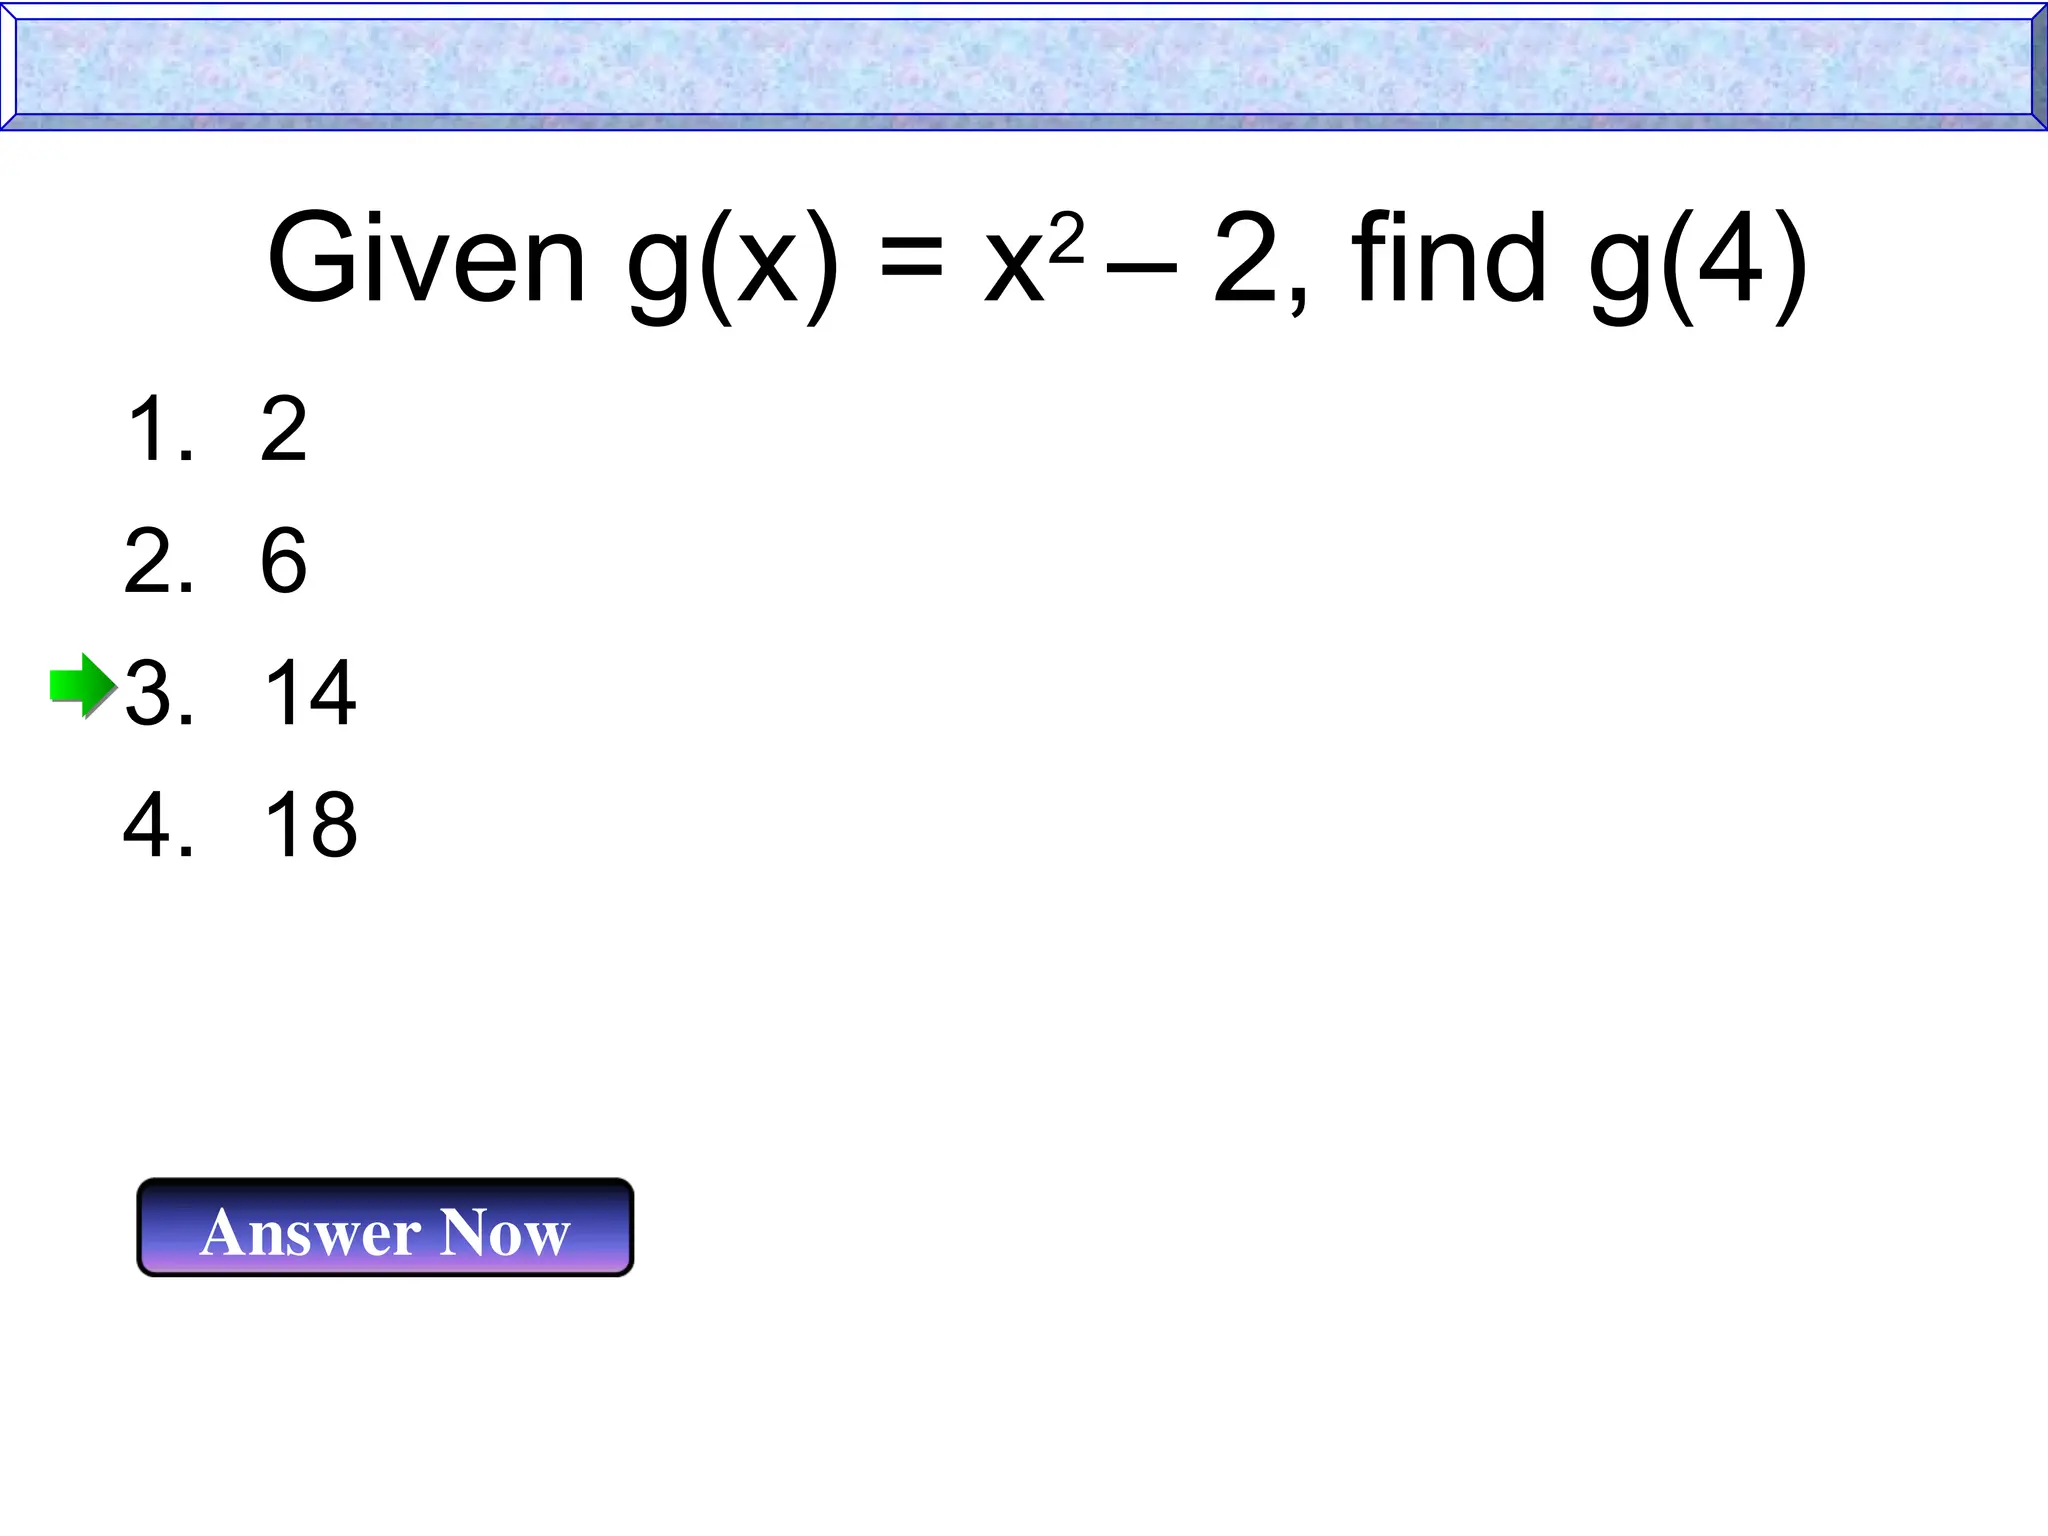
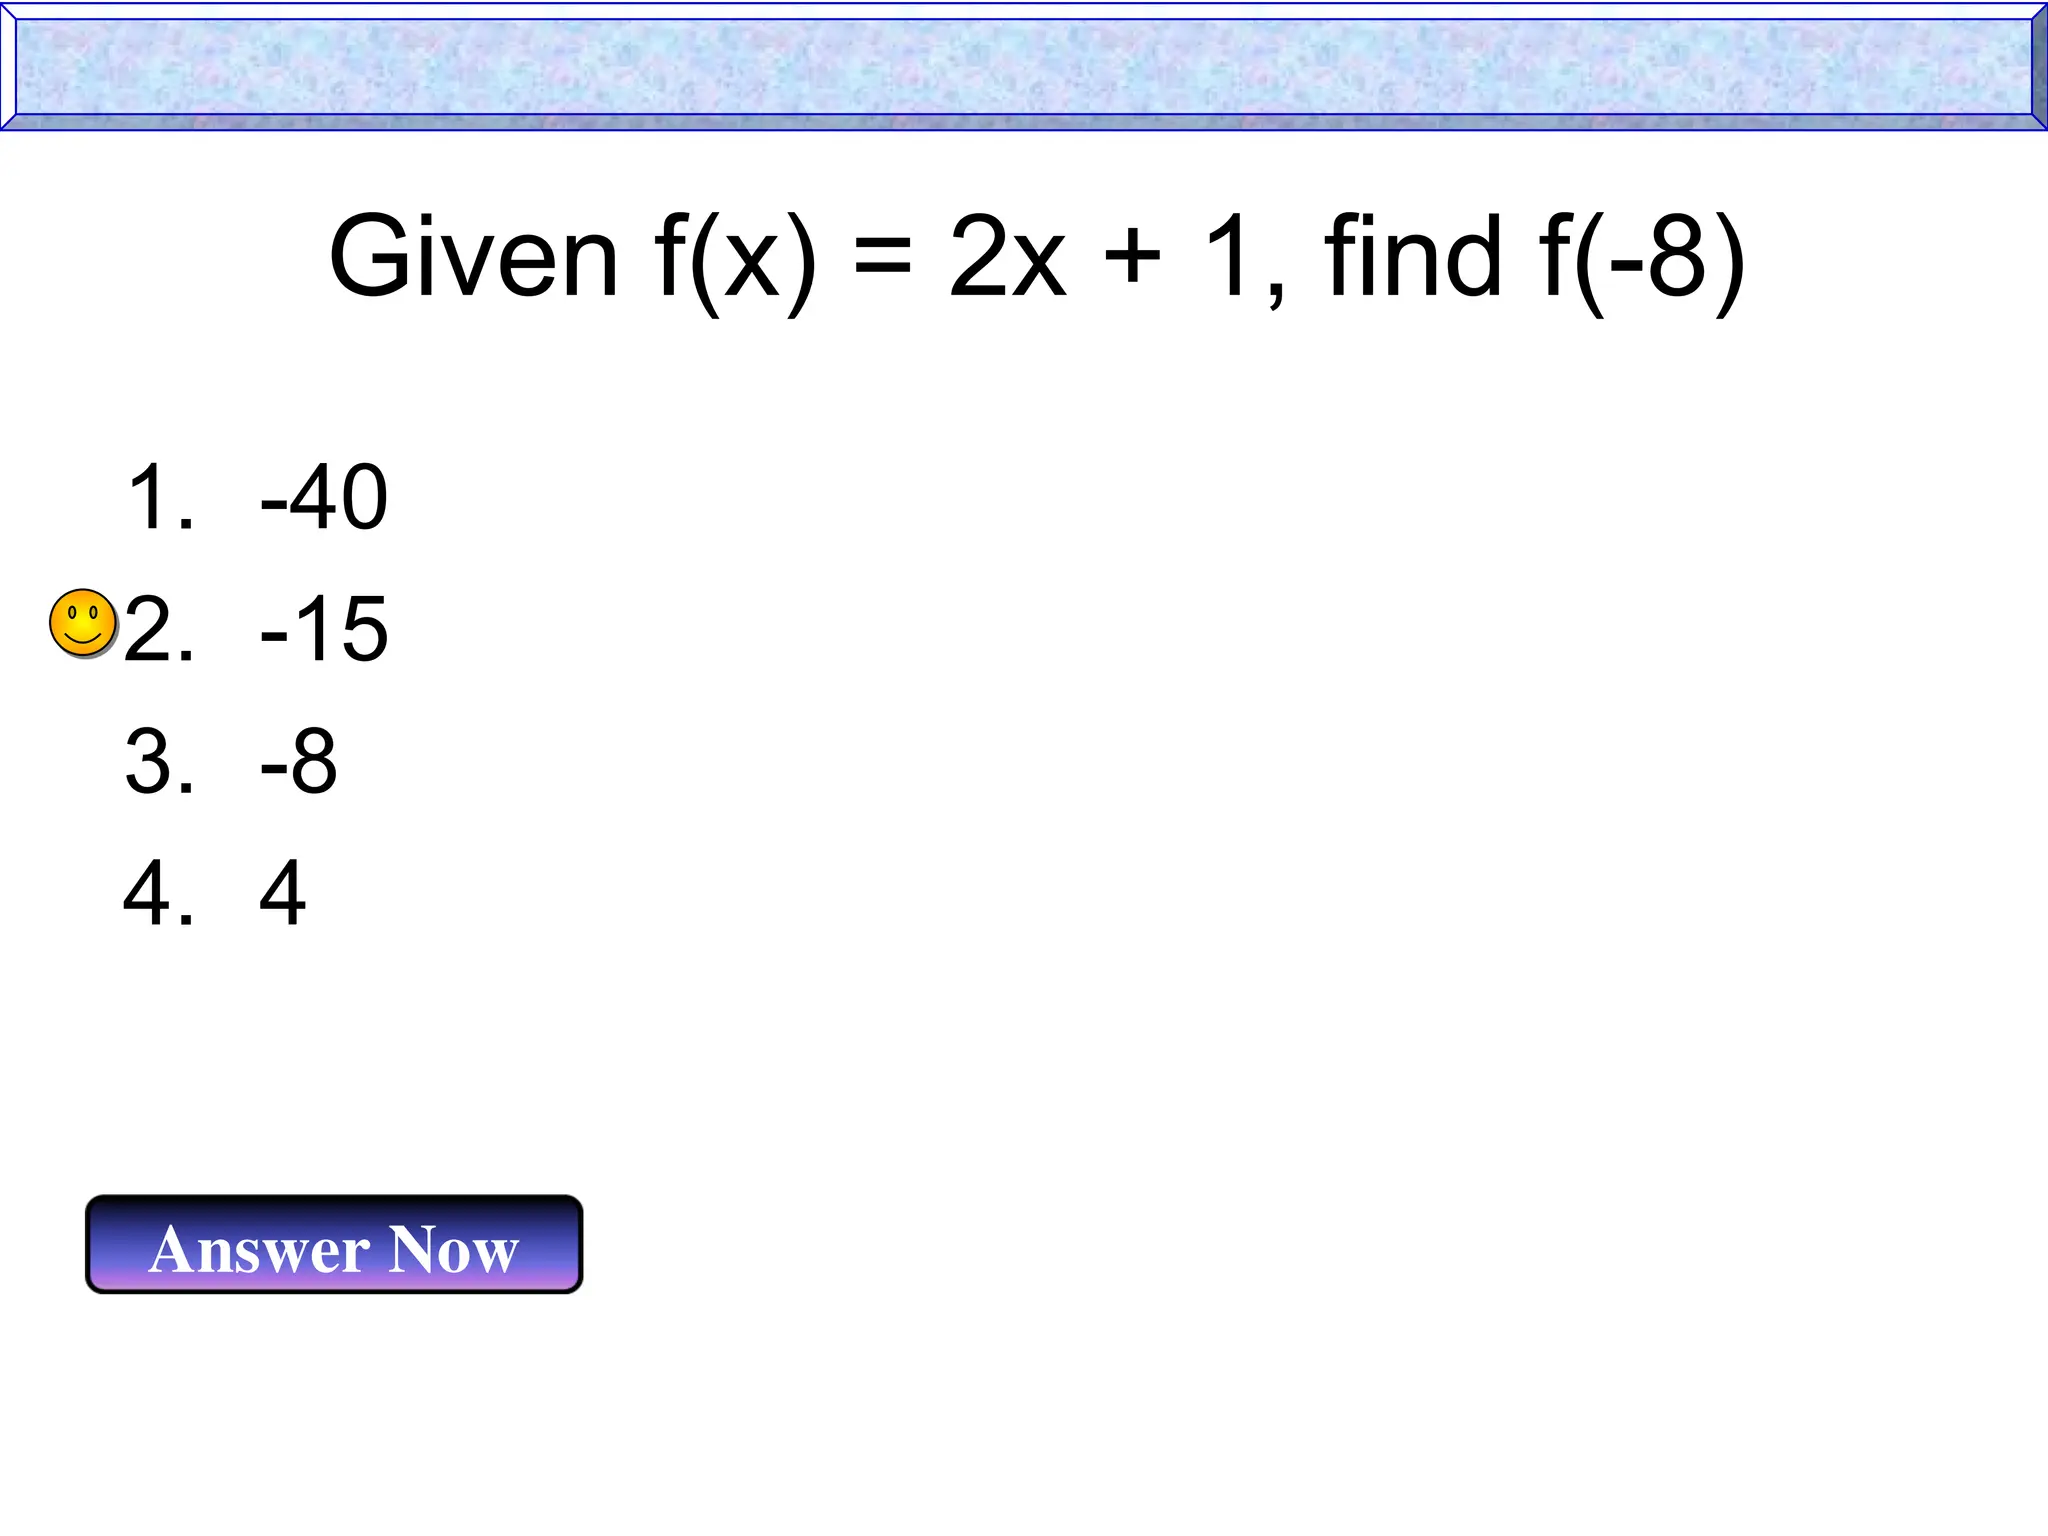
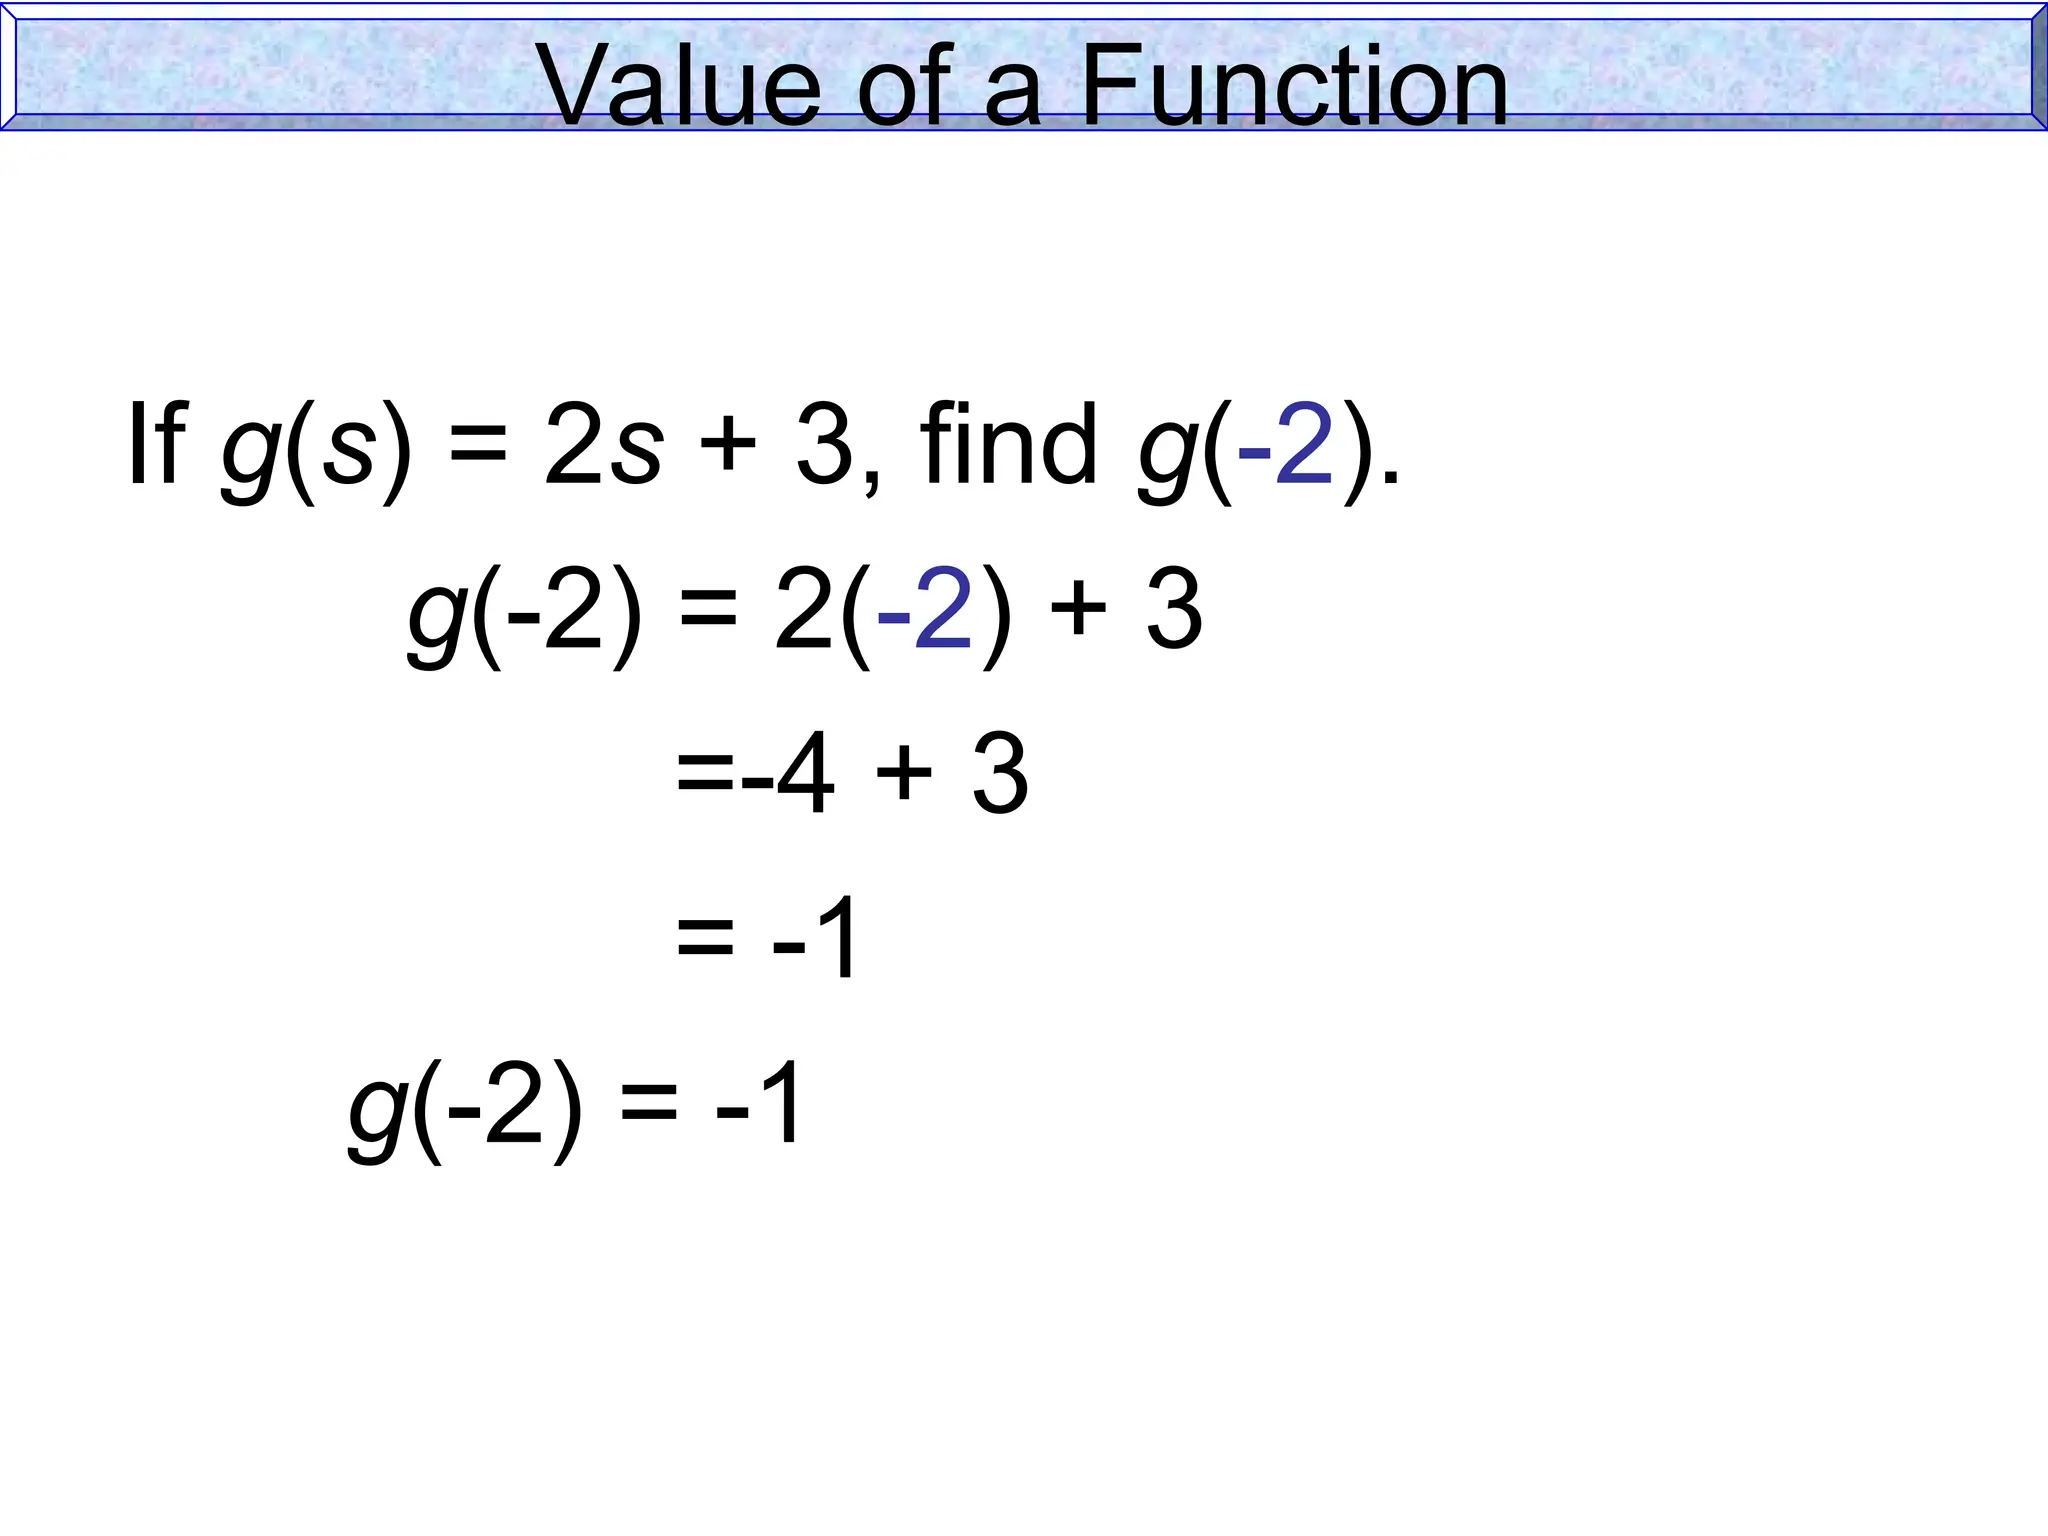
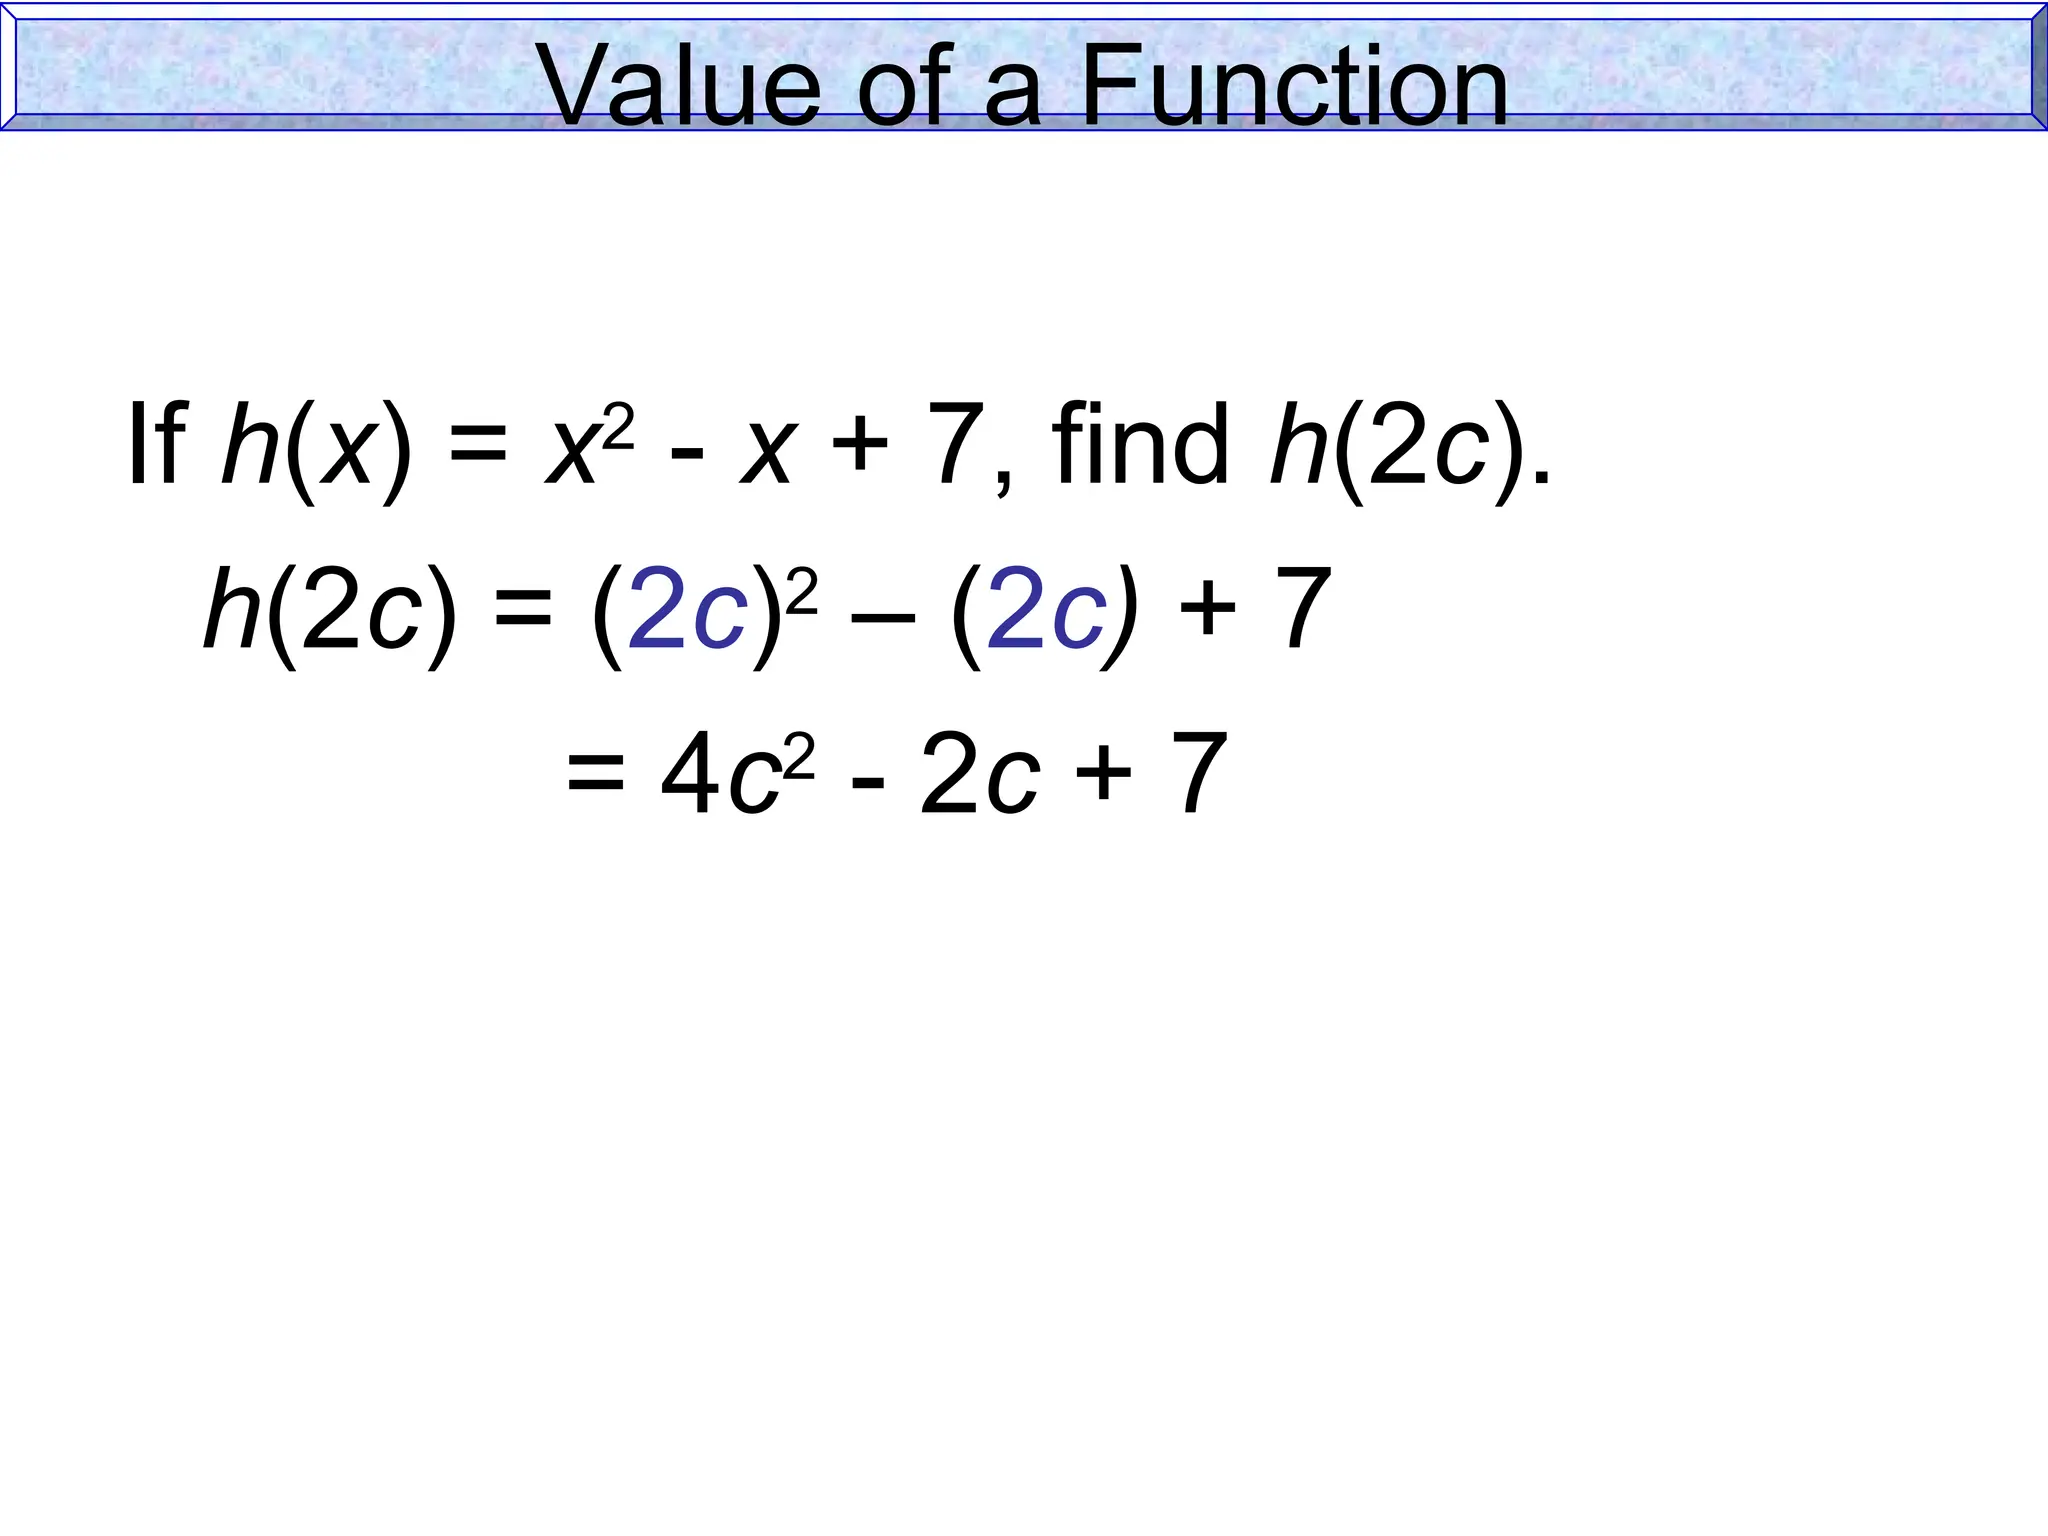
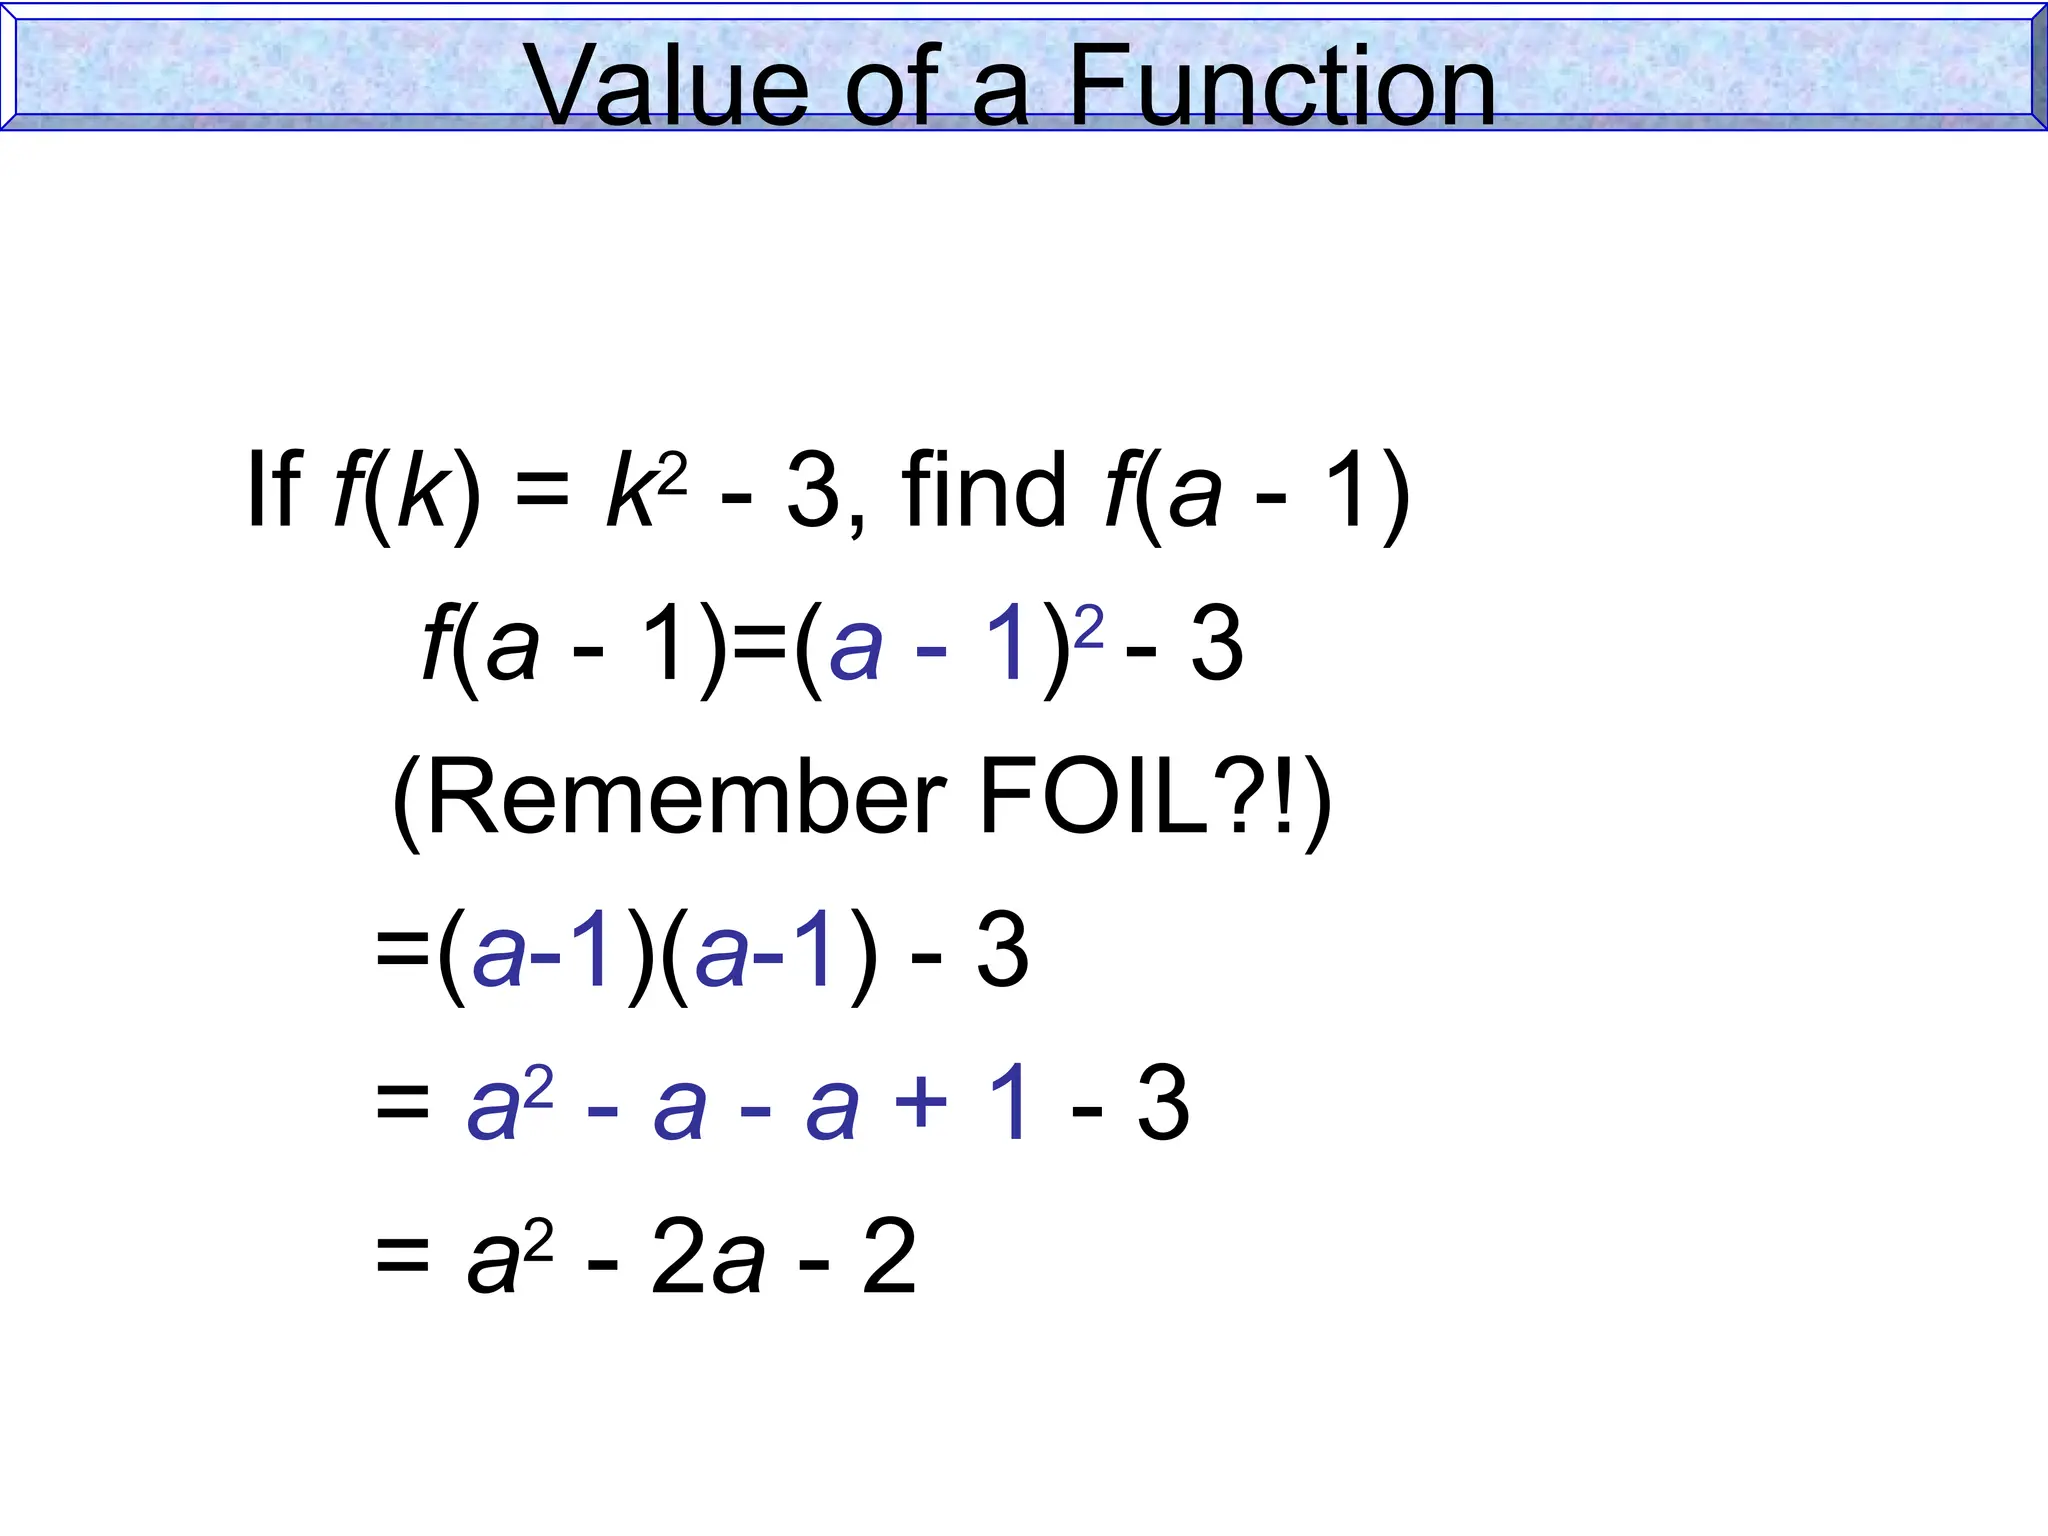
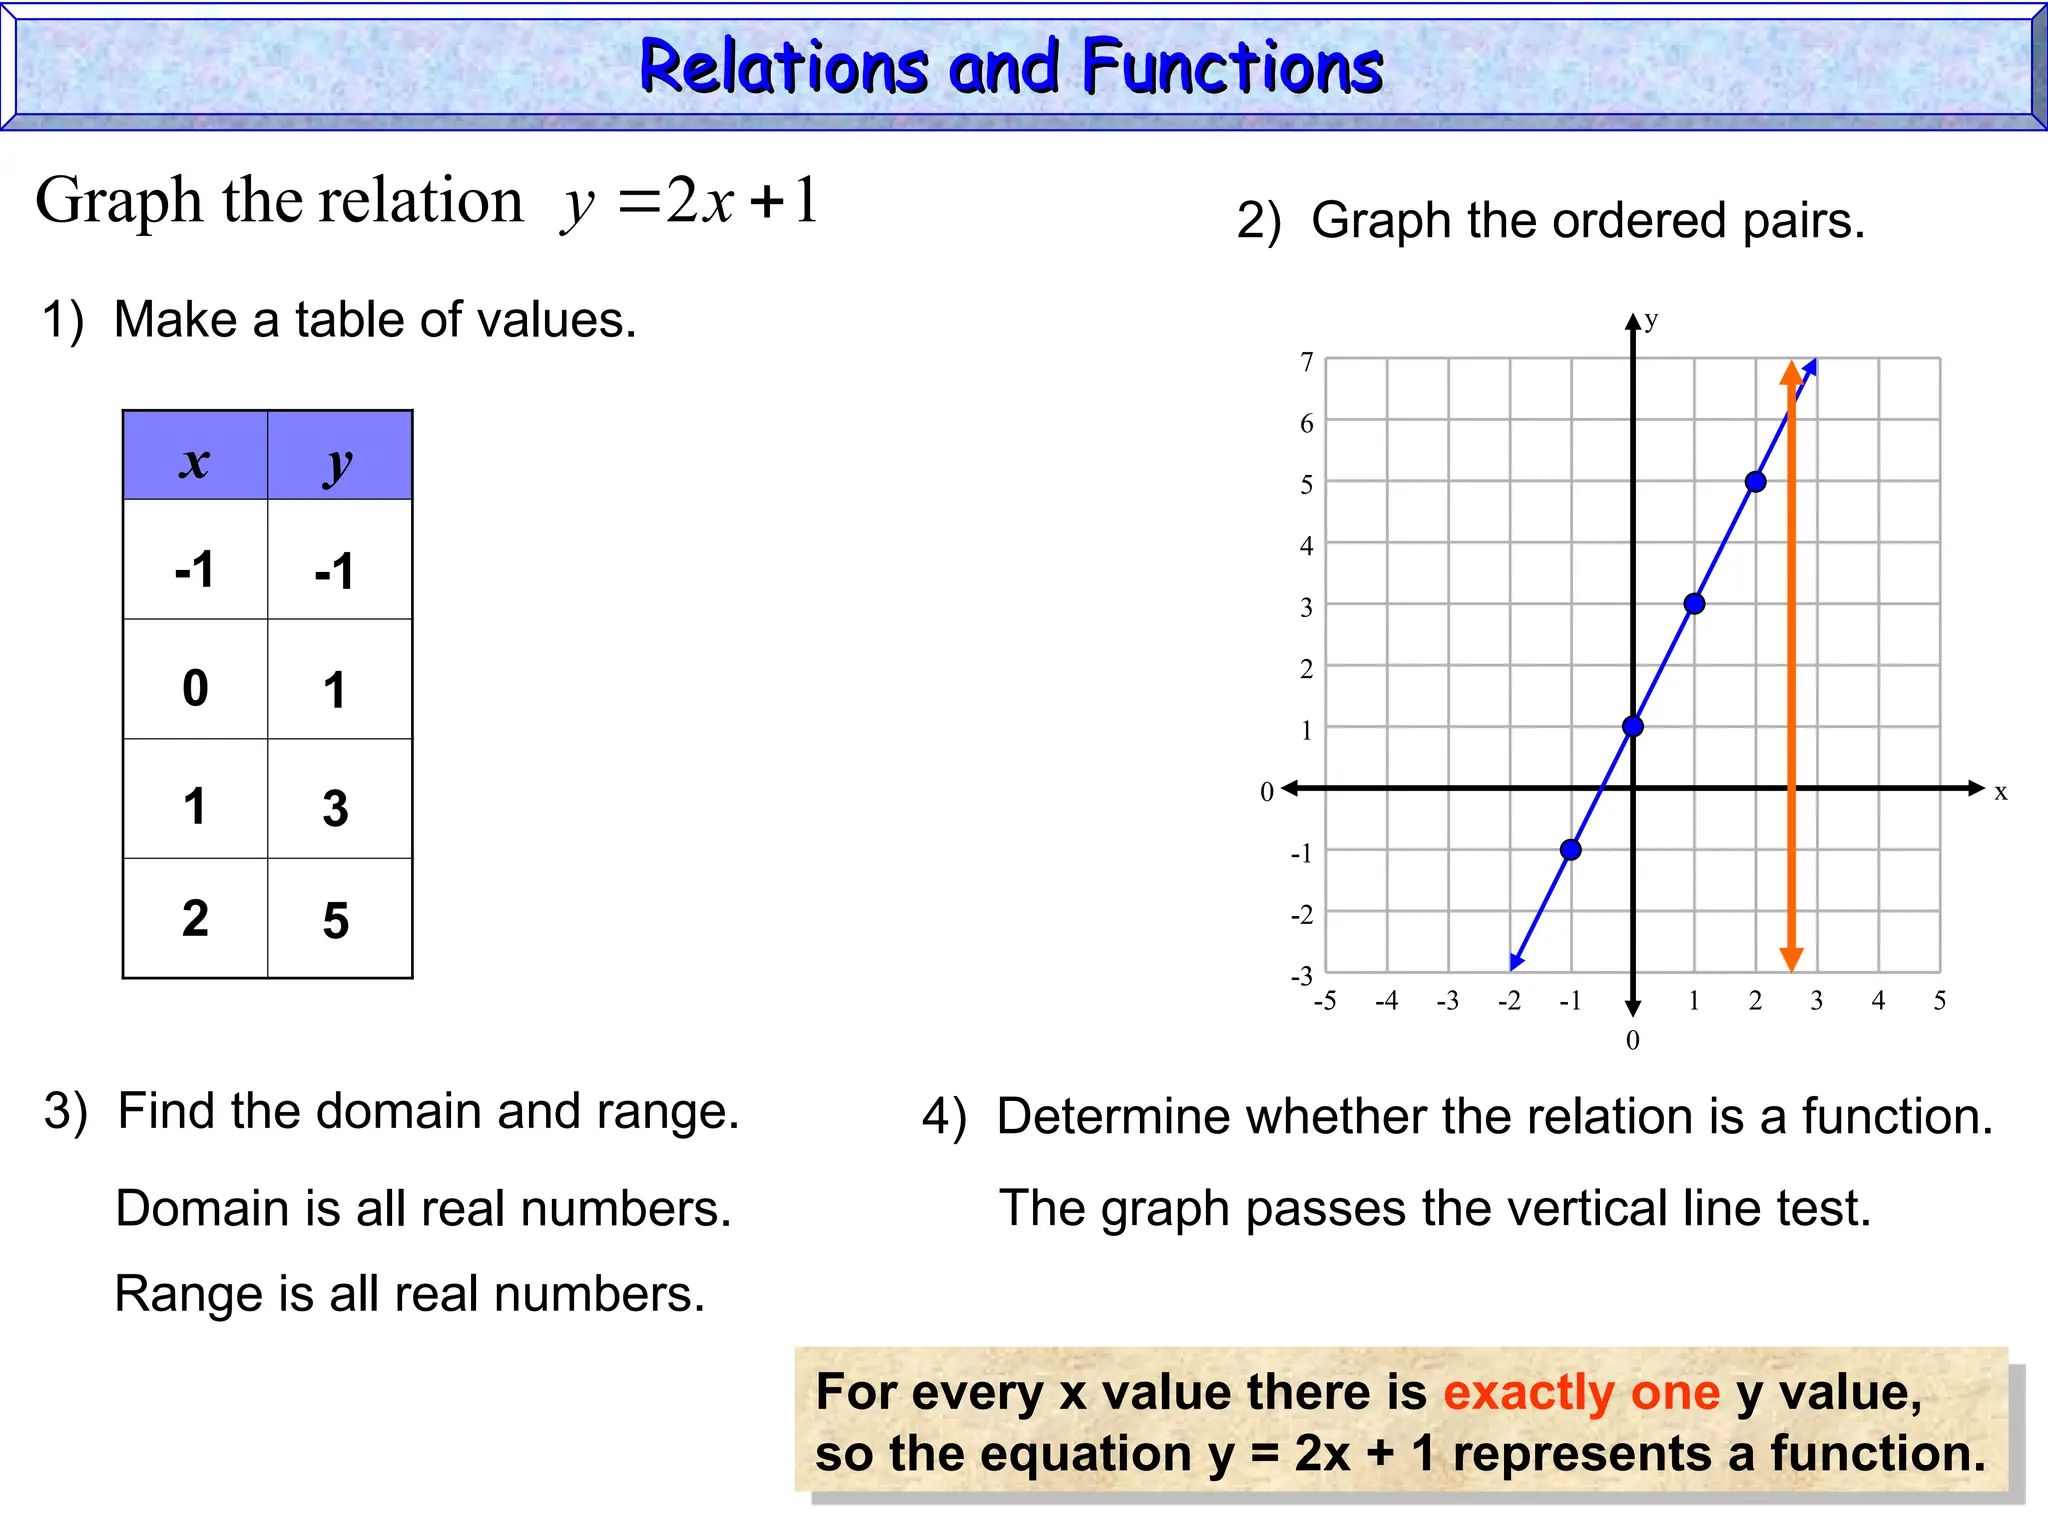
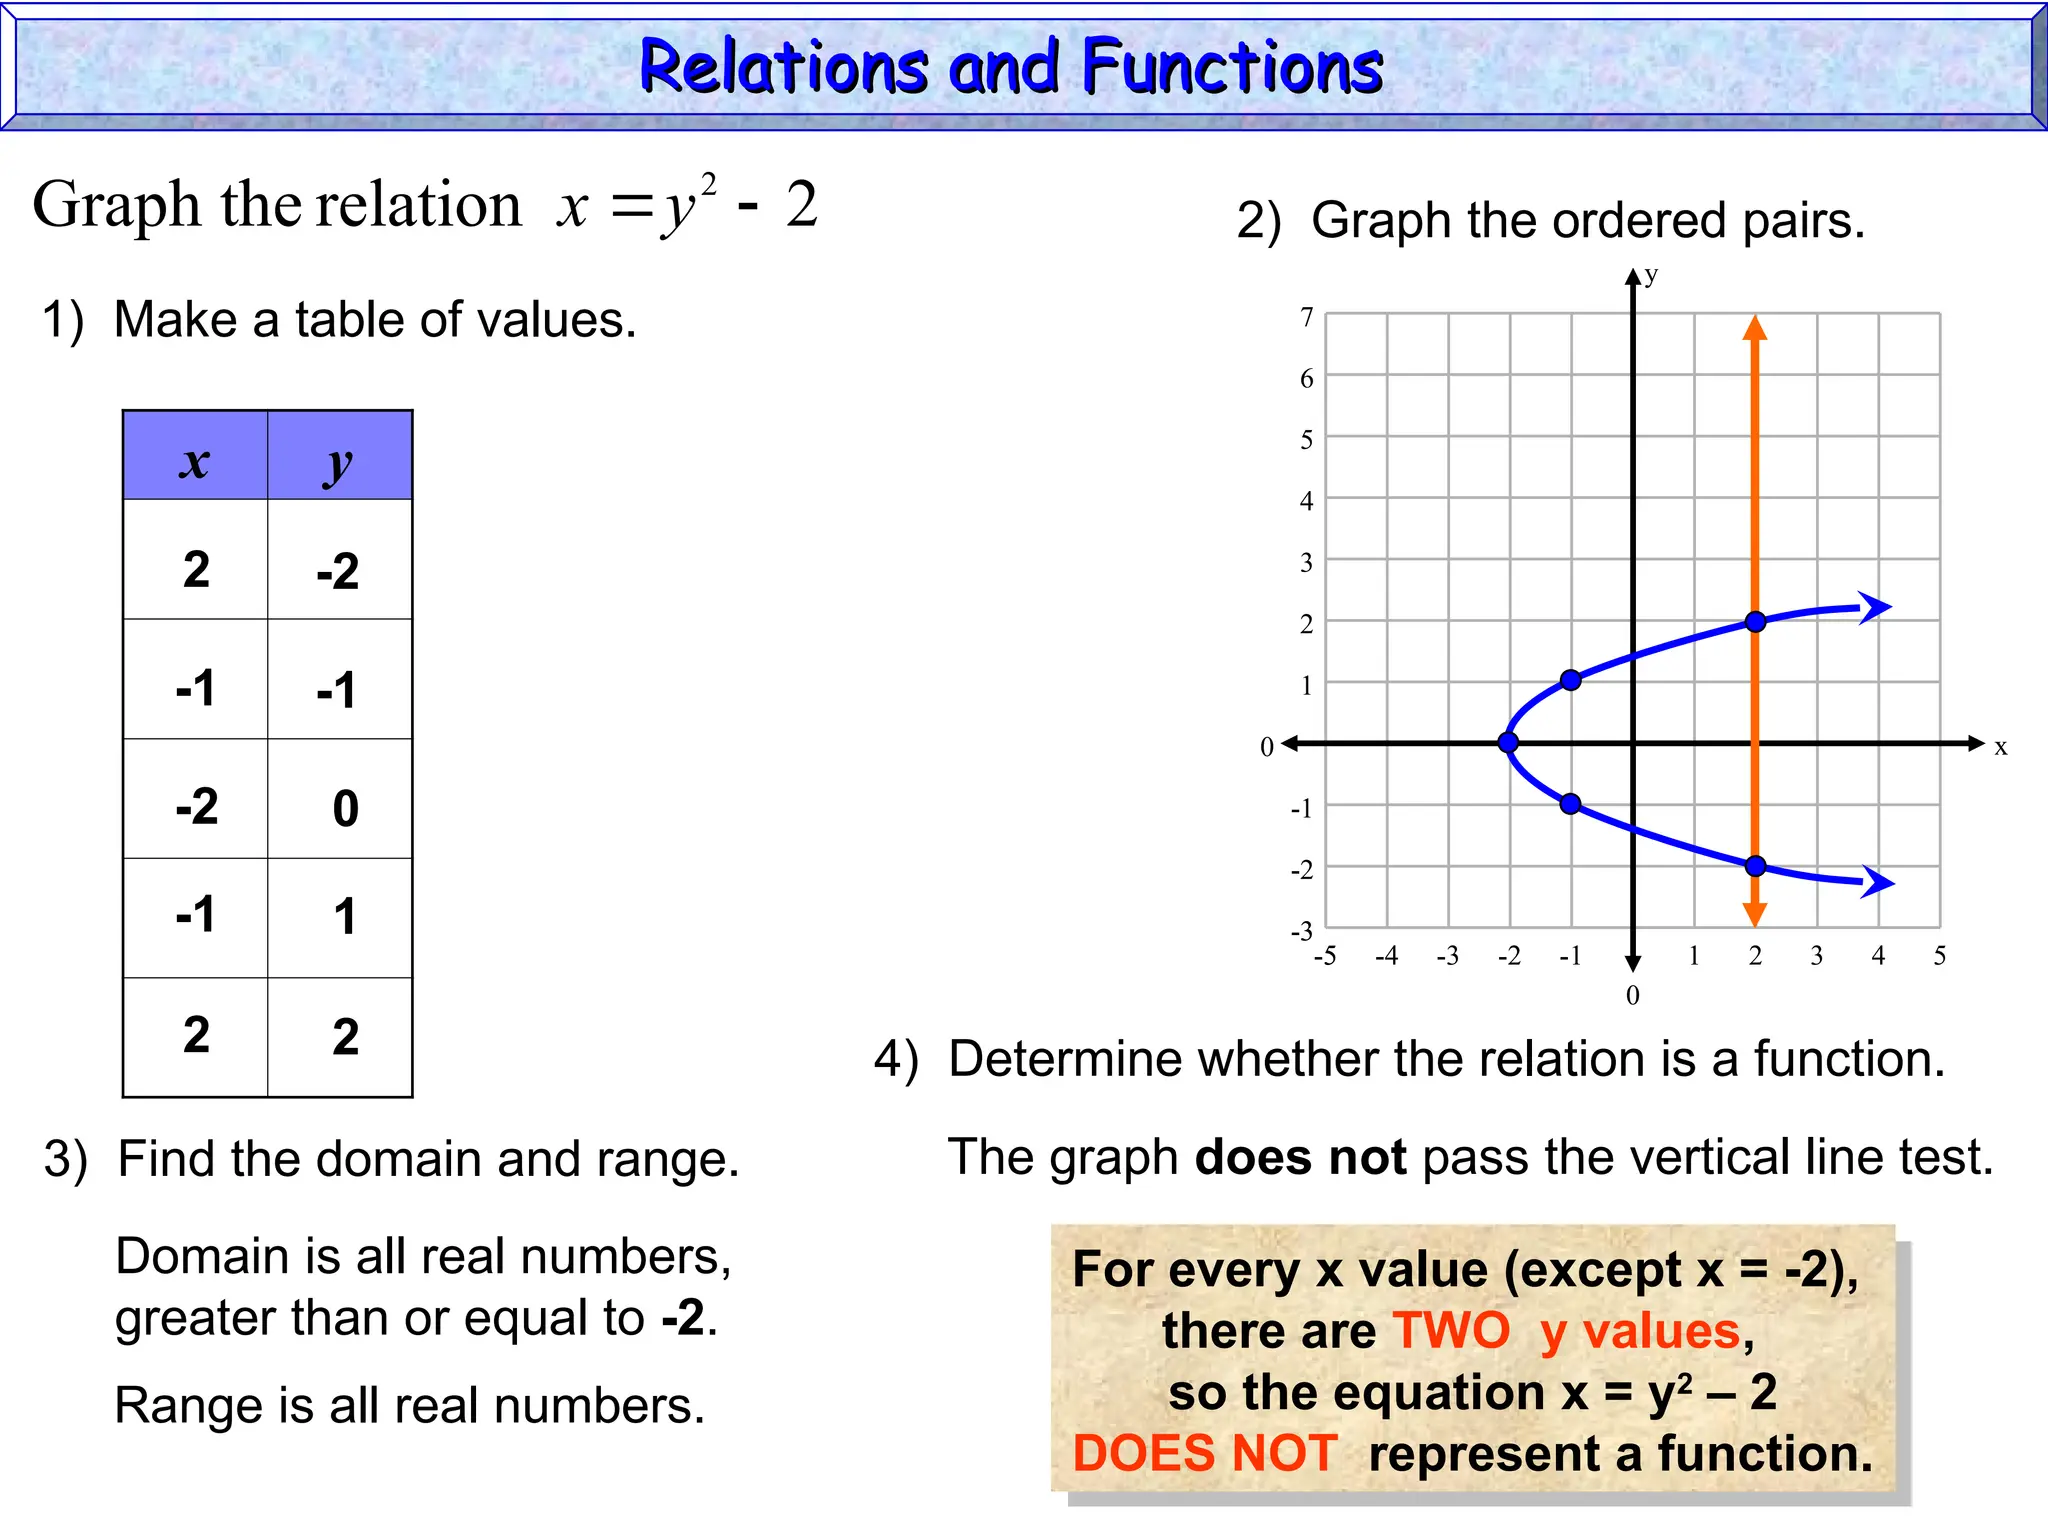
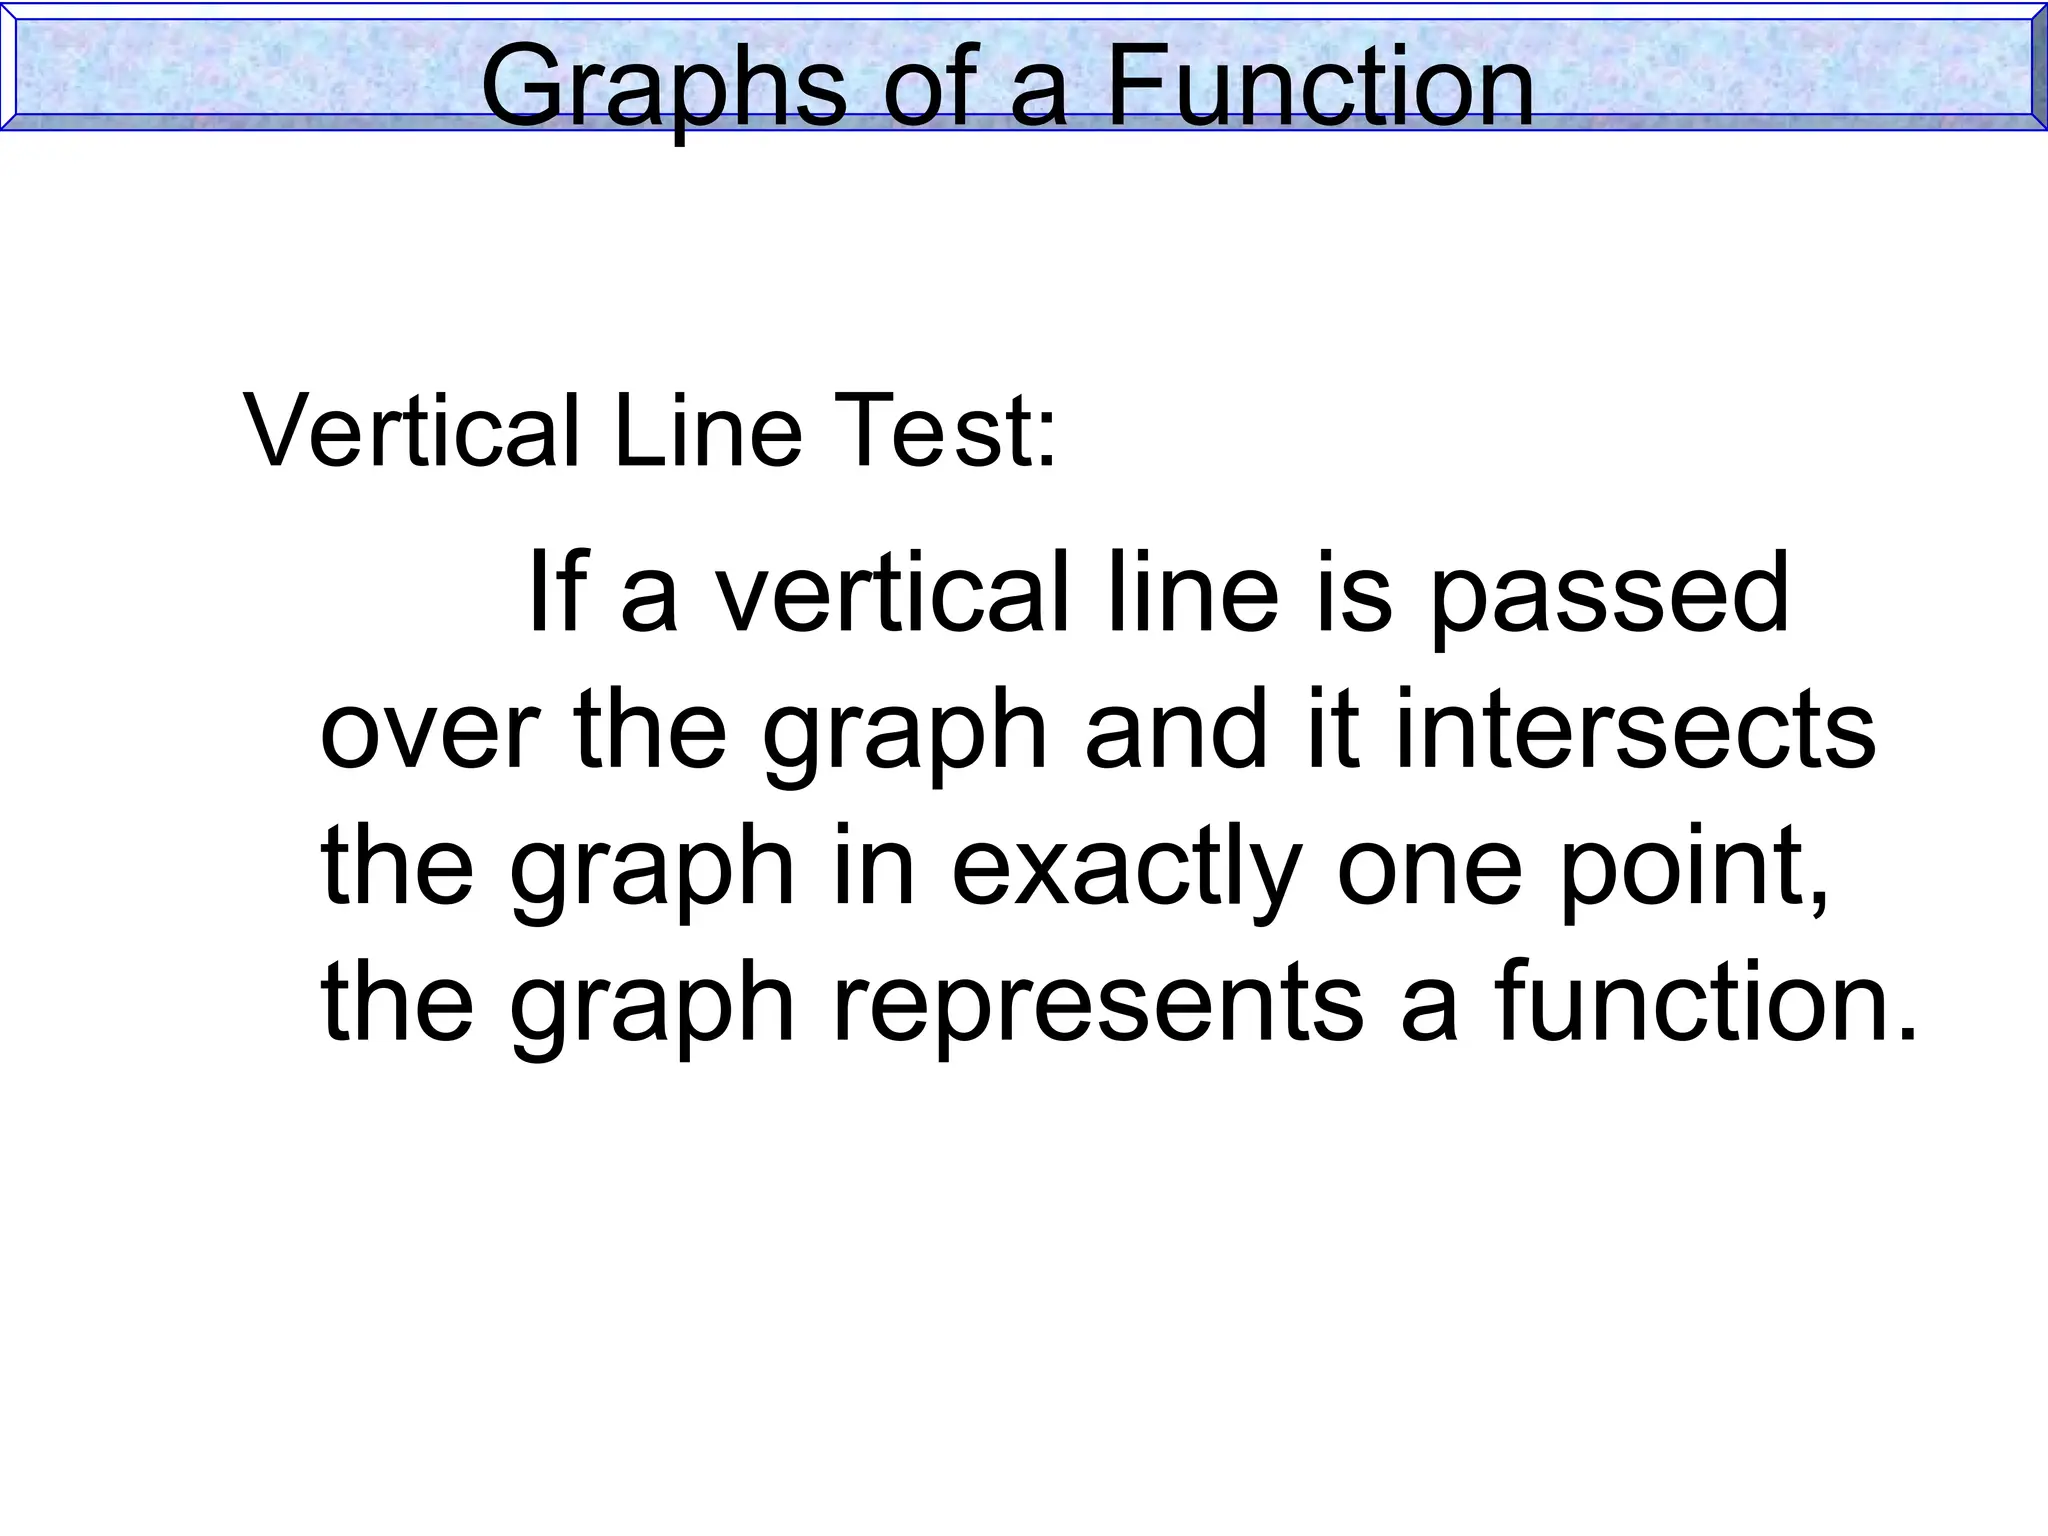
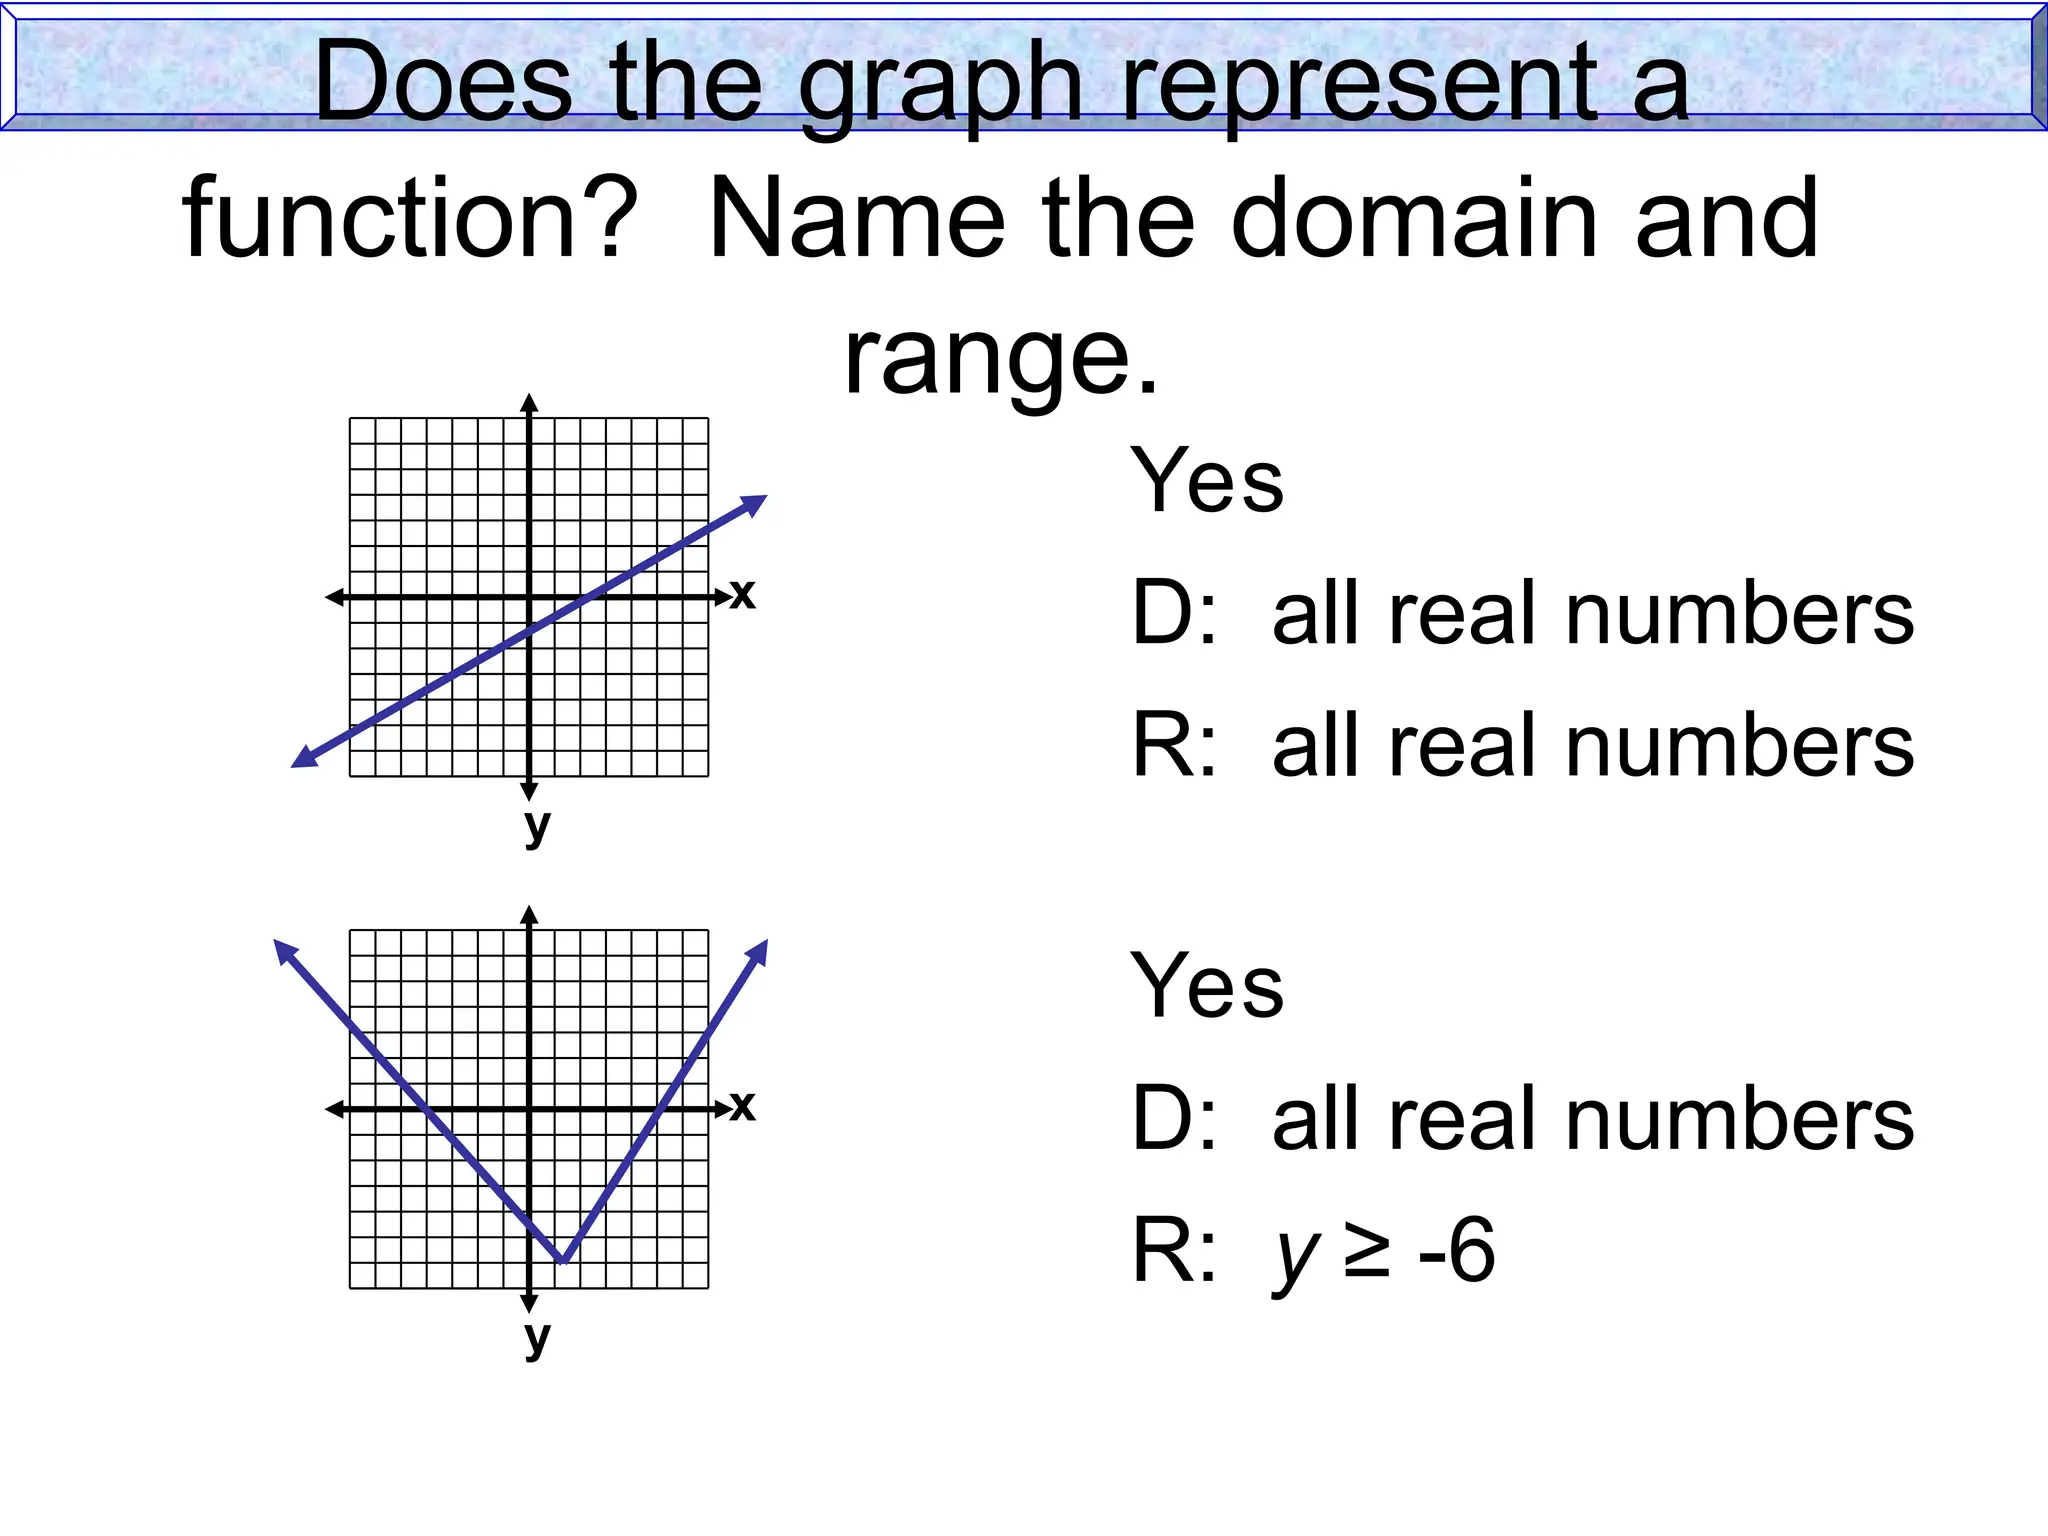
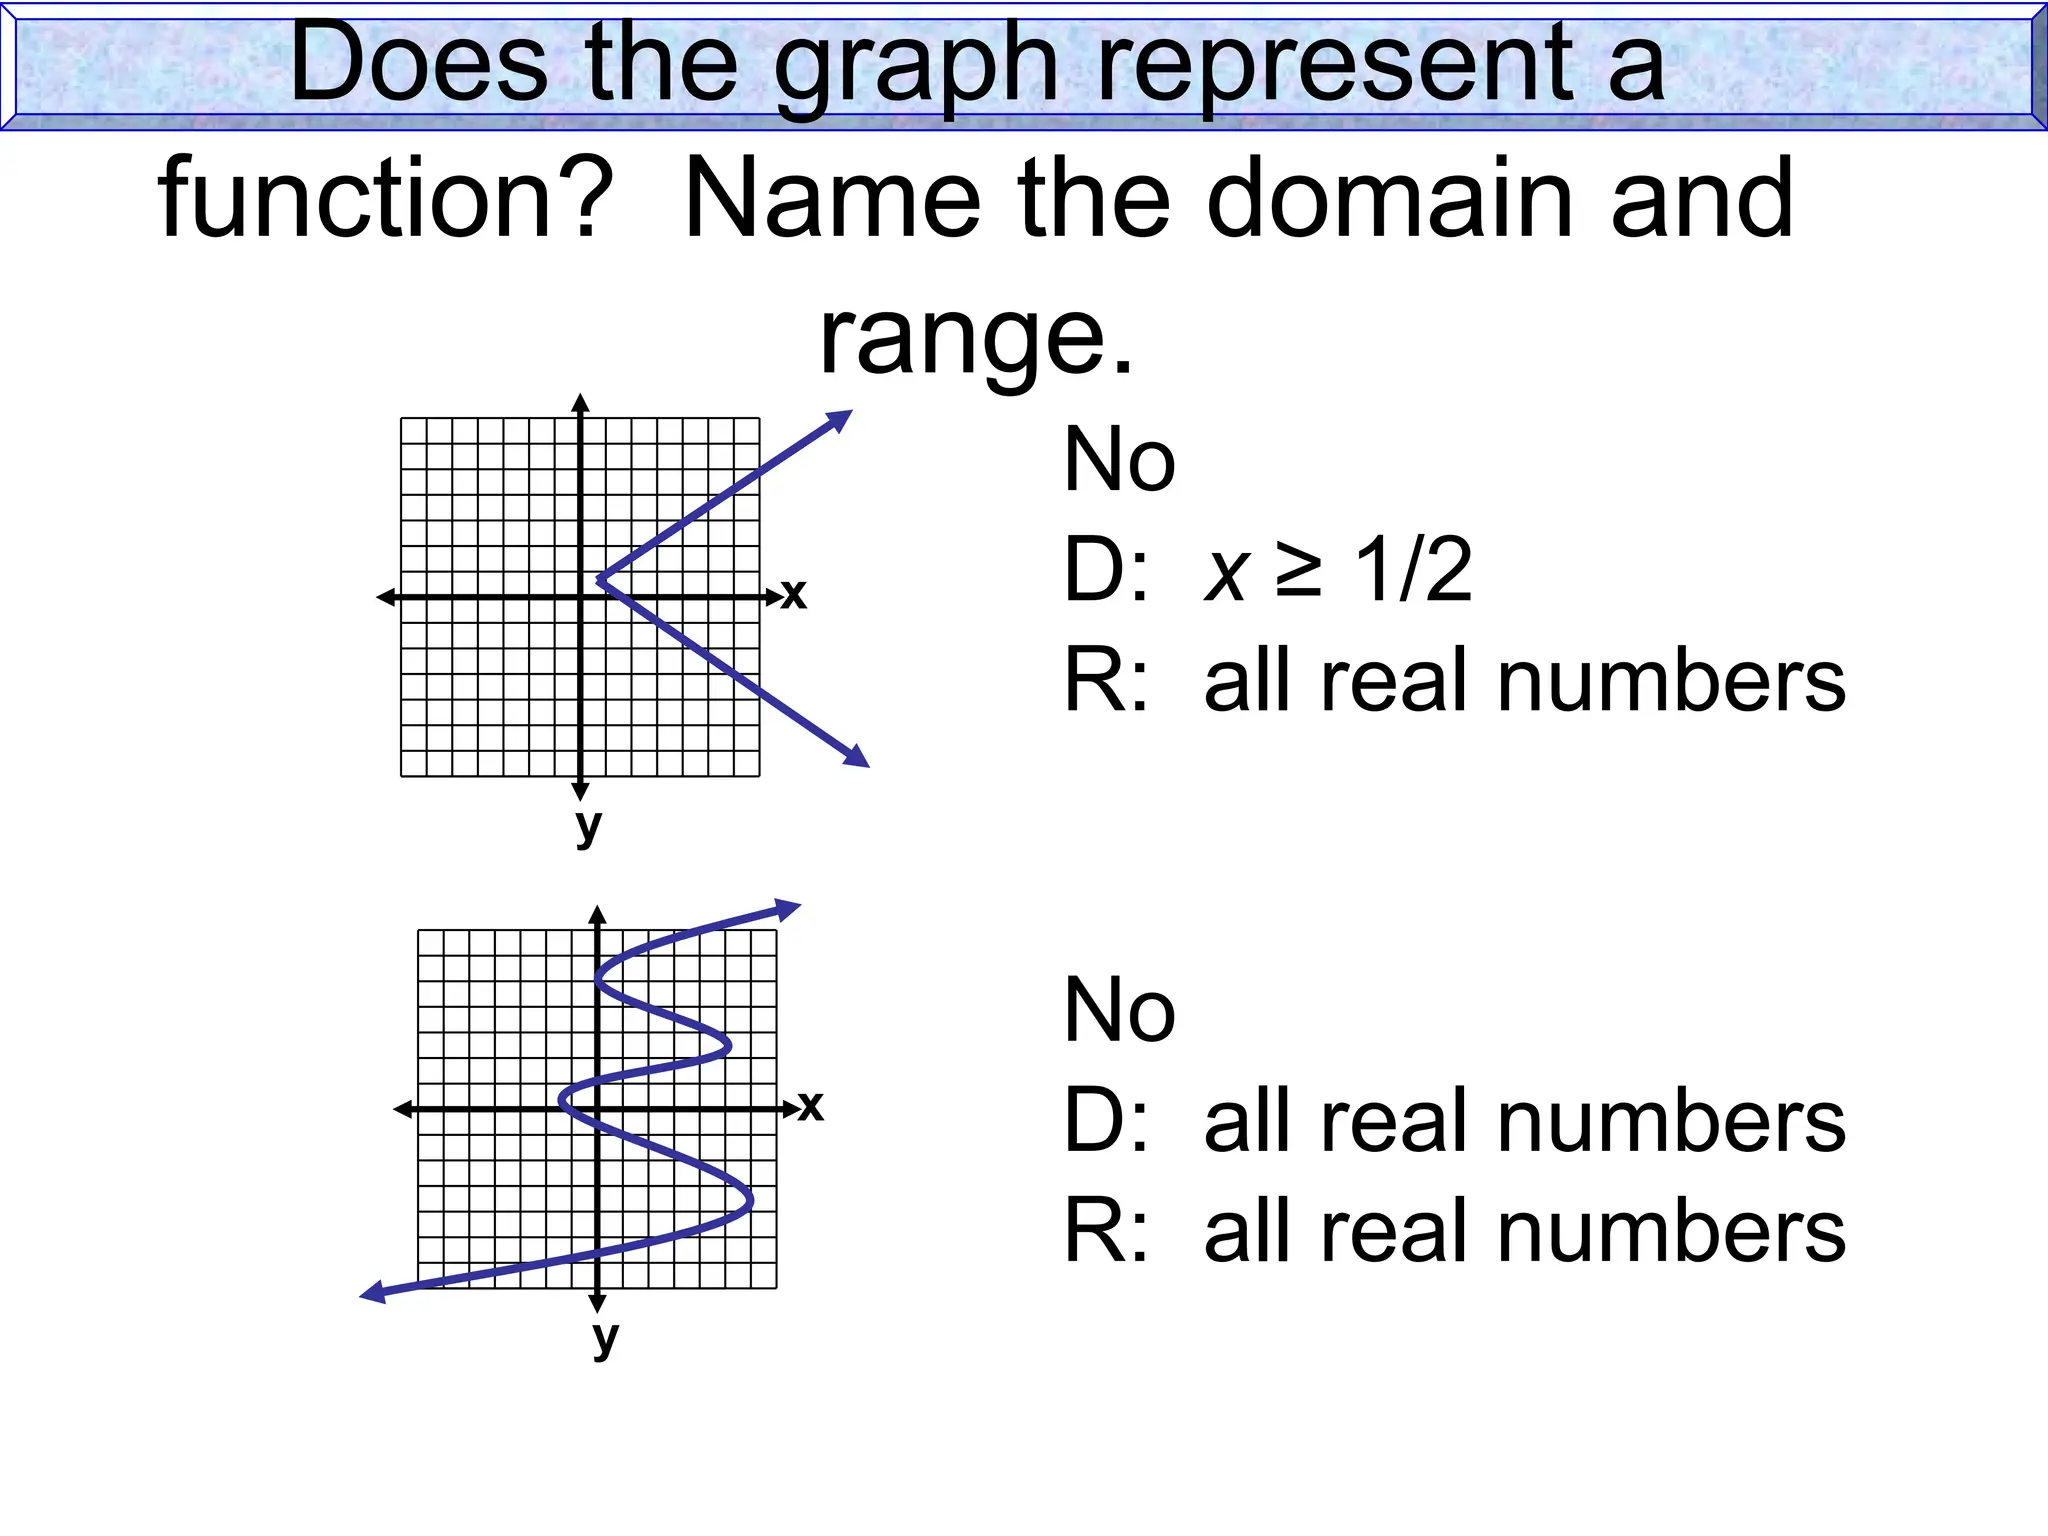
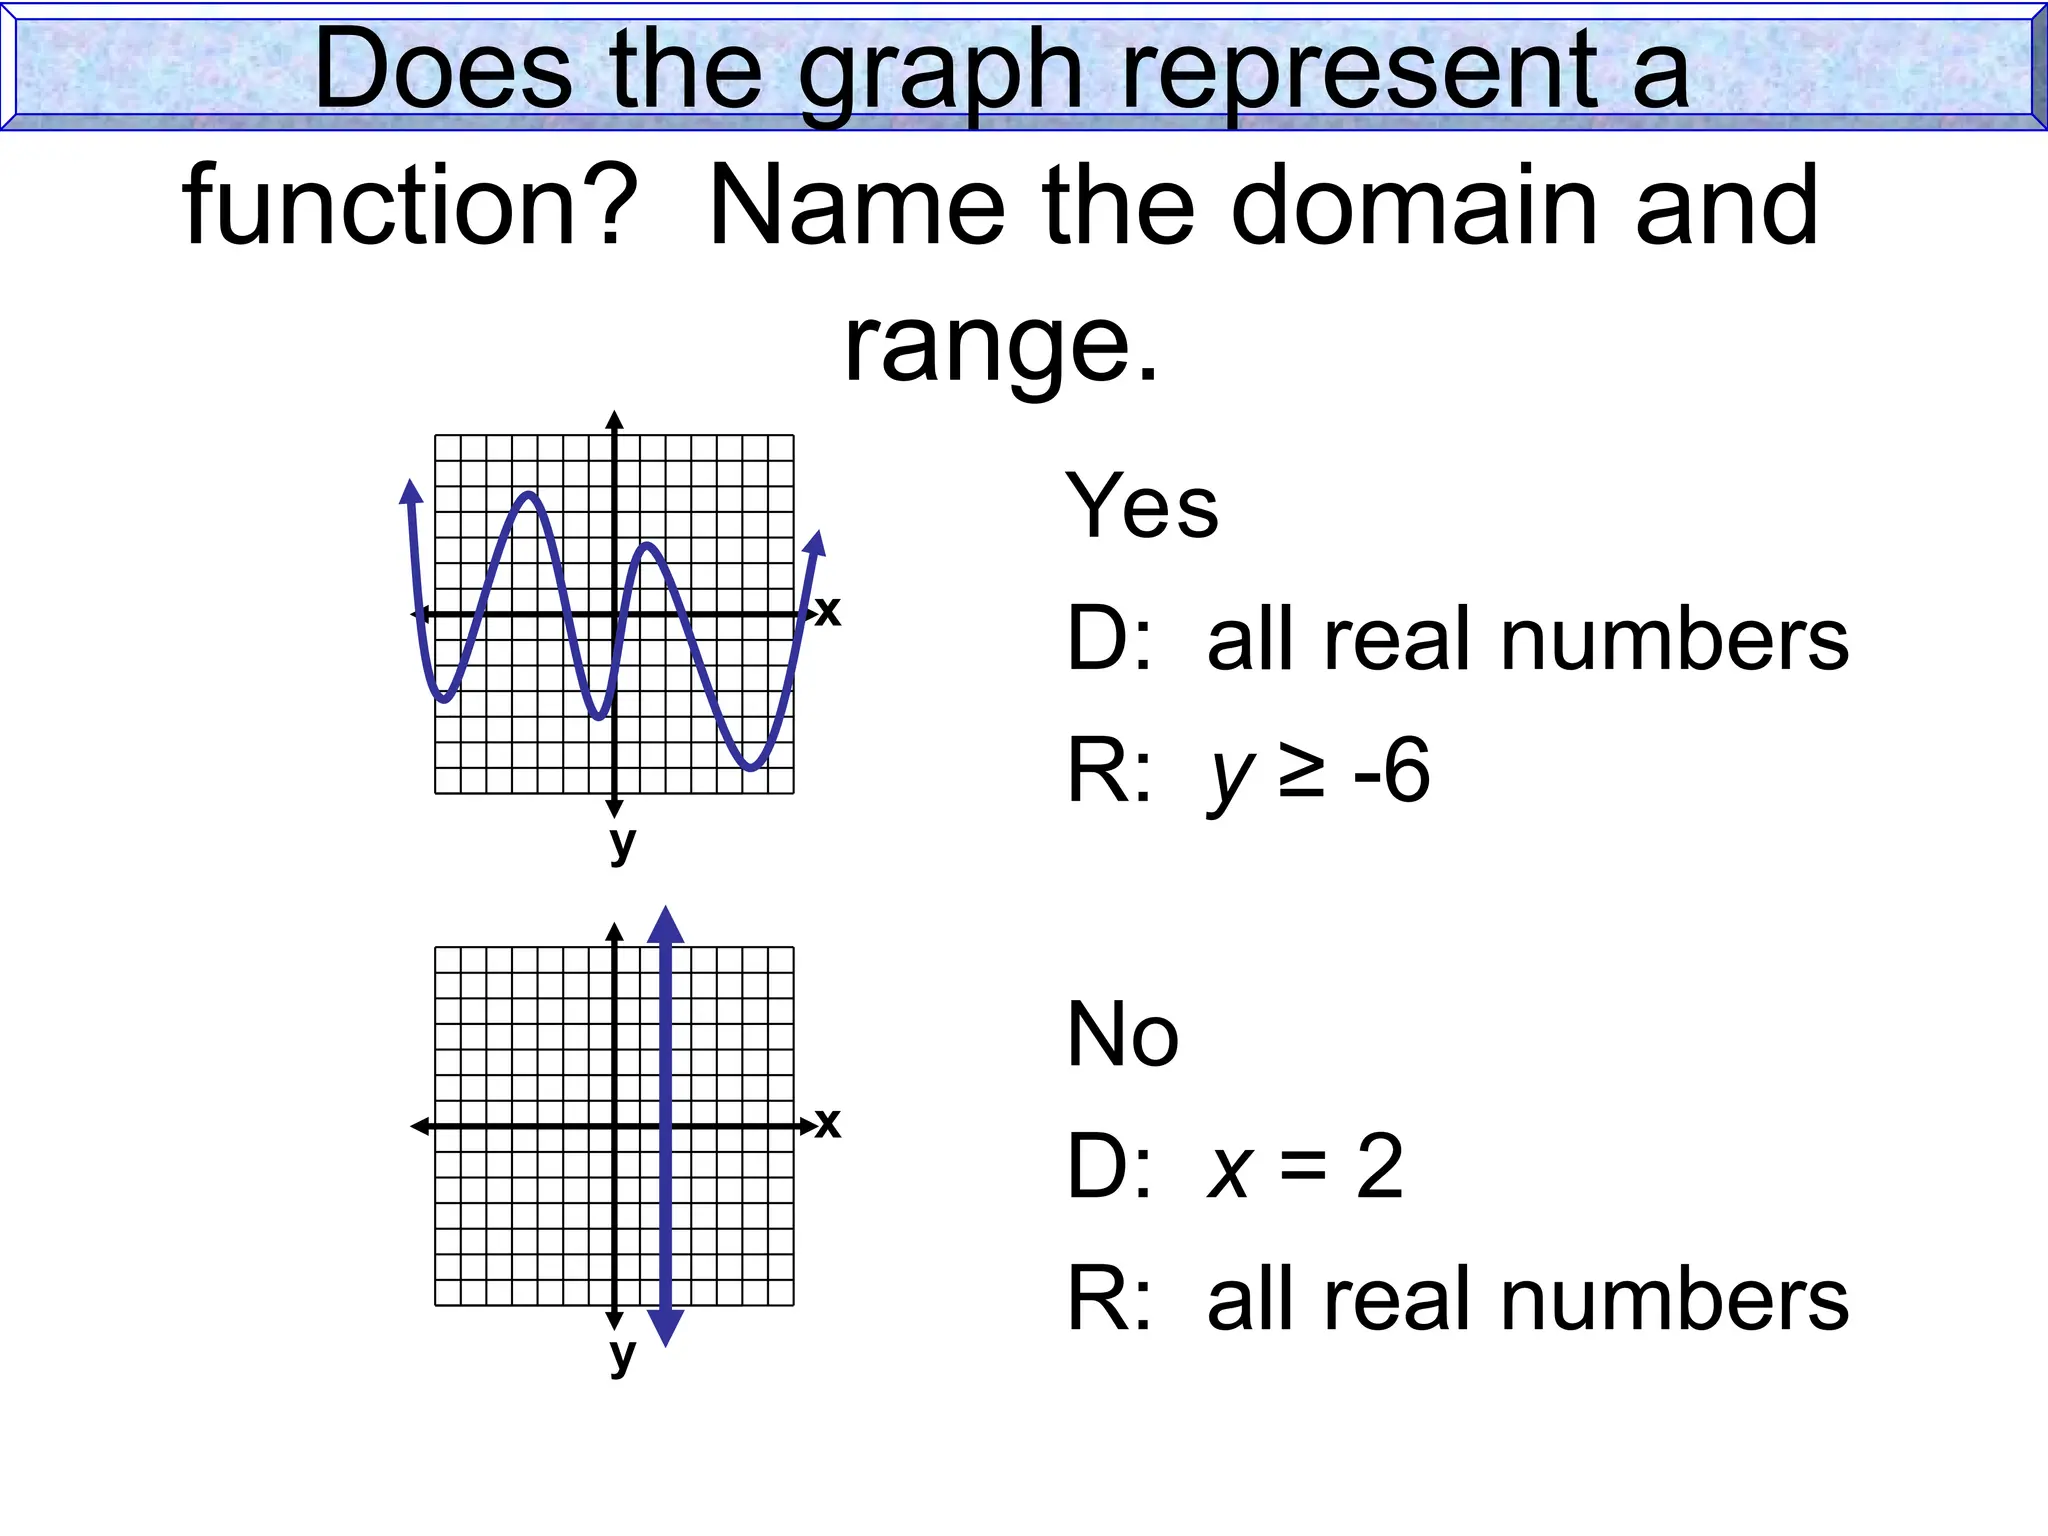
 Analyze and graph relations.
 Find functional values.
1) ordered pair
2) Cartesian Coordinate
3) plane
4) quadrant
5) relation
6) domain
7) range
8) function
9) mapping
10) one-to-one function
11) vertical line test
12) independent variable
13) dependent variable
14) functional notation
Relations and Functions
Animal
Average
Lifetime
(years)
Maximum
Lifetime
(years)
Cat 20 20
Cow 15 30
Deer 10 20
Dog 5 20
Horse 25 50
This table shows the average lifetime
and maximum lifetime for some animals.
The data can also be represented as
ordered pairs.
The ordered pairs for the data are:
(20, 20), (15, 30), (10, 20),
(5, 20), (25, 50)
and
The first number in each ordered pair
is the average lifetime, and the second
number is the maximum lifetime.
(20, 20)
average
lifetime
maximum
lifetime
Relations and Functions
Animal Lifetimes
y
x
30
10 20 30
60
20
40
60
5 25
10
50
15
30
0
0
Average Lifetime
Maximum
Lifetime
(20, 20), (15, 30), (10, 20),
(5, 20), (25, 50)
and
You can graph the ordered pairs below
on a coordinate system with two axes.
Remember, each point in the coordinate
plane can be named by exactly one
ordered pair and that every ordered pair
names exactly one point in the coordinate
plane.
The graph of this data (animal lifetimes)
lies in only one part of the Cartesian
coordinate plane – the part with all
positive numbers.
Relations and Functions
The Cartesian coordinate system is composed of the x-axis (horizontal),
0 5
-5
0
5
-5
Origin
(0, 0)
and the y-axis (vertical), which meet at the origin (0, 0) and divide the plane into
four quadrants.
You can tell which quadrant a point is in by looking at the sign of each coordinate of
the point.
Quadrant I
( +, + )
Quadrant II
( --, + )
Quadrant III
( --, -- )
Quadrant IV
( +, -- )
The points on the two axes do not lie in any quadrant.
Relations and Functions
In general, any ordered pair in the coordinate
plane can be written in the form (x, y).
A relation is a set of ordered pairs.
The domain of a relation is the set of all first coordinates
(x-coordinates) from the ordered pairs.
The range of a relation is the set of all second coordinates
(y-coordinates) from the ordered pairs.
The graph of a relation is the set of points in the coordinate
plane corresponding to the ordered pairs in the relation.
Relations and Functions
What is a RELATION?
Given the relation:
{(2, -6), (1, 4), (2, 4), (0,0), (1, -6), (3, 0)}
State the domain:
D: {0,1, 2, 3}
State the range:
R: {-6, 0, 4}
Relations and Functions
Note: { } are the symbol for "set".
When writing the domain and range,
do not repeat values.
{(2, –3), (4, 6), (3, –1), (6, 6), (2, 3)}
domain: {2, 3, 4, 6}
range: {–3, –1, 3, 6}
State the domain and range of the following
relation.
Relations and Functions
{(Carla, Mark), (Carla, Eric), (Carla,
Gerald),
(Carla, Rod), (Carla, Rey)}
domain: {Carla}
range: { Mark, Eric, Gerald, Rod, Rey}
State the domain and range of the following
relation.
Relations and Functions
{(Carla, Mark), (Carla, Eric), (Carla,
Gerald),
(Carla, Rod), (Carla, Rey)}
y
x
(-4,3) (2,3)
(-1,-2)
(0,-4)
(3,-3)
State the domain and range of the
relation shown in the graph.
The relation is:
{(-4, 3), (-1, 2), (0, -4),
(2, 3), (3, -3)}
The domain is:
{ -4, -1, 0, 2, 3 }
The range is:
{ -4, -3, -2, 3 }
Relations and Functions
ACTIVITY TIME!  (20 points)
Form five (5 groups).
Assign group leaders per group.
Let them answer pages 142 – 143. Assign problem to
each group to answer.
Outputs will be written in a Manila Paper.
Assign members who will present the output.
Presentation of outputs will be done AFTER 15 minutes.
The last group to post their output will be the first to
present.
Relations and Functions
• Relations can be written in several
ways: ordered pairs, table, graph, or
mapping.
• We have already seen relations
represented as ordered pairs.
Relations and Functions
Table
{(3, 4), (7, 2),
(0, -1), (-2, 2),
(-5, 0), (3, 3)}
x y
3 4
7 2
0 -1
-2 2
-5 0
3 3
Relations and Functions
Mapping
• Create two ovals with the domain on
the left and the range on the right.
• Elements are not repeated.
• Connect elements of the domain with
the corresponding elements in the
range by drawing an arrow.
Relations and Functions
Mapping
{(2, -6), (1, 4), (2, 4), (0, 0), (1, -6), (3, 0)}
2
1
0
3
-6
4
0
Relations and Functions
In summary:
Relations and Functions
FUNCTIONS
Objective: To recognize whether a
relation is a function or not.
What is a FUNCTION?
Relations and Functions
A function is a special type of relation in which each element of the domain is paired
with ___________ element in the range.
exactly one
A mapping shows how each member of the domain is paired with each member in
the range.
Functions
     
 
4
,
2
,
2
,
0
,
1
,
3

Domain Range
-3
0
2
1
2
4
function
Relations and Functions
ONE-TO-ONE
CORRESPONDENCE
Furthermore, a set of ordered pairs is a function if no two ordered pairs
have equal abscissas.
A function is a special type of relation in which each element of the domain is paired
with ___________ element in the range.
exactly one
A mapping shows how each member of the domain is paired with each member in
the range.
Functions
     
 
5
,
4
,
3
,
1
,
5
,
1

Domain Range
-1
1
4
5
3
function,
not one-to-one
Relations and Functions
MANY-TO-ONE
CORRESPONDENCE
Furthermore, a set of ordered pairs is a function if no two ordered pairs
have equal abscissas.
A function is a special type of relation in which each element of the domain is paired
with ___________ element in the range.
exactly one
A mapping shows how each member of the domain is paired with each member in
the range.
Functions
       
 
6
,
3
,
1
,
1
,
0
,
3
,
6
,
5 

Domain Range
5
-3
1
6
0
1
not a function
Relations and Functions
ONE-TO-MANY
CORRESPONDENCE
Furthermore, a set of ordered pairs is a function if no two ordered pairs
have equal abscissas.
y
x
(-4,3) (2,3)
(-1,-2)
(0,-4)
(3,-3)
State the domain and range of the relation shown
in the graph. Is the relation a function?
The relation is:
{ (-4, 3), (-1, 2), (0, -4), (2, 3), (3, -3) }
The domain is:
{ -4, -1, 0, 2, 3 }
The range is:
{ -4, -3, -2, 3 }
Each member of the domain is paired with
Exactly one member of the range, so
this relation is a function.
Relations and Functions
Function Not a Function
(4,12)
(5,15)
(6,18)
(7,21)
(8,24)
(4,12)
(4,15)
(5,18)
(5,21)
(6,24)
Function Not a Function
10
3
4
7
5
2
3
4
8
10
3
5
7
2
2
3
4
7
5
Function Not a Function
-3
-2
-1
0
1
-6
-1
-0
3
15
-3
-2
-1
0
1
-6
-1
-0
3
15
Function Not a Function
X Y
1 2
2 4
3 6
4 8
5 10
6 12
X Y
1 2
2 4
1 5
3 8
4 4
5 10
Function
Not a Function
X -3 0 3 8 -10
Y 6 8 20 4 8
X -2 0 -2 7 -8
Y 6 8 20 4 8
ANSWER EXERCISE 7,
IDENTIFY WHICH ONES
ARE FUNCTIONS.
1. FUNCTION
2. NOT FUNCTION
3. FUNCTION
4. FUNCTION
5. FUNCTION
Relations and Functions
Let’s check!
NOW YOU TRY!  (2 minutes)
You can use the vertical line test to determine whether a relation is a function.
Vertical Line Test
y
x
y
x
If no vertical line intersects a
graph in more than one point,
the graph represents a function.
If some vertical line intercepts a
graph in two or more points, the
graph does not represent a function.
Relations and Functions
Year
Population
(millions)
1950 3.9
1960 4.7
1970 5.2
1980 5.5
1990 5.5
2000 6.1
The table shows the population of Indiana
over the last several decades.
We can graph this data to determine
if it represents a function.
7
‘60
0
1
3
5
7
2
6
‘50
8
4
‘80
‘70 ‘00
0
‘90
Population
(millions)
Year
Population of Indiana
Use the vertical
line test.
Notice that no vertical line can be drawn that
contains more than one of the data points.
Therefore, this relation is a function!
Relations and Functions
Function Not a Function
SHORT QUIZ #3: (1/4)
Identify if the given
relation is function or
not.
-2
-1
-4
-2
0
1
0
2
2 4
-2
-1
0
1
0
1
2
2
3.
0
1
2
-2
-1
0
1
2
2.
1.
x
y
x
y
x
y
x
y
x
y
x
y
x
y
x
y
3.
x
y
x
y
x
y
x
y
x
y
x
y
x
y
x
y
3. 4.
x
y
x
y
x
y
x
y
x
y
x
y
x
y
x
y
4. 5. 6.
x
y
x
y
x
y
x
y
x
y
x
y
x
y
x
y
4. 5. 6. 7.
x
y
x
y
x
y
x
y
x
y
x
y
x
y
x
y
4. 5. 6. 7.
8. 9.
10. 11.
input output
0
1
5
2
3
y
x
-3
-3
-3
-3
-1
0
1
2
x
y
input output
-2
-1
0
3
4
5
6
12.
13.
14.
15.
Let’s Check!
Answers
-2
-1
-4
-2
0
1
0
2
2 4
Function
-2
-1
0
1
0
1
2
2
Function Not a Function
3.
0
1
2
-2
-1
0
1
2
2.
1.
x
y
x
y
x
y
x
y
x
y
x
y
x
y
x
y
Function Function Not a
Function
Function
Not a
Function
Function Not a
Function
Not a
Function
4. 5. 6. 7.
8. 9.
10. 11.
input output
0
1
5
2
3
y
x
-3
-3
-3
-3
-1
0
1
2
x
y
Function
Not a
Function
Not a
Function
input output
-2
-1
0
3
4
5
6
Not a
Function
12.
13.
14.
15.
Determine whether each
relation is a function.
1. {(2, 3), (3, 0), (5, 2), (4, 3)}
YES, every domain is different!
f(x)
2 3
f(x)
3 0
f(x)
5 2
f(x)
4 3
Determine whether the relation
is a function.
2. {(4, 1), (5, 2), (5, 3), (6, 6), (1, 9)}
f(x)
4 1
f(x)
5 2
f(x)
5 3
f(x)
6 6
f(x)
1 9
NO,
5 is paired with 2 numbers!
Is this relation a function?
{(1,3), (2,3), (3,3)}
1. Yes
2. No
Answer Now
Vertical Line Test (pencil test)
If any vertical line passes through
more than one point of the graph,
then that relation is not a function.
Are these functions?
FUNCTION! FUNCTION! NOPE!
Vertical Line Test
NO! FUNCTION!
FUNCTION!
NO!
Is this a graph of a function?
1. Yes
2. No
Answer Now
When an equation represents a function, the variable (usually x) whose values make
up the domain is called the independent variable.
Relations and Functions
When an equation represents a function, the variable
(usually x) whose values make up the
domain is called the independent variable.
The other variable (usually y) whose values make
up the range is called the dependent variable
because its values depend on x.
Relations and Functions
Function Notation
• When we know that a relation is a
function, the “y” in the equation can be
replaced with f(x).
• f(x) is simply a notation to designate a
function. It is pronounced ‘f’ of ‘x’.
• The ‘f’ names the function, the ‘x’ tells
the variable that is being used.
NOTE: Letters other than f can be used to represent
a function.
EXAMPLE: g(x) = 2x + 1
Function Notation
Output
Input
Name of
Function
y  f x
 
Given f(x) = 3x - 2, find:
1) f(3)
2) f(-2)
3(3)-2
3 7
3(-2)-2
-2 -8
= 7
= -8
Given h(z) = z2
- 4z + 9, find h(-
3)
(-3)2
-4(-3)+9
-3 30
9 + 12 + 9
h(-3) = 30
Given: f(x) = x2
+ 2 and g(x) = 0.5x2
– 5x + 3.5
Find each value.
Relations and Functions
Given: f(x) = x2
+ 2 and g(x) = 0.5x2
– 5x + 3.5
f(-3)
Find each value.
Relations and Functions
Given: f(x) = x2
+ 2 and g(x) = 0.5x2
– 5x + 3.5
f(-3)
f(x) = x2
+ 2
Find each value.
Relations and Functions
Given: f(x) = x2
+ 2 and g(x) = 0.5x2
– 5x + 3.5
f(-3)
f(x) = x2
+ 2
Find each value.
f(-3) = (-3)2
+ 2
Relations and Functions
Given: f(x) = x2
+ 2 and g(x) = 0.5x2
– 5x + 3.5
f(-3)
f(x) = x2
+ 2
Find each value.
f(-3) = (-3)2
+ 2
f(-3) = 9 + 2
Relations and Functions
Given: f(x) = x2
+ 2 and g(x) = 0.5x2
– 5x + 3.5
f(-3)
f(x) = x2
+ 2
Find each value.
f(-3) = (-3)2
+ 2
f(-3) = 9 + 2
f(-3) = 11
Relations and Functions
Given: f(x) = x2
+ 2 and g(x) = 0.5x2
– 5x + 3.5
f(-3)
f(x) = x2
+ 2
Find each value.
f(-3) = (-3)2
+ 2
f(-3) = 9 + 2
f(-3) = 11
g(2.8)
Relations and Functions
Given: f(x) = x2
+ 2 and g(x) = 0.5x2
– 5x + 3.5
f(-3)
f(x) = x2
+ 2
Find each value.
f(-3) = (-3)2
+ 2
f(-3) = 9 + 2
f(-3) = 11
g(2.8)
g(x) = 0.5x2
– 5x + 3.5
Relations and Functions
Given: f(x) = x2
+ 2 and g(x) = 0.5x2
– 5x + 3.5
f(-3)
f(x) = x2
+ 2
Find each value.
f(-3) = (-3)2
+ 2
f(-3) = 9 + 2
f(-3) = 11
g(2.8)
g(x) = 0.5x2
– 5x + 3.5
g(2.8) = 0.5(2.8)2
– 5(2.8) + 3.5
Relations and Functions
Given: f(x) = x2
+ 2 and g(x) = 0.5x2
– 5x + 3.5
f(-3)
f(x) = x2
+ 2
Find each value.
f(-3) = (-3)2
+ 2
f(-3) = 9 + 2
f(-3) = 11
g(2.8)
g(x) = 0.5x2
– 5x + 3.5
g(2.8) = 0.5(2.8)2
– 5(2.8) + 3.5
g(2.8) = 3.92 – 14 + 3.5
Relations and Functions
Given: f(x) = x2
+ 2 and g(x) = 0.5x2
– 5x + 3.5
f(-3)
f(x) = x2
+ 2
Find each value.
f(-3) = (-3)2
+ 2
f(-3) = 9 + 2
f(-3) = 11
g(2.8)
g(x) = 0.5x2
– 5x + 3.5
g(2.8) = 0.5(2.8)2
– 5(2.8) + 3.5
g(2.8) = 3.92 – 14 + 3.5
g(2.8) = – 6.58
Relations and Functions
Given g(x) = x2
– 2, find g(4)
Answer Now
1. 2
2. 6
3. 14
4. 18
Given f(x) = 2x + 1, find f(-8)
Answer Now
1. -40
2. -15
3. -8
4. 4
Value of a Function
If g(s) = 2s + 3, find g(-2).
g(-2) = 2(-2) + 3
=-4 + 3
= -1
g(-2) = -1
Value of a Function
If h(x) = x2
- x + 7, find h(2c).
h(2c) = (2c)2
– (2c) + 7
= 4c2
- 2c + 7
Value of a Function
If f(k) = k2
- 3, find f(a - 1)
f(a - 1)=(a - 1)2
- 3
(Remember FOIL?!)
=(a-1)(a-1) - 3
= a2
- a - a + 1 - 3
= a2
- 2a - 2
1
2
relation
Graph the 
 x
y
x y
1) Make a table of values.
-1
0
1
2
-1
1
3
5
2) Graph the ordered pairs.
0
y
0 x
5
-4 -2 1 3
-3
-3
-1
2
4
6
-5 -1 4
-2
3
-5 2
1
-3
5
7
3) Find the domain and range.
Domain is all real numbers.
Range is all real numbers.
4) Determine whether the relation is a function.
The graph passes the vertical line test.
For every x value there is exactly one y value,
so the equation y = 2x + 1 represents a function.
Relations and Functions
2
relation
Graph the 2

y
x
x y
1) Make a table of values.
2
-1
-2
-2
-1
0
2) Graph the ordered pairs.
0
y
0 x
5
-4 -2 1 3
-3
-3
-1
2
4
6
-5 -1 4
-2
3
-5 2
1
-3
5
7
3) Find the domain and range.
Domain is all real numbers,
greater than or equal to -2.
Range is all real numbers.
4) Determine whether the relation is a function.
The graph does not pass the vertical line test.
For every x value (except x = -2),
there are TWO y values,
so the equation x = y2
– 2
DOES NOT represent a function.
-1 1
2 2
Relations and Functions
Graphs of a Function
Vertical Line Test:
If a vertical line is passed
over the graph and it intersects
the graph in exactly one point,
the graph represents a function.
x
y
x
y
Does the graph represent a
function? Name the domain and
range.
Yes
D: all real numbers
R: all real numbers
Yes
D: all real numbers
R: y ≥ -6
x
y
x
y
Does the graph represent a
function? Name the domain and
range.
No
D: x ≥ 1/2
R: all real numbers
No
D: all real numbers
R: all real numbers
Does the graph represent a
function? Name the domain and
range.
Yes
D: all real numbers
R: y ≥ -6
No
D: x = 2
R: all real numbers
x
y
x
y
Relations and Functions

relationsandfunctionslessonproper-160929053921.ppt

  • 2.
     Analyze andgraph relations.  Find functional values. 1) ordered pair 2) Cartesian Coordinate 3) plane 4) quadrant 5) relation 6) domain 7) range 8) function 9) mapping 10) one-to-one function 11) vertical line test 12) independent variable 13) dependent variable 14) functional notation Relations and Functions Relations and Functions
  • 3.
    Animal Average Lifetime (years) Maximum Lifetime (years) Cat 20 20 Cow15 30 Deer 10 20 Dog 5 20 Horse 25 50 This table shows the average lifetime and maximum lifetime for some animals. The data can also be represented as ordered pairs. The ordered pairs for the data are: (20, 20), (15, 30), (10, 20), (5, 20), (25, 50) and The first number in each ordered pair is the average lifetime, and the second number is the maximum lifetime. (20, 20) average lifetime maximum lifetime Relations and Functions Relations and Functions
  • 4.
    Animal Lifetimes y x 30 10 2030 60 20 40 60 5 25 10 50 15 30 0 0 Average Lifetime Maximum Lifetime (20, 20), (15, 30), (10, 20), (5, 20), (25, 50) and You can graph the ordered pairs below on a coordinate system with two axes. Remember, each point in the coordinate plane can be named by exactly one ordered pair and that every ordered pair names exactly one point in the coordinate plane. The graph of this data (animal lifetimes) lies in only one part of the Cartesian coordinate plane – the part with all positive numbers. Relations and Functions Relations and Functions
  • 5.
    The Cartesian coordinatesystem is composed of the x-axis (horizontal), 0 5 -5 0 5 -5 Origin (0, 0) and the y-axis (vertical), which meet at the origin (0, 0) and divide the plane into four quadrants. You can tell which quadrant a point is in by looking at the sign of each coordinate of the point. Quadrant I ( +, + ) Quadrant II ( --, + ) Quadrant III ( --, -- ) Quadrant IV ( +, -- ) The points on the two axes do not lie in any quadrant. Relations and Functions Relations and Functions
  • 6.
    In general, anyordered pair in the coordinate plane can be written in the form (x, y). A relation is a set of ordered pairs. The domain of a relation is the set of all first coordinates (x-coordinates) from the ordered pairs. The range of a relation is the set of all second coordinates (y-coordinates) from the ordered pairs. The graph of a relation is the set of points in the coordinate plane corresponding to the ordered pairs in the relation. Relations and Functions Relations and Functions What is a RELATION?
  • 7.
    Given the relation: {(2,-6), (1, 4), (2, 4), (0,0), (1, -6), (3, 0)} State the domain: D: {0,1, 2, 3} State the range: R: {-6, 0, 4} Relations and Functions Relations and Functions Note: { } are the symbol for "set". When writing the domain and range, do not repeat values.
  • 8.
    {(2, –3), (4,6), (3, –1), (6, 6), (2, 3)} domain: {2, 3, 4, 6} range: {–3, –1, 3, 6} State the domain and range of the following relation. Relations and Functions Relations and Functions
  • 9.
    {(Carla, Mark), (Carla,Eric), (Carla, Gerald), (Carla, Rod), (Carla, Rey)} domain: {Carla} range: { Mark, Eric, Gerald, Rod, Rey} State the domain and range of the following relation. Relations and Functions Relations and Functions {(Carla, Mark), (Carla, Eric), (Carla, Gerald), (Carla, Rod), (Carla, Rey)}
  • 10.
    y x (-4,3) (2,3) (-1,-2) (0,-4) (3,-3) State thedomain and range of the relation shown in the graph. The relation is: {(-4, 3), (-1, 2), (0, -4), (2, 3), (3, -3)} The domain is: { -4, -1, 0, 2, 3 } The range is: { -4, -3, -2, 3 } Relations and Functions Relations and Functions
  • 11.
    ACTIVITY TIME! (20 points) Form five (5 groups). Assign group leaders per group. Let them answer pages 142 – 143. Assign problem to each group to answer. Outputs will be written in a Manila Paper. Assign members who will present the output. Presentation of outputs will be done AFTER 15 minutes. The last group to post their output will be the first to present. Relations and Functions Relations and Functions
  • 12.
    • Relations canbe written in several ways: ordered pairs, table, graph, or mapping. • We have already seen relations represented as ordered pairs. Relations and Functions Relations and Functions
  • 13.
    Table {(3, 4), (7,2), (0, -1), (-2, 2), (-5, 0), (3, 3)} x y 3 4 7 2 0 -1 -2 2 -5 0 3 3 Relations and Functions Relations and Functions
  • 14.
    Mapping • Create twoovals with the domain on the left and the range on the right. • Elements are not repeated. • Connect elements of the domain with the corresponding elements in the range by drawing an arrow. Relations and Functions Relations and Functions
  • 15.
    Mapping {(2, -6), (1,4), (2, 4), (0, 0), (1, -6), (3, 0)} 2 1 0 3 -6 4 0 Relations and Functions Relations and Functions
  • 16.
    In summary: Relations andFunctions Relations and Functions
  • 17.
    Relations and Functions Relationsand Functions FUNCTIONS Objective: To recognize whether a relation is a function or not.
  • 18.
    What is aFUNCTION? Relations and Functions Relations and Functions
  • 19.
    A function isa special type of relation in which each element of the domain is paired with ___________ element in the range. exactly one A mapping shows how each member of the domain is paired with each member in the range. Functions         4 , 2 , 2 , 0 , 1 , 3  Domain Range -3 0 2 1 2 4 function Relations and Functions Relations and Functions ONE-TO-ONE CORRESPONDENCE Furthermore, a set of ordered pairs is a function if no two ordered pairs have equal abscissas.
  • 20.
    A function isa special type of relation in which each element of the domain is paired with ___________ element in the range. exactly one A mapping shows how each member of the domain is paired with each member in the range. Functions         5 , 4 , 3 , 1 , 5 , 1  Domain Range -1 1 4 5 3 function, not one-to-one Relations and Functions Relations and Functions MANY-TO-ONE CORRESPONDENCE Furthermore, a set of ordered pairs is a function if no two ordered pairs have equal abscissas.
  • 21.
    A function isa special type of relation in which each element of the domain is paired with ___________ element in the range. exactly one A mapping shows how each member of the domain is paired with each member in the range. Functions           6 , 3 , 1 , 1 , 0 , 3 , 6 , 5   Domain Range 5 -3 1 6 0 1 not a function Relations and Functions Relations and Functions ONE-TO-MANY CORRESPONDENCE Furthermore, a set of ordered pairs is a function if no two ordered pairs have equal abscissas.
  • 22.
    y x (-4,3) (2,3) (-1,-2) (0,-4) (3,-3) State thedomain and range of the relation shown in the graph. Is the relation a function? The relation is: { (-4, 3), (-1, 2), (0, -4), (2, 3), (3, -3) } The domain is: { -4, -1, 0, 2, 3 } The range is: { -4, -3, -2, 3 } Each member of the domain is paired with Exactly one member of the range, so this relation is a function. Relations and Functions Relations and Functions
  • 23.
    Function Not aFunction (4,12) (5,15) (6,18) (7,21) (8,24) (4,12) (4,15) (5,18) (5,21) (6,24)
  • 24.
    Function Not aFunction 10 3 4 7 5 2 3 4 8 10 3 5 7 2 2 3 4 7 5
  • 25.
    Function Not aFunction -3 -2 -1 0 1 -6 -1 -0 3 15 -3 -2 -1 0 1 -6 -1 -0 3 15
  • 26.
    Function Not aFunction X Y 1 2 2 4 3 6 4 8 5 10 6 12 X Y 1 2 2 4 1 5 3 8 4 4 5 10
  • 27.
    Function Not a Function X-3 0 3 8 -10 Y 6 8 20 4 8 X -2 0 -2 7 -8 Y 6 8 20 4 8
  • 28.
    ANSWER EXERCISE 7, IDENTIFYWHICH ONES ARE FUNCTIONS. 1. FUNCTION 2. NOT FUNCTION 3. FUNCTION 4. FUNCTION 5. FUNCTION Relations and Functions Relations and Functions Let’s check! NOW YOU TRY!  (2 minutes)
  • 29.
    You can usethe vertical line test to determine whether a relation is a function. Vertical Line Test y x y x If no vertical line intersects a graph in more than one point, the graph represents a function. If some vertical line intercepts a graph in two or more points, the graph does not represent a function. Relations and Functions Relations and Functions
  • 30.
    Year Population (millions) 1950 3.9 1960 4.7 19705.2 1980 5.5 1990 5.5 2000 6.1 The table shows the population of Indiana over the last several decades. We can graph this data to determine if it represents a function. 7 ‘60 0 1 3 5 7 2 6 ‘50 8 4 ‘80 ‘70 ‘00 0 ‘90 Population (millions) Year Population of Indiana Use the vertical line test. Notice that no vertical line can be drawn that contains more than one of the data points. Therefore, this relation is a function! Relations and Functions Relations and Functions
  • 31.
  • 32.
  • 33.
  • 34.
    SHORT QUIZ #3:(1/4) Identify if the given relation is function or not.
  • 35.
  • 36.
  • 37.
  • 38.
  • 39.
  • 40.
  • 41.
  • 42.
  • 43.
  • 44.
    x y x y x y x y x y x y x y x y Function Function Nota Function Function Not a Function Function Not a Function Not a Function 4. 5. 6. 7. 8. 9. 10. 11.
  • 45.
    input output 0 1 5 2 3 y x -3 -3 -3 -3 -1 0 1 2 x y Function Not a Function Nota Function input output -2 -1 0 3 4 5 6 Not a Function 12. 13. 14. 15.
  • 46.
    Determine whether each relationis a function. 1. {(2, 3), (3, 0), (5, 2), (4, 3)} YES, every domain is different! f(x) 2 3 f(x) 3 0 f(x) 5 2 f(x) 4 3
  • 47.
    Determine whether therelation is a function. 2. {(4, 1), (5, 2), (5, 3), (6, 6), (1, 9)} f(x) 4 1 f(x) 5 2 f(x) 5 3 f(x) 6 6 f(x) 1 9 NO, 5 is paired with 2 numbers!
  • 48.
    Is this relationa function? {(1,3), (2,3), (3,3)} 1. Yes 2. No Answer Now
  • 49.
    Vertical Line Test(pencil test) If any vertical line passes through more than one point of the graph, then that relation is not a function. Are these functions? FUNCTION! FUNCTION! NOPE!
  • 50.
    Vertical Line Test NO!FUNCTION! FUNCTION! NO!
  • 51.
    Is this agraph of a function? 1. Yes 2. No Answer Now
  • 52.
    When an equationrepresents a function, the variable (usually x) whose values make up the domain is called the independent variable. Relations and Functions Relations and Functions
  • 53.
    When an equationrepresents a function, the variable (usually x) whose values make up the domain is called the independent variable. The other variable (usually y) whose values make up the range is called the dependent variable because its values depend on x. Relations and Functions Relations and Functions
  • 54.
    Function Notation • Whenwe know that a relation is a function, the “y” in the equation can be replaced with f(x). • f(x) is simply a notation to designate a function. It is pronounced ‘f’ of ‘x’. • The ‘f’ names the function, the ‘x’ tells the variable that is being used. NOTE: Letters other than f can be used to represent a function. EXAMPLE: g(x) = 2x + 1
  • 55.
  • 56.
    Given f(x) =3x - 2, find: 1) f(3) 2) f(-2) 3(3)-2 3 7 3(-2)-2 -2 -8 = 7 = -8
  • 57.
    Given h(z) =z2 - 4z + 9, find h(- 3) (-3)2 -4(-3)+9 -3 30 9 + 12 + 9 h(-3) = 30
  • 58.
    Given: f(x) =x2 + 2 and g(x) = 0.5x2 – 5x + 3.5 Find each value. Relations and Functions Relations and Functions
  • 59.
    Given: f(x) =x2 + 2 and g(x) = 0.5x2 – 5x + 3.5 f(-3) Find each value. Relations and Functions Relations and Functions
  • 60.
    Given: f(x) =x2 + 2 and g(x) = 0.5x2 – 5x + 3.5 f(-3) f(x) = x2 + 2 Find each value. Relations and Functions Relations and Functions
  • 61.
    Given: f(x) =x2 + 2 and g(x) = 0.5x2 – 5x + 3.5 f(-3) f(x) = x2 + 2 Find each value. f(-3) = (-3)2 + 2 Relations and Functions Relations and Functions
  • 62.
    Given: f(x) =x2 + 2 and g(x) = 0.5x2 – 5x + 3.5 f(-3) f(x) = x2 + 2 Find each value. f(-3) = (-3)2 + 2 f(-3) = 9 + 2 Relations and Functions Relations and Functions
  • 63.
    Given: f(x) =x2 + 2 and g(x) = 0.5x2 – 5x + 3.5 f(-3) f(x) = x2 + 2 Find each value. f(-3) = (-3)2 + 2 f(-3) = 9 + 2 f(-3) = 11 Relations and Functions Relations and Functions
  • 64.
    Given: f(x) =x2 + 2 and g(x) = 0.5x2 – 5x + 3.5 f(-3) f(x) = x2 + 2 Find each value. f(-3) = (-3)2 + 2 f(-3) = 9 + 2 f(-3) = 11 g(2.8) Relations and Functions Relations and Functions
  • 65.
    Given: f(x) =x2 + 2 and g(x) = 0.5x2 – 5x + 3.5 f(-3) f(x) = x2 + 2 Find each value. f(-3) = (-3)2 + 2 f(-3) = 9 + 2 f(-3) = 11 g(2.8) g(x) = 0.5x2 – 5x + 3.5 Relations and Functions Relations and Functions
  • 66.
    Given: f(x) =x2 + 2 and g(x) = 0.5x2 – 5x + 3.5 f(-3) f(x) = x2 + 2 Find each value. f(-3) = (-3)2 + 2 f(-3) = 9 + 2 f(-3) = 11 g(2.8) g(x) = 0.5x2 – 5x + 3.5 g(2.8) = 0.5(2.8)2 – 5(2.8) + 3.5 Relations and Functions Relations and Functions
  • 67.
    Given: f(x) =x2 + 2 and g(x) = 0.5x2 – 5x + 3.5 f(-3) f(x) = x2 + 2 Find each value. f(-3) = (-3)2 + 2 f(-3) = 9 + 2 f(-3) = 11 g(2.8) g(x) = 0.5x2 – 5x + 3.5 g(2.8) = 0.5(2.8)2 – 5(2.8) + 3.5 g(2.8) = 3.92 – 14 + 3.5 Relations and Functions Relations and Functions
  • 68.
    Given: f(x) =x2 + 2 and g(x) = 0.5x2 – 5x + 3.5 f(-3) f(x) = x2 + 2 Find each value. f(-3) = (-3)2 + 2 f(-3) = 9 + 2 f(-3) = 11 g(2.8) g(x) = 0.5x2 – 5x + 3.5 g(2.8) = 0.5(2.8)2 – 5(2.8) + 3.5 g(2.8) = 3.92 – 14 + 3.5 g(2.8) = – 6.58 Relations and Functions Relations and Functions
  • 69.
    Given g(x) =x2 – 2, find g(4) Answer Now 1. 2 2. 6 3. 14 4. 18
  • 70.
    Given f(x) =2x + 1, find f(-8) Answer Now 1. -40 2. -15 3. -8 4. 4
  • 71.
    Value of aFunction If g(s) = 2s + 3, find g(-2). g(-2) = 2(-2) + 3 =-4 + 3 = -1 g(-2) = -1
  • 72.
    Value of aFunction If h(x) = x2 - x + 7, find h(2c). h(2c) = (2c)2 – (2c) + 7 = 4c2 - 2c + 7
  • 73.
    Value of aFunction If f(k) = k2 - 3, find f(a - 1) f(a - 1)=(a - 1)2 - 3 (Remember FOIL?!) =(a-1)(a-1) - 3 = a2 - a - a + 1 - 3 = a2 - 2a - 2
  • 74.
    1 2 relation Graph the  x y x y 1) Make a table of values. -1 0 1 2 -1 1 3 5 2) Graph the ordered pairs. 0 y 0 x 5 -4 -2 1 3 -3 -3 -1 2 4 6 -5 -1 4 -2 3 -5 2 1 -3 5 7 3) Find the domain and range. Domain is all real numbers. Range is all real numbers. 4) Determine whether the relation is a function. The graph passes the vertical line test. For every x value there is exactly one y value, so the equation y = 2x + 1 represents a function. Relations and Functions Relations and Functions
  • 75.
    2 relation Graph the 2  y x xy 1) Make a table of values. 2 -1 -2 -2 -1 0 2) Graph the ordered pairs. 0 y 0 x 5 -4 -2 1 3 -3 -3 -1 2 4 6 -5 -1 4 -2 3 -5 2 1 -3 5 7 3) Find the domain and range. Domain is all real numbers, greater than or equal to -2. Range is all real numbers. 4) Determine whether the relation is a function. The graph does not pass the vertical line test. For every x value (except x = -2), there are TWO y values, so the equation x = y2 – 2 DOES NOT represent a function. -1 1 2 2 Relations and Functions Relations and Functions
  • 76.
    Graphs of aFunction Vertical Line Test: If a vertical line is passed over the graph and it intersects the graph in exactly one point, the graph represents a function.
  • 77.
    x y x y Does the graphrepresent a function? Name the domain and range. Yes D: all real numbers R: all real numbers Yes D: all real numbers R: y ≥ -6
  • 78.
    x y x y Does the graphrepresent a function? Name the domain and range. No D: x ≥ 1/2 R: all real numbers No D: all real numbers R: all real numbers
  • 79.
    Does the graphrepresent a function? Name the domain and range. Yes D: all real numbers R: y ≥ -6 No D: x = 2 R: all real numbers x y x y
  • 80.