This document appears to be a lesson plan on probability and statistics that includes:
1. Definitions of key terms like normal random variables, mean, mode, and standard deviation.
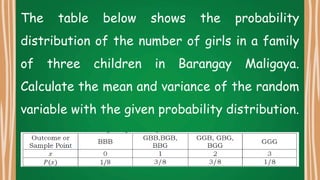
2. Examples of calculating mean, variance, and standard deviation from probability distributions.
3. Properties and characteristics of the normal probability distribution curve including that it is bell-shaped and symmetrical around the mean.
4. Examples of comparing normal distribution curves based on differences in their means and standard deviations.
5. Practice problems for students involving calculating probabilities and expected values from scenarios like raffles and games of chance.