Downloaded 50 times
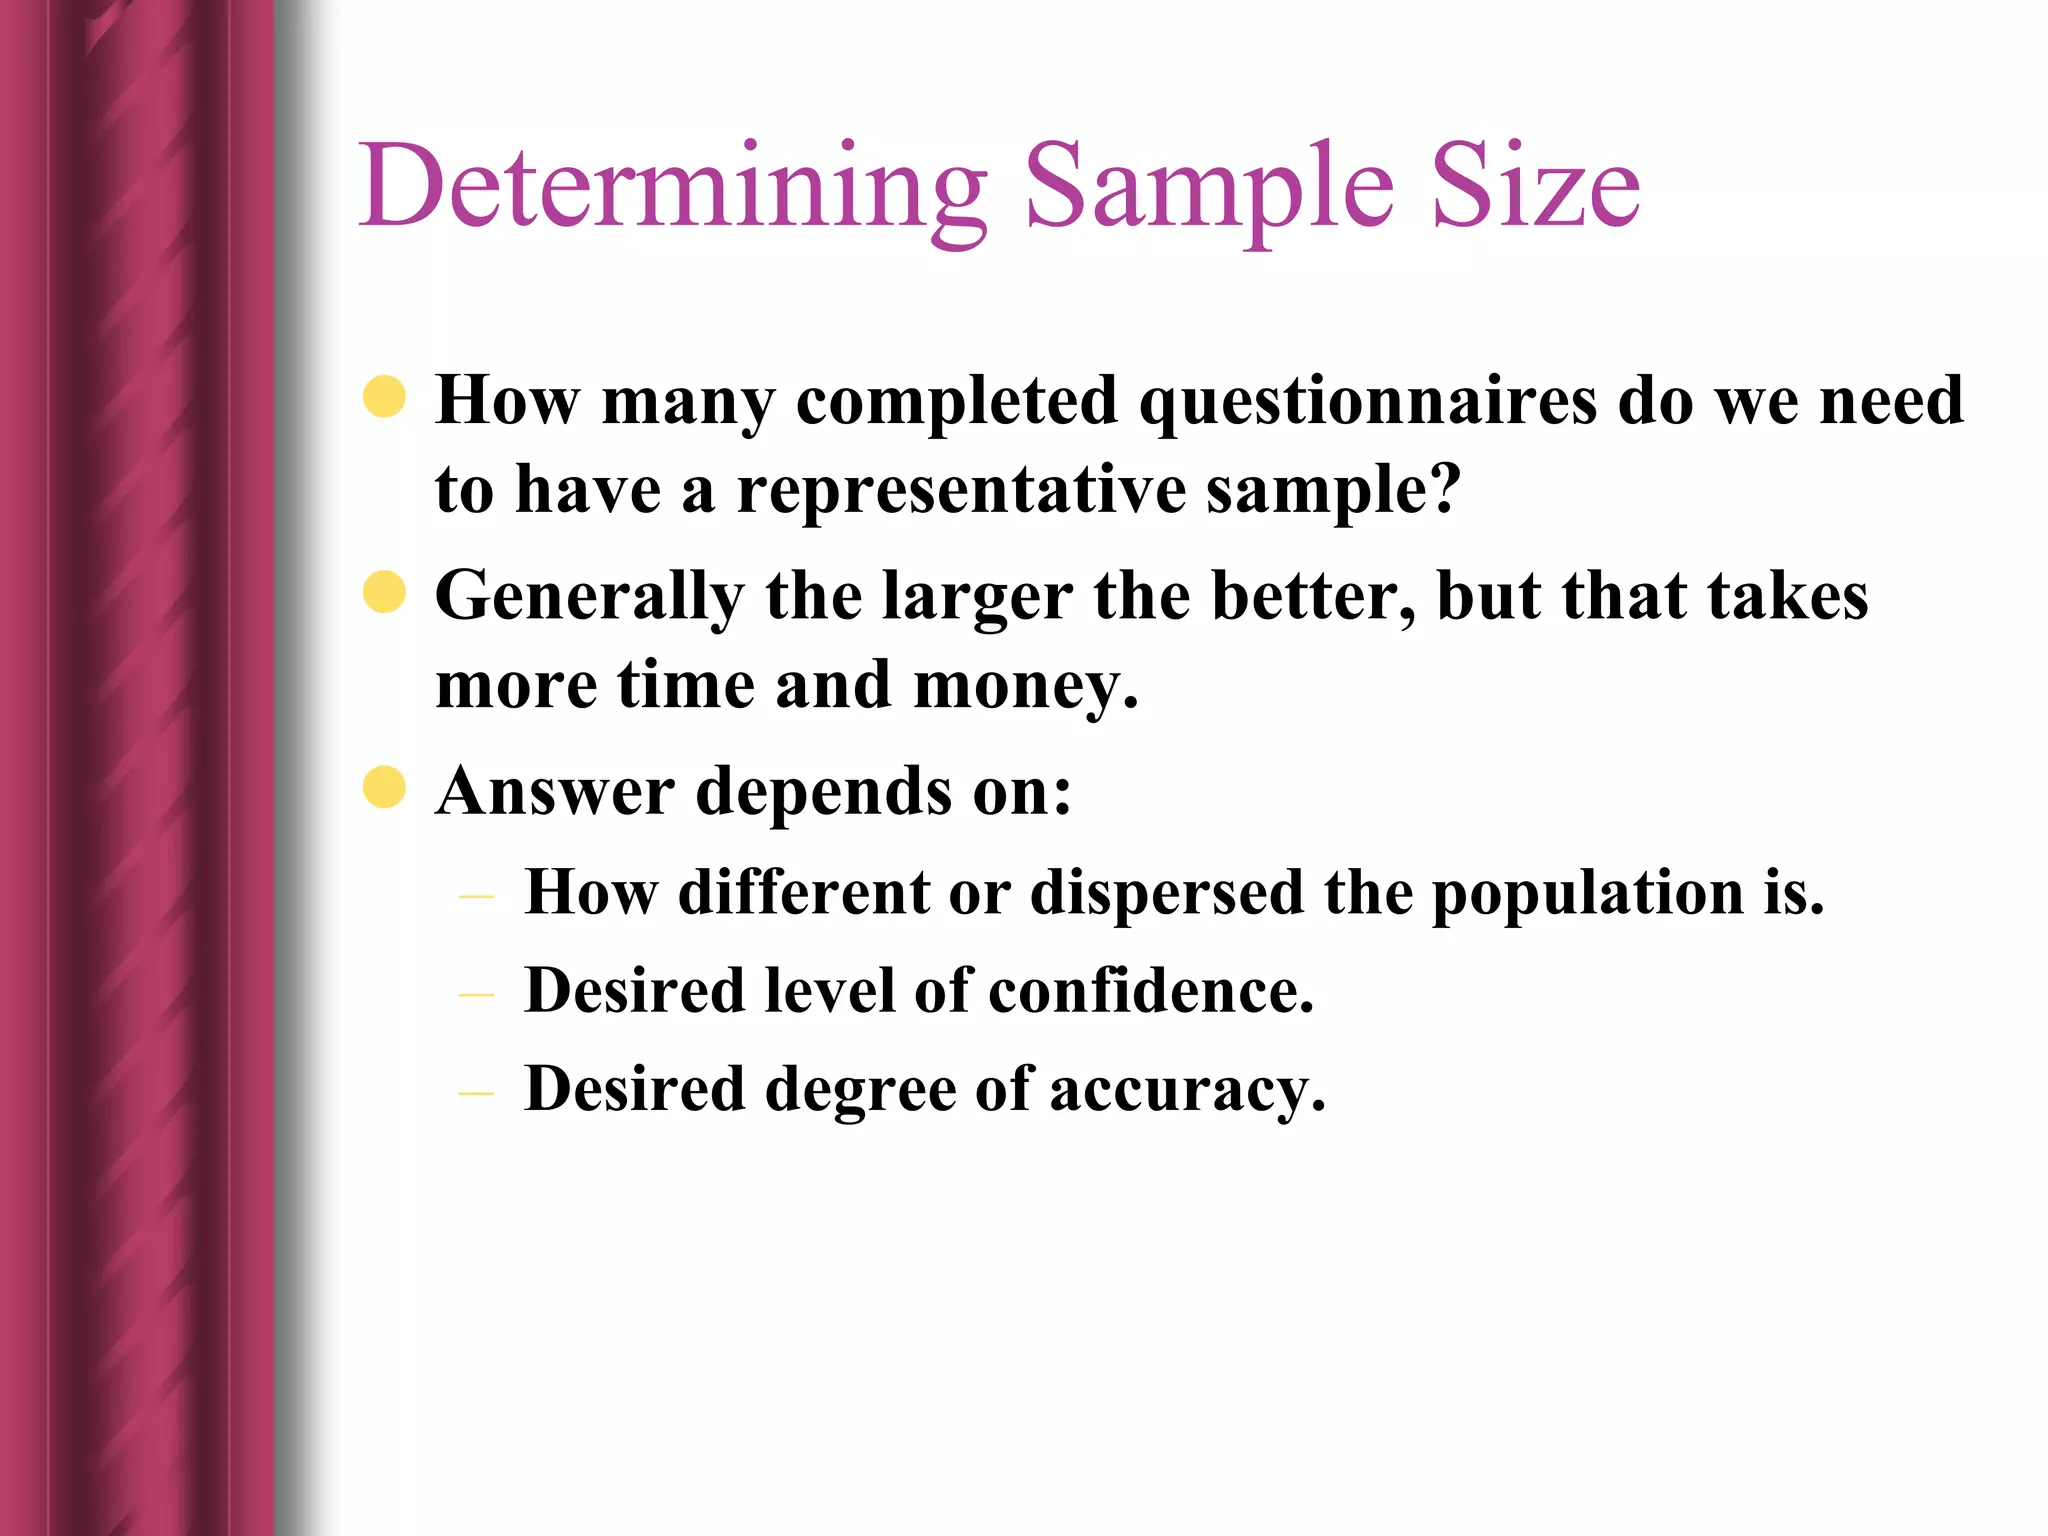
![ When estimating a population mean
n = (Z2
B,CL)(σ2/e2)
n estimates of a population proportion are of
concern
n = (Z2
B,CL)([P x Q]/e2)
Probability Sampling and Sample Sizes](https://image.slidesharecdn.com/samplingtechniques-150531173041-lva1-app6891/75/Sampling-techniques-33-2048.jpg)
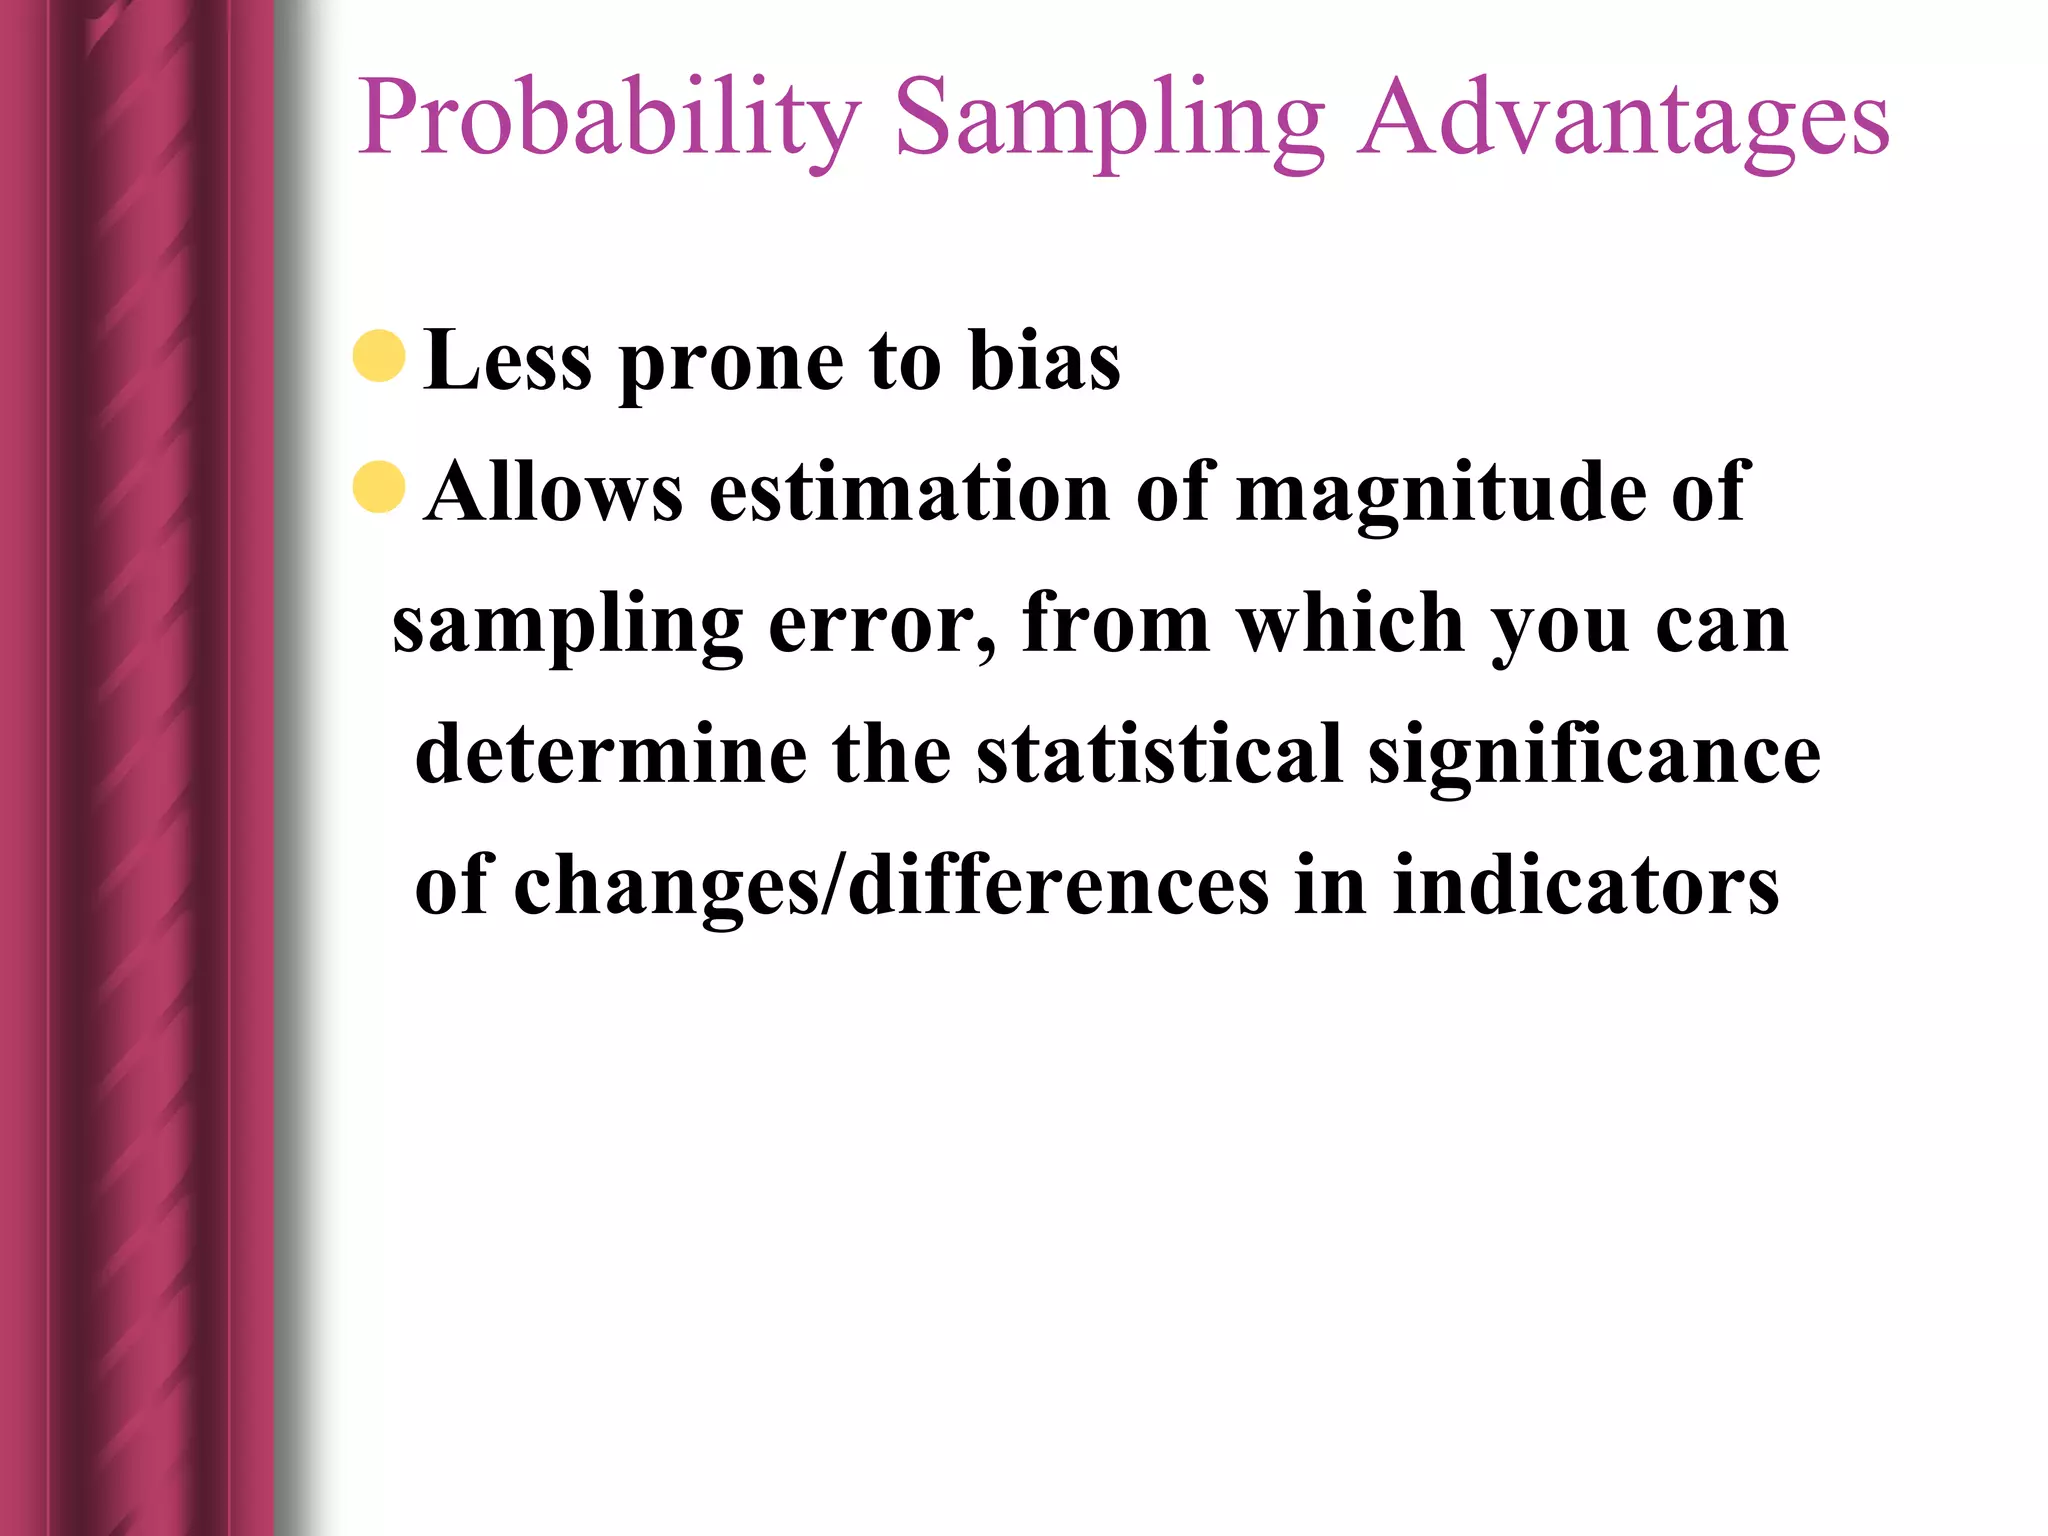
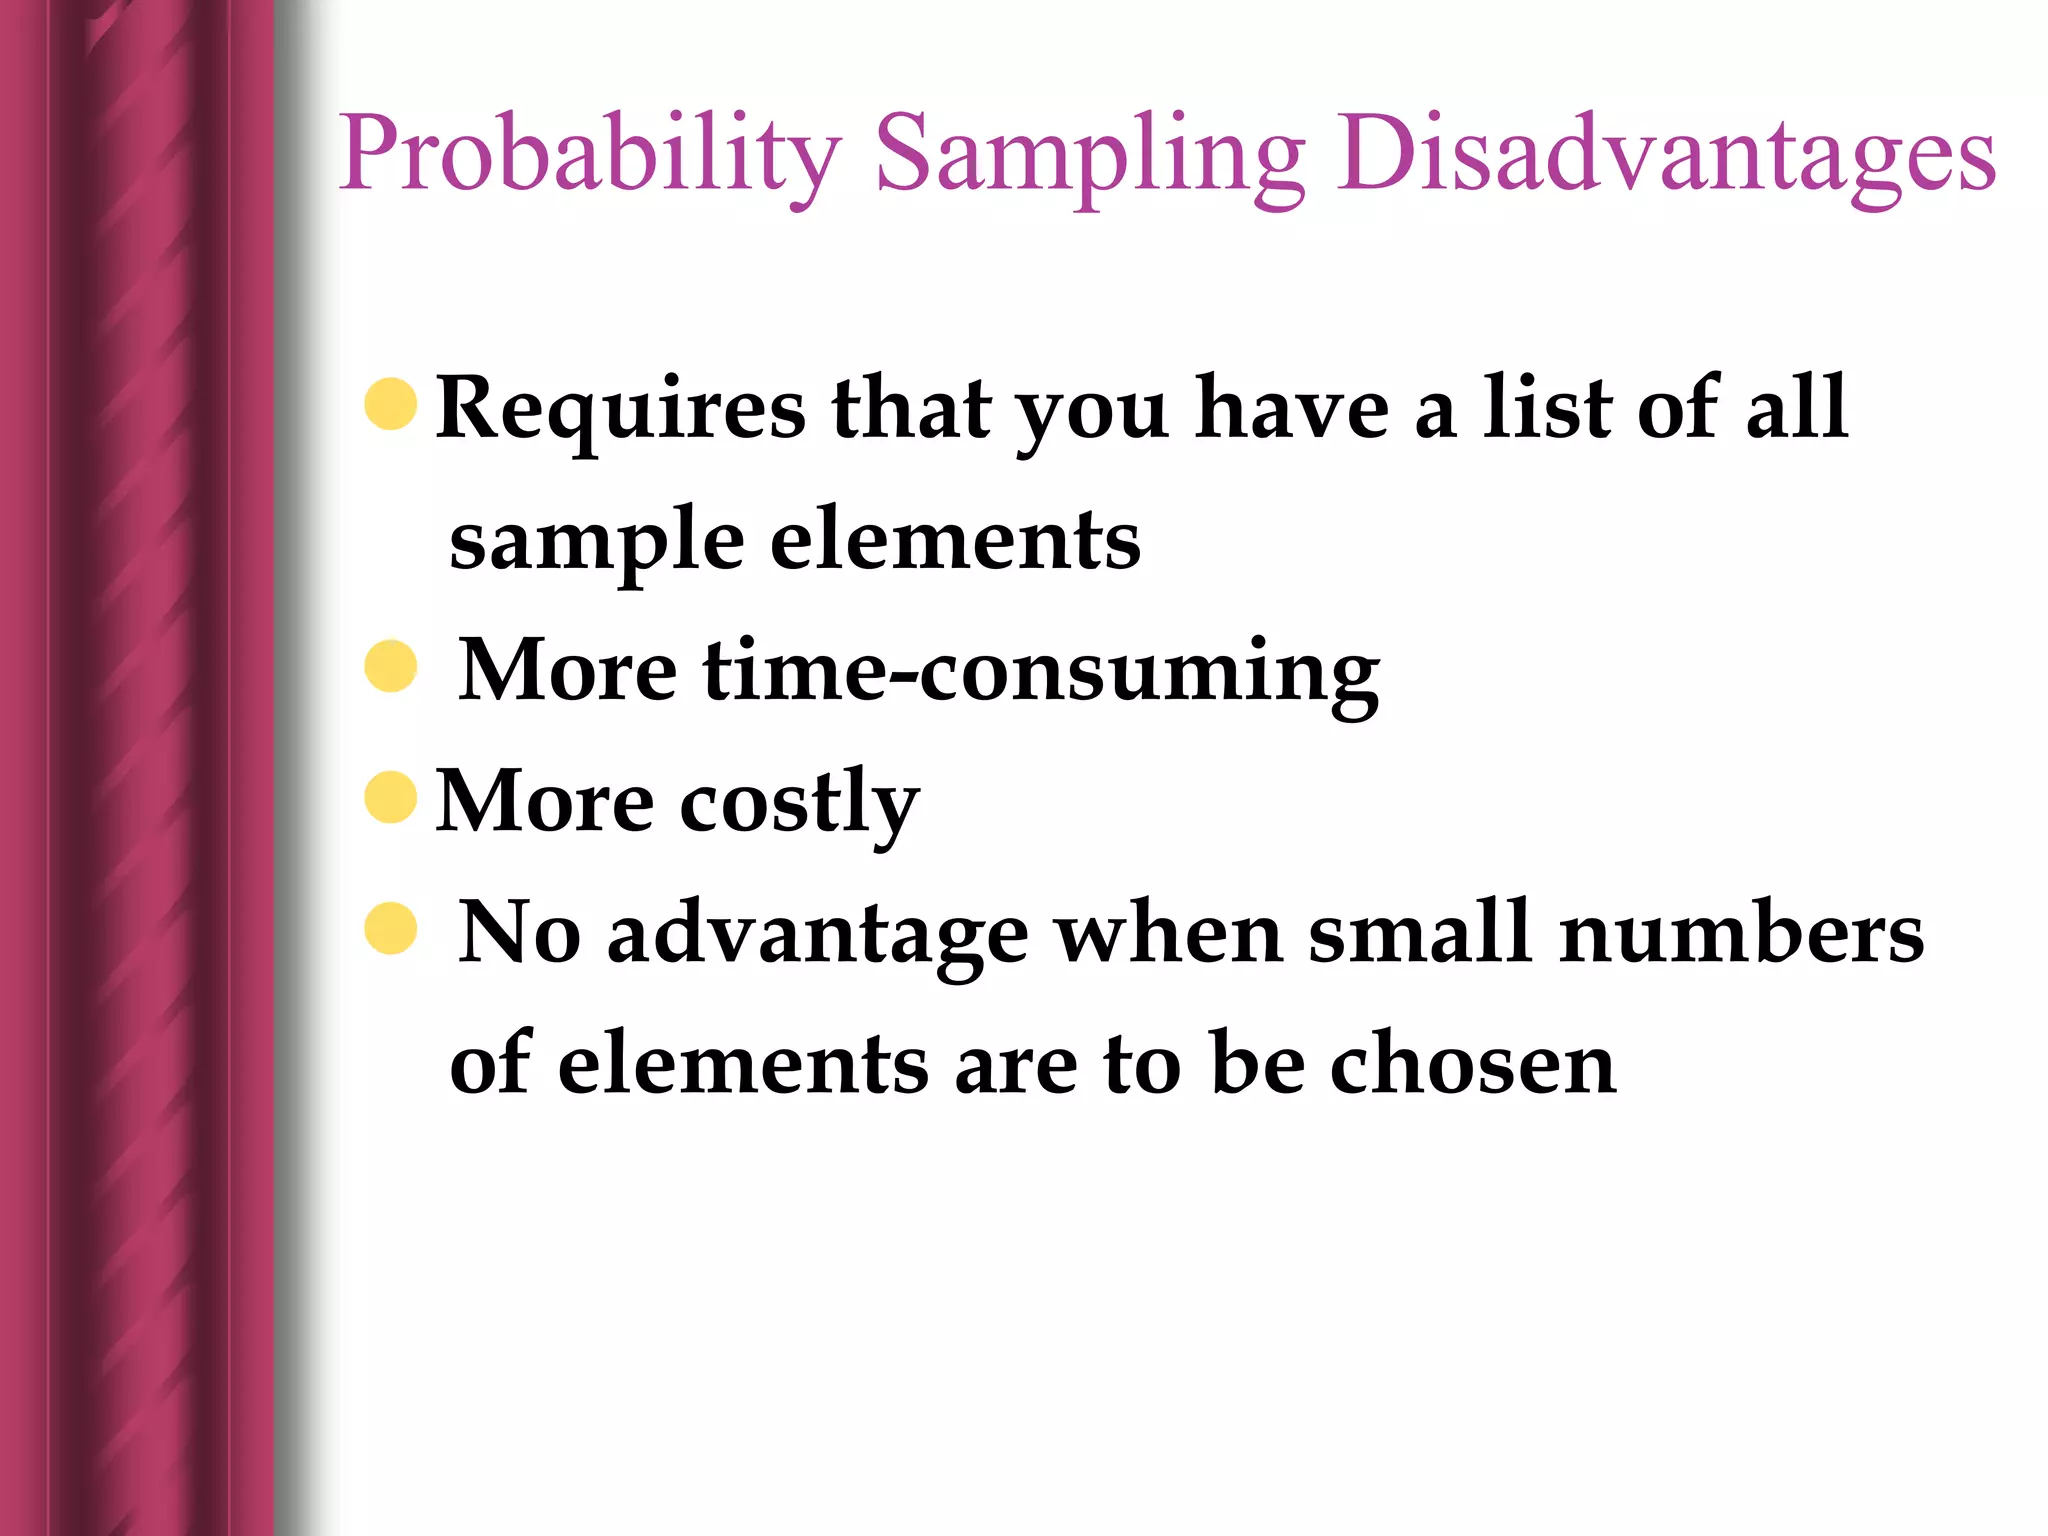
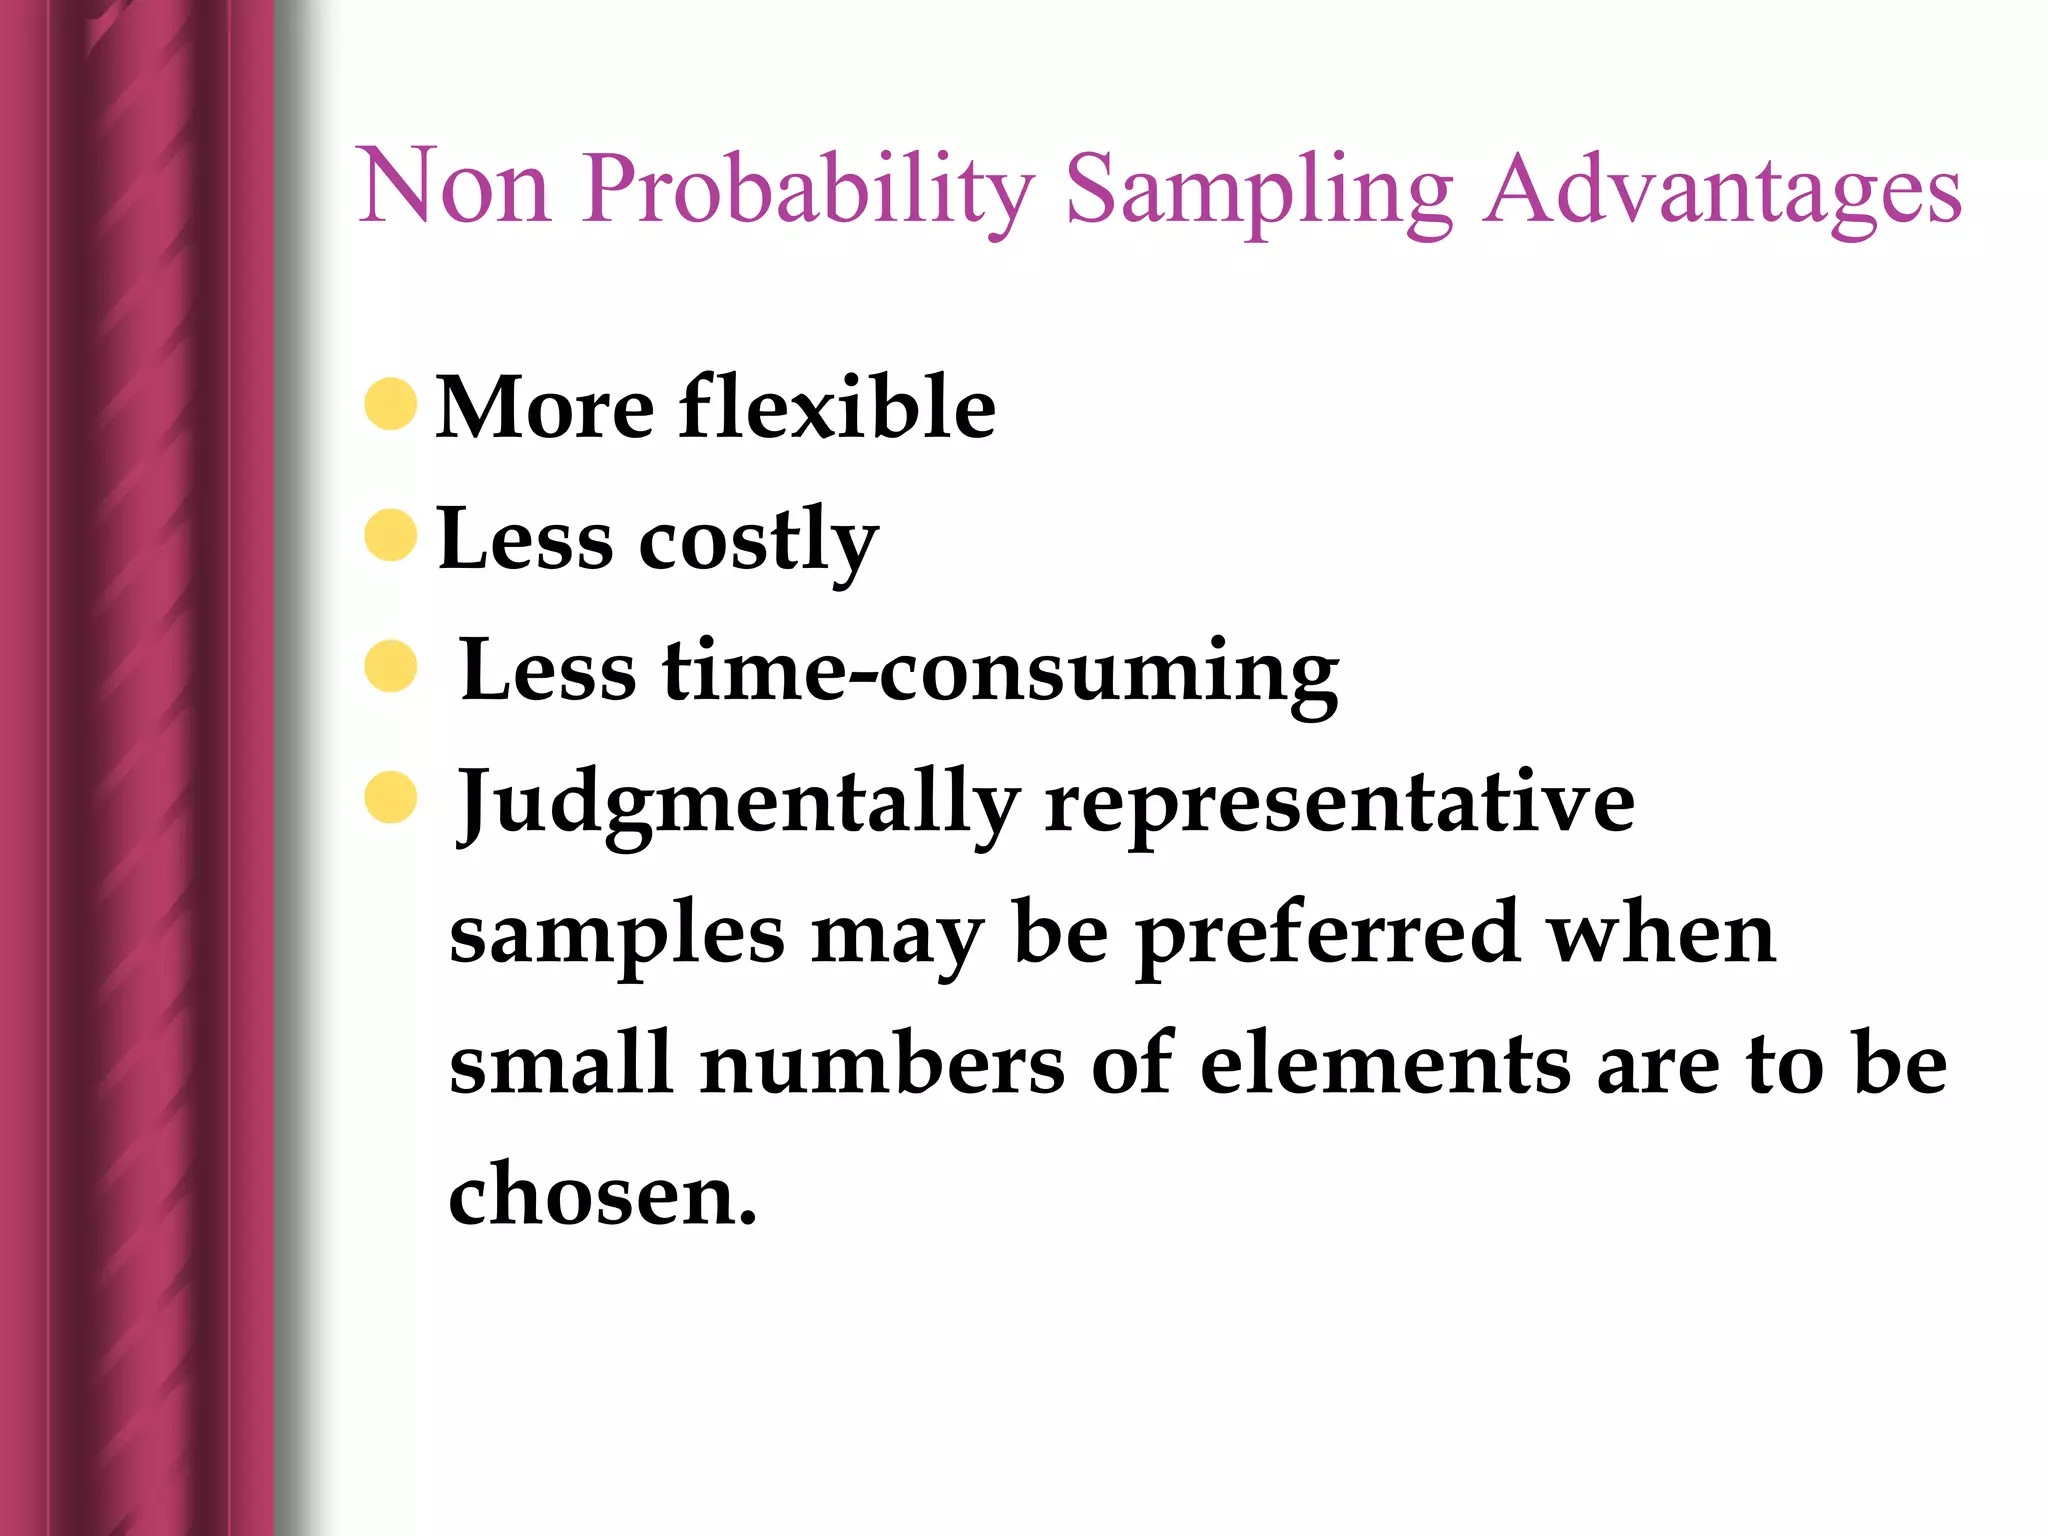
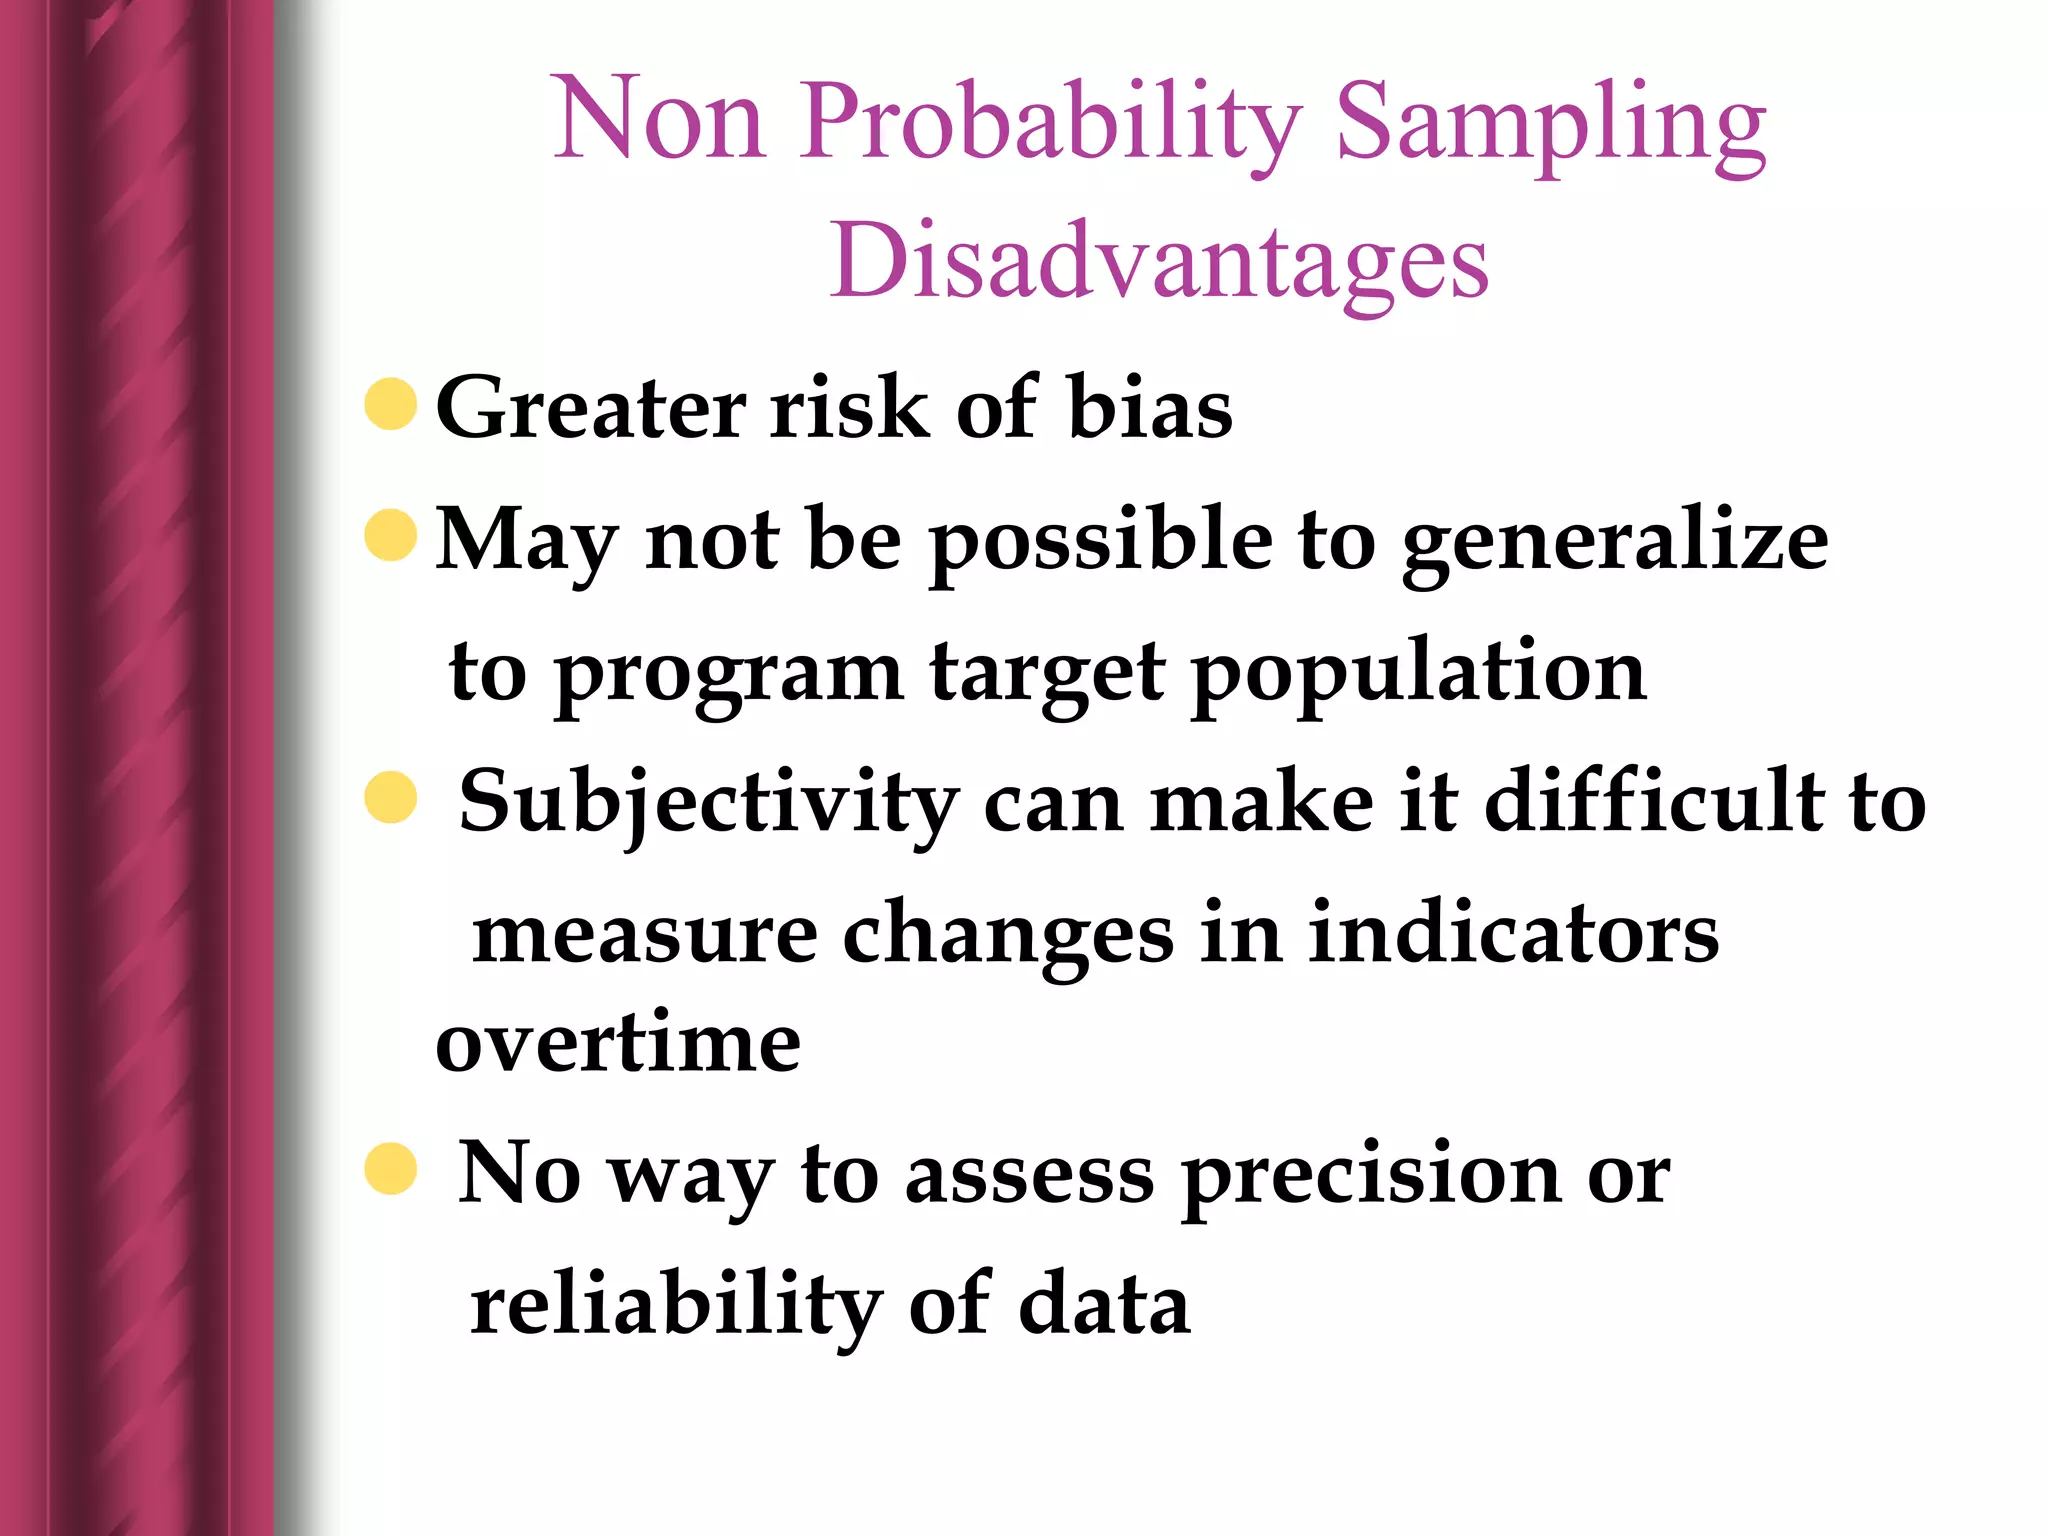


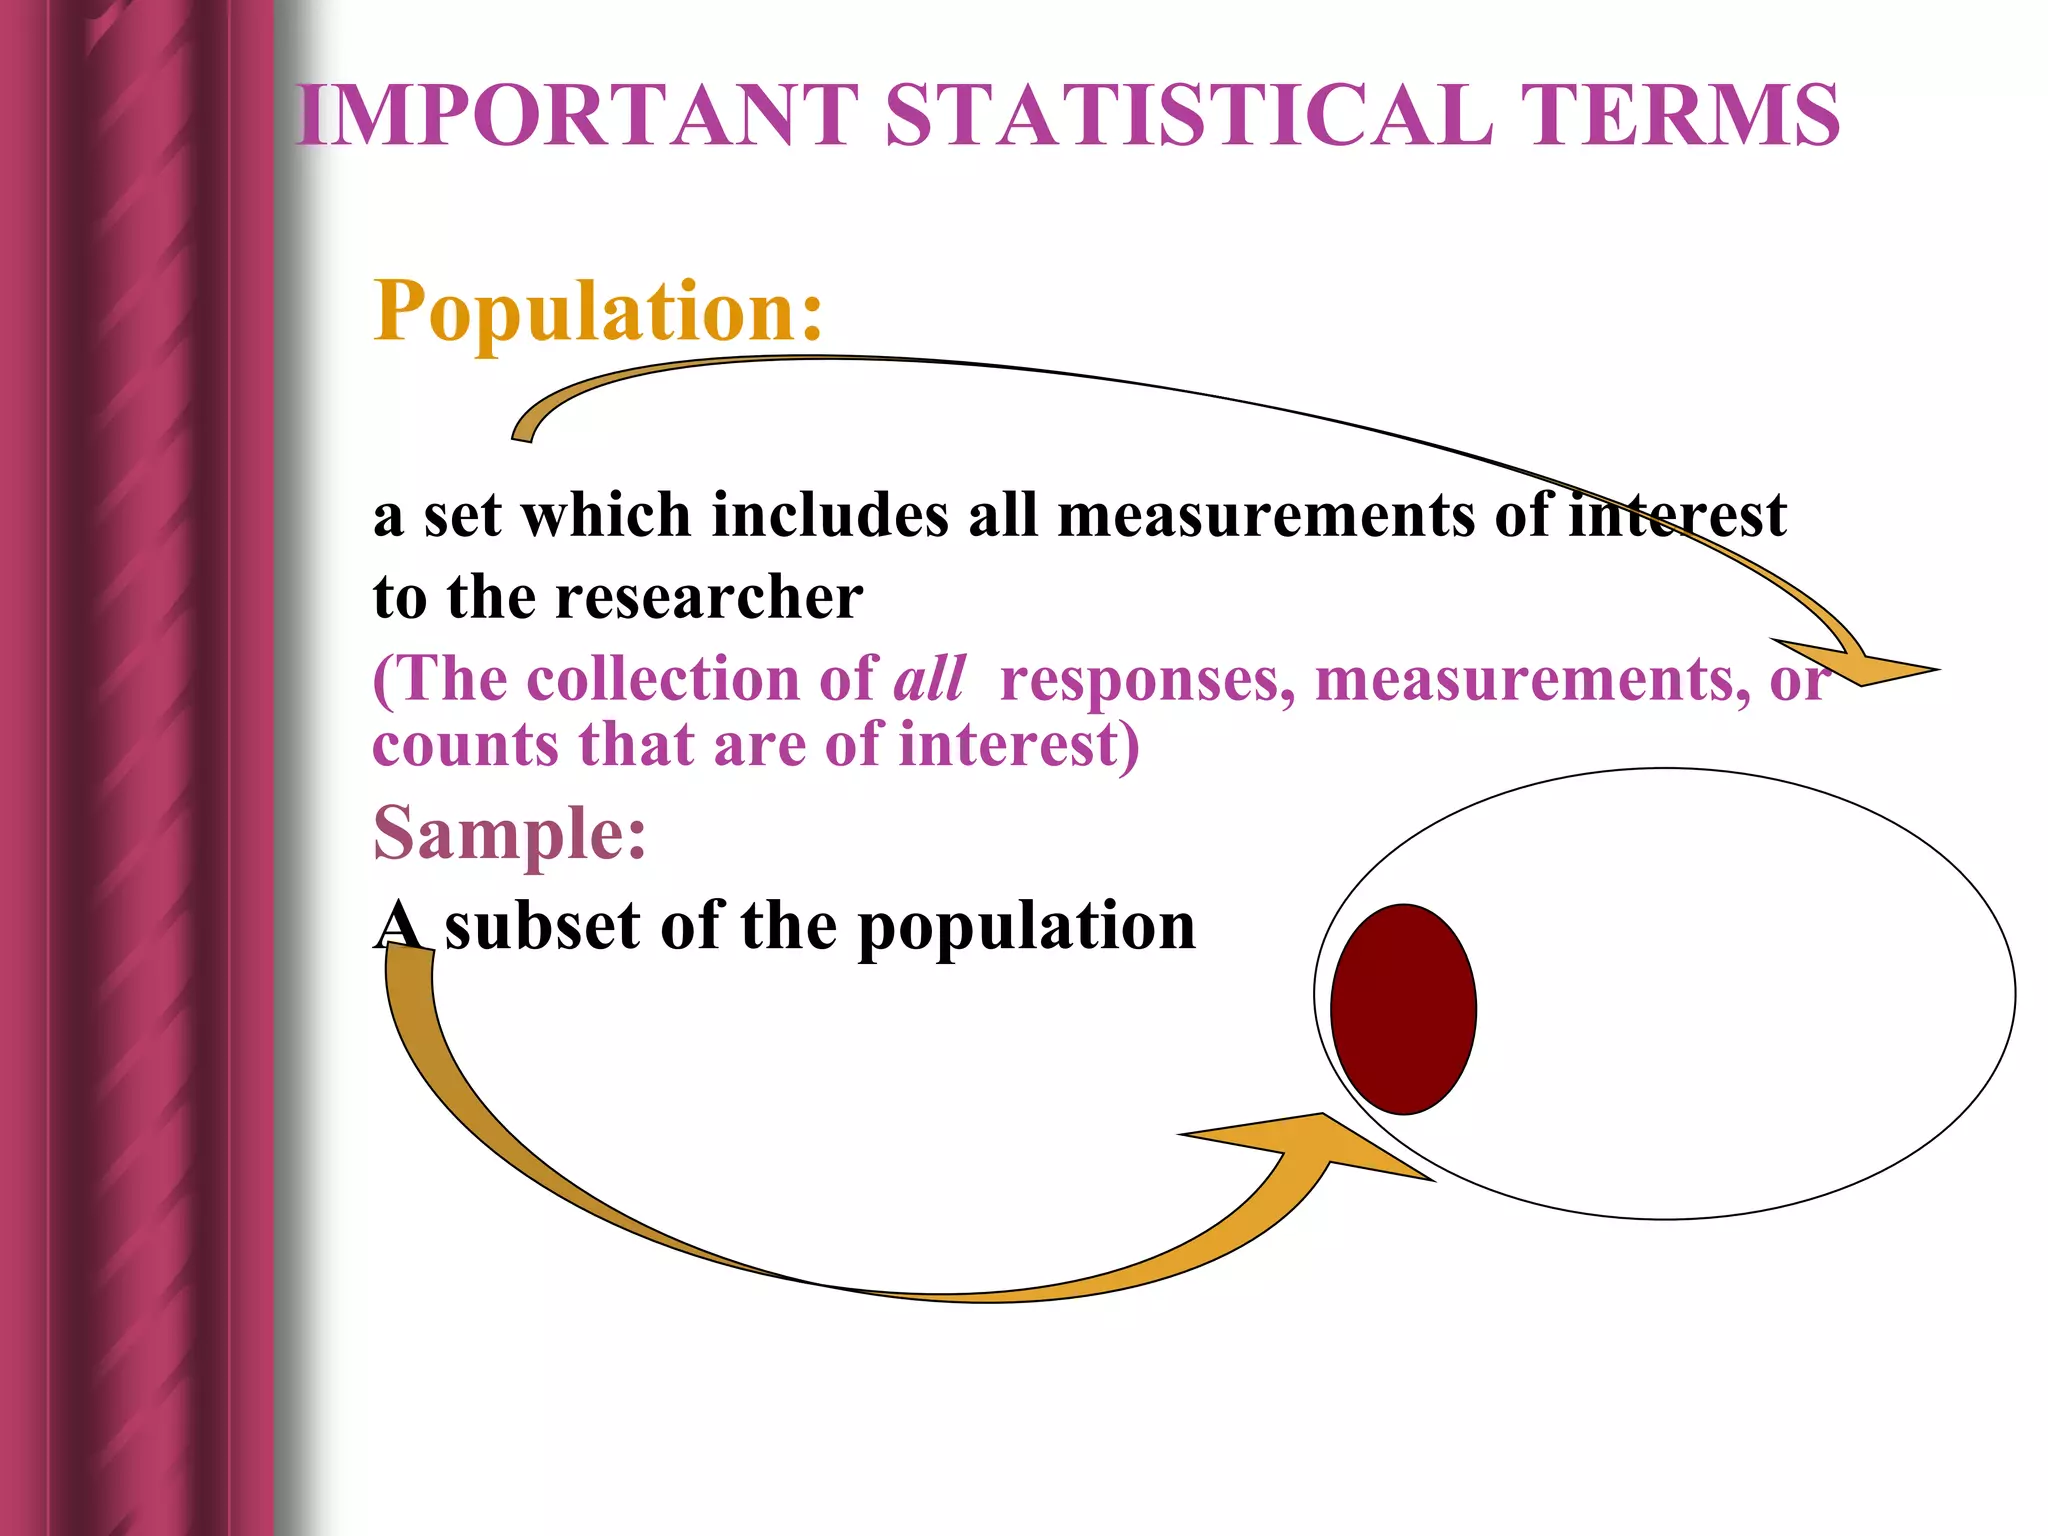
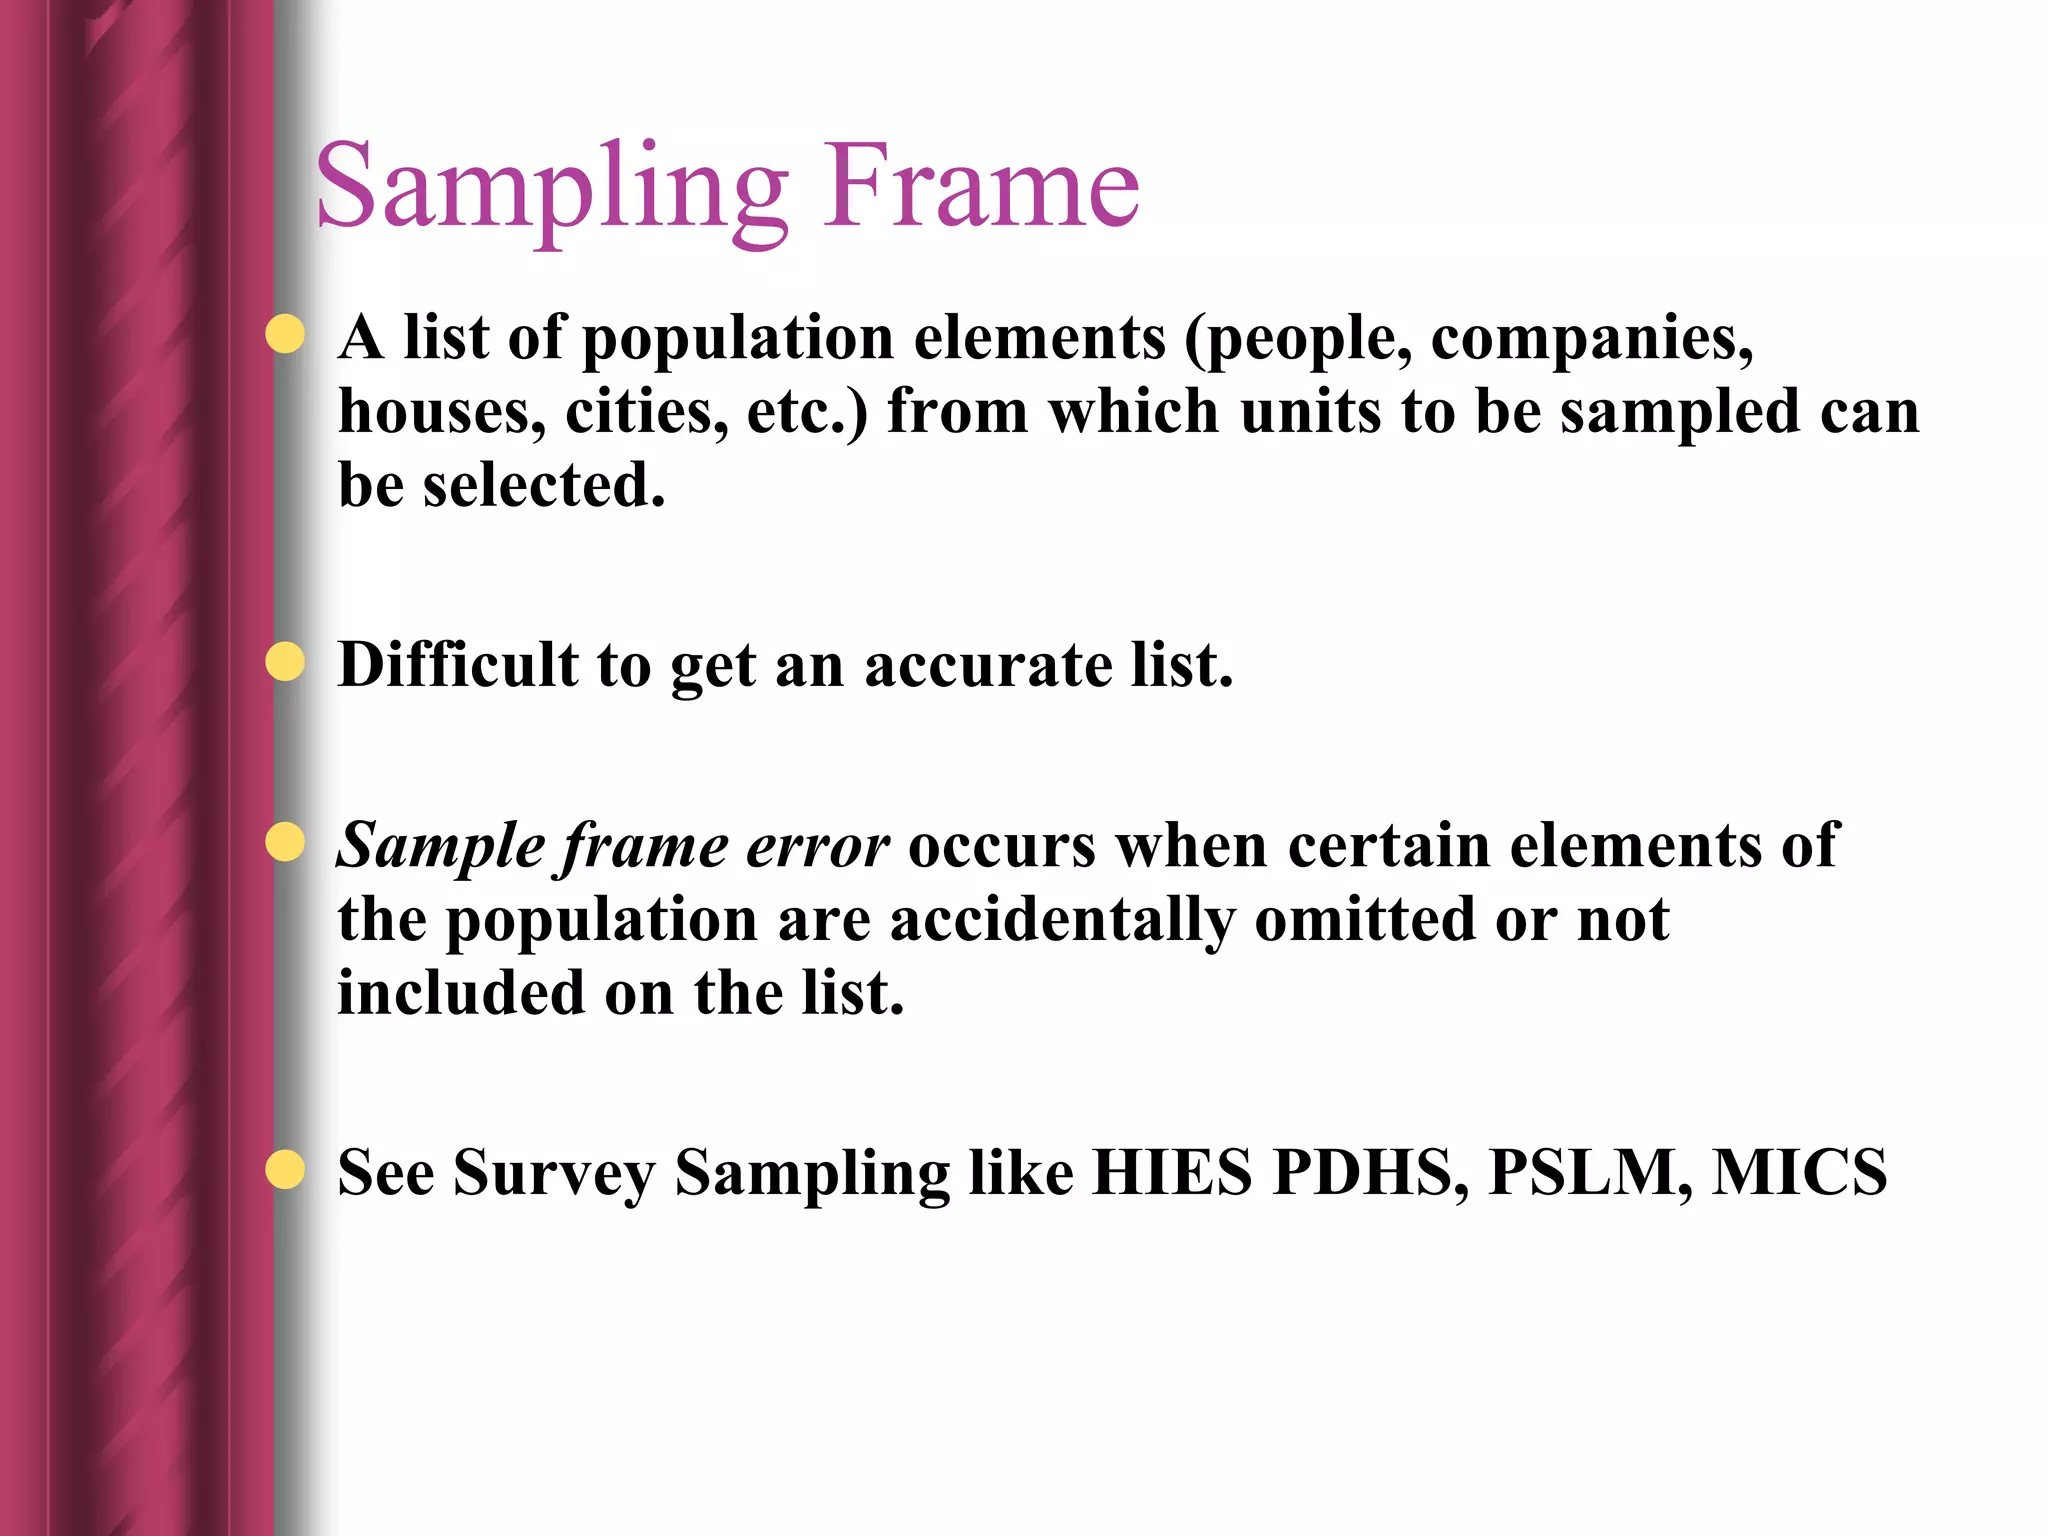
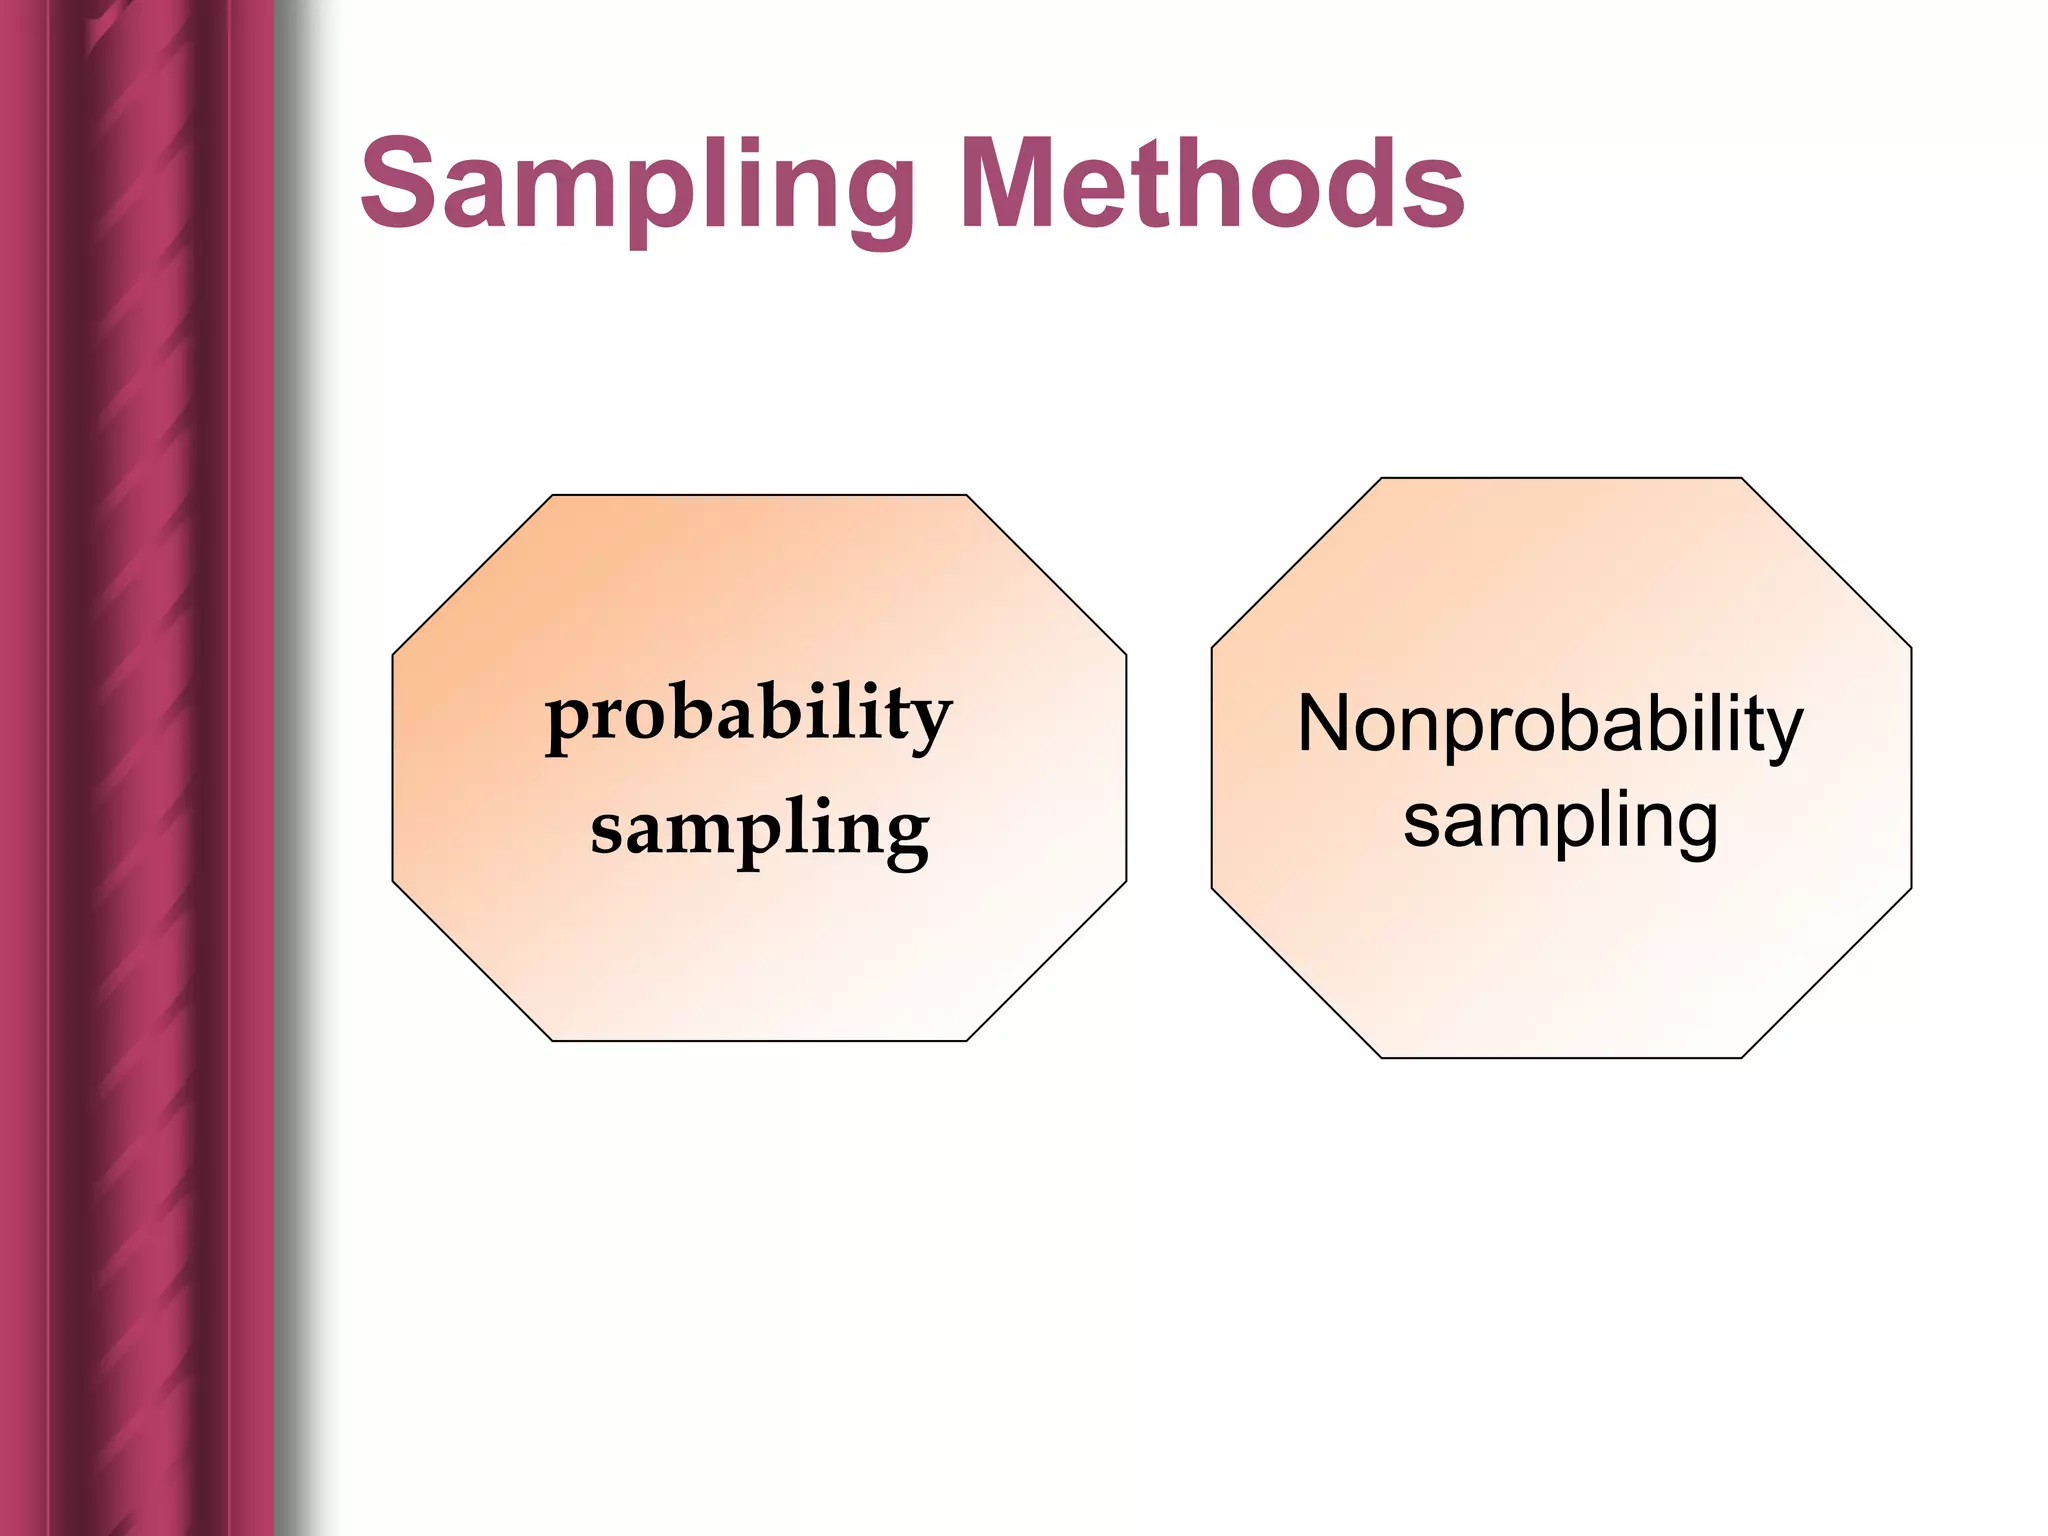
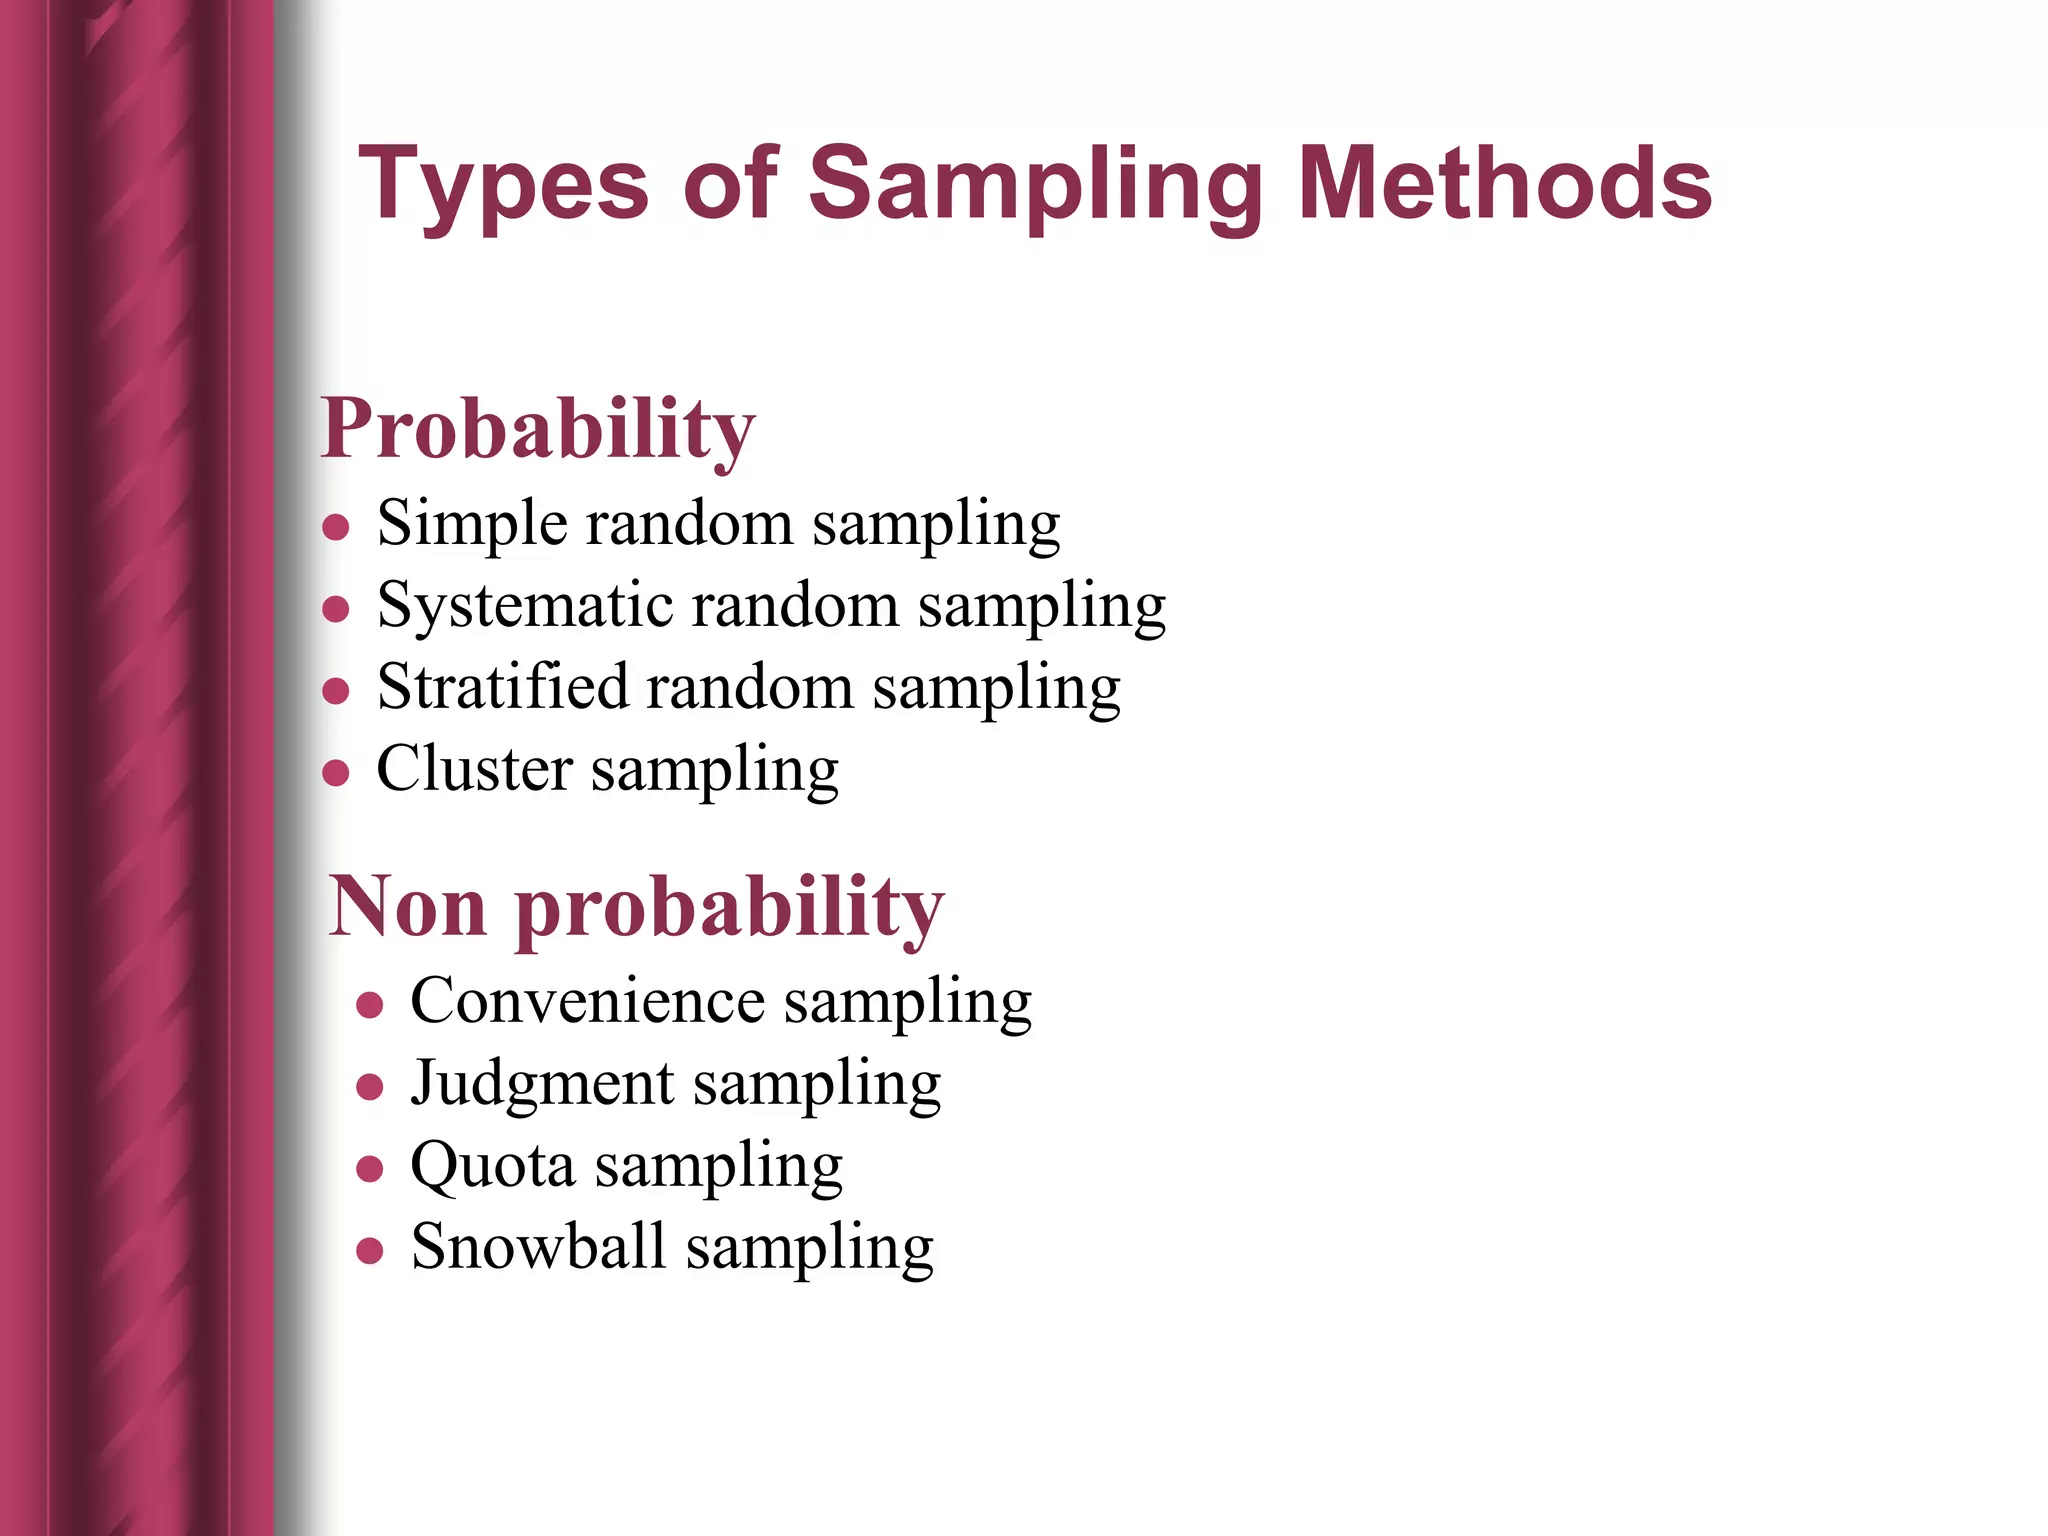
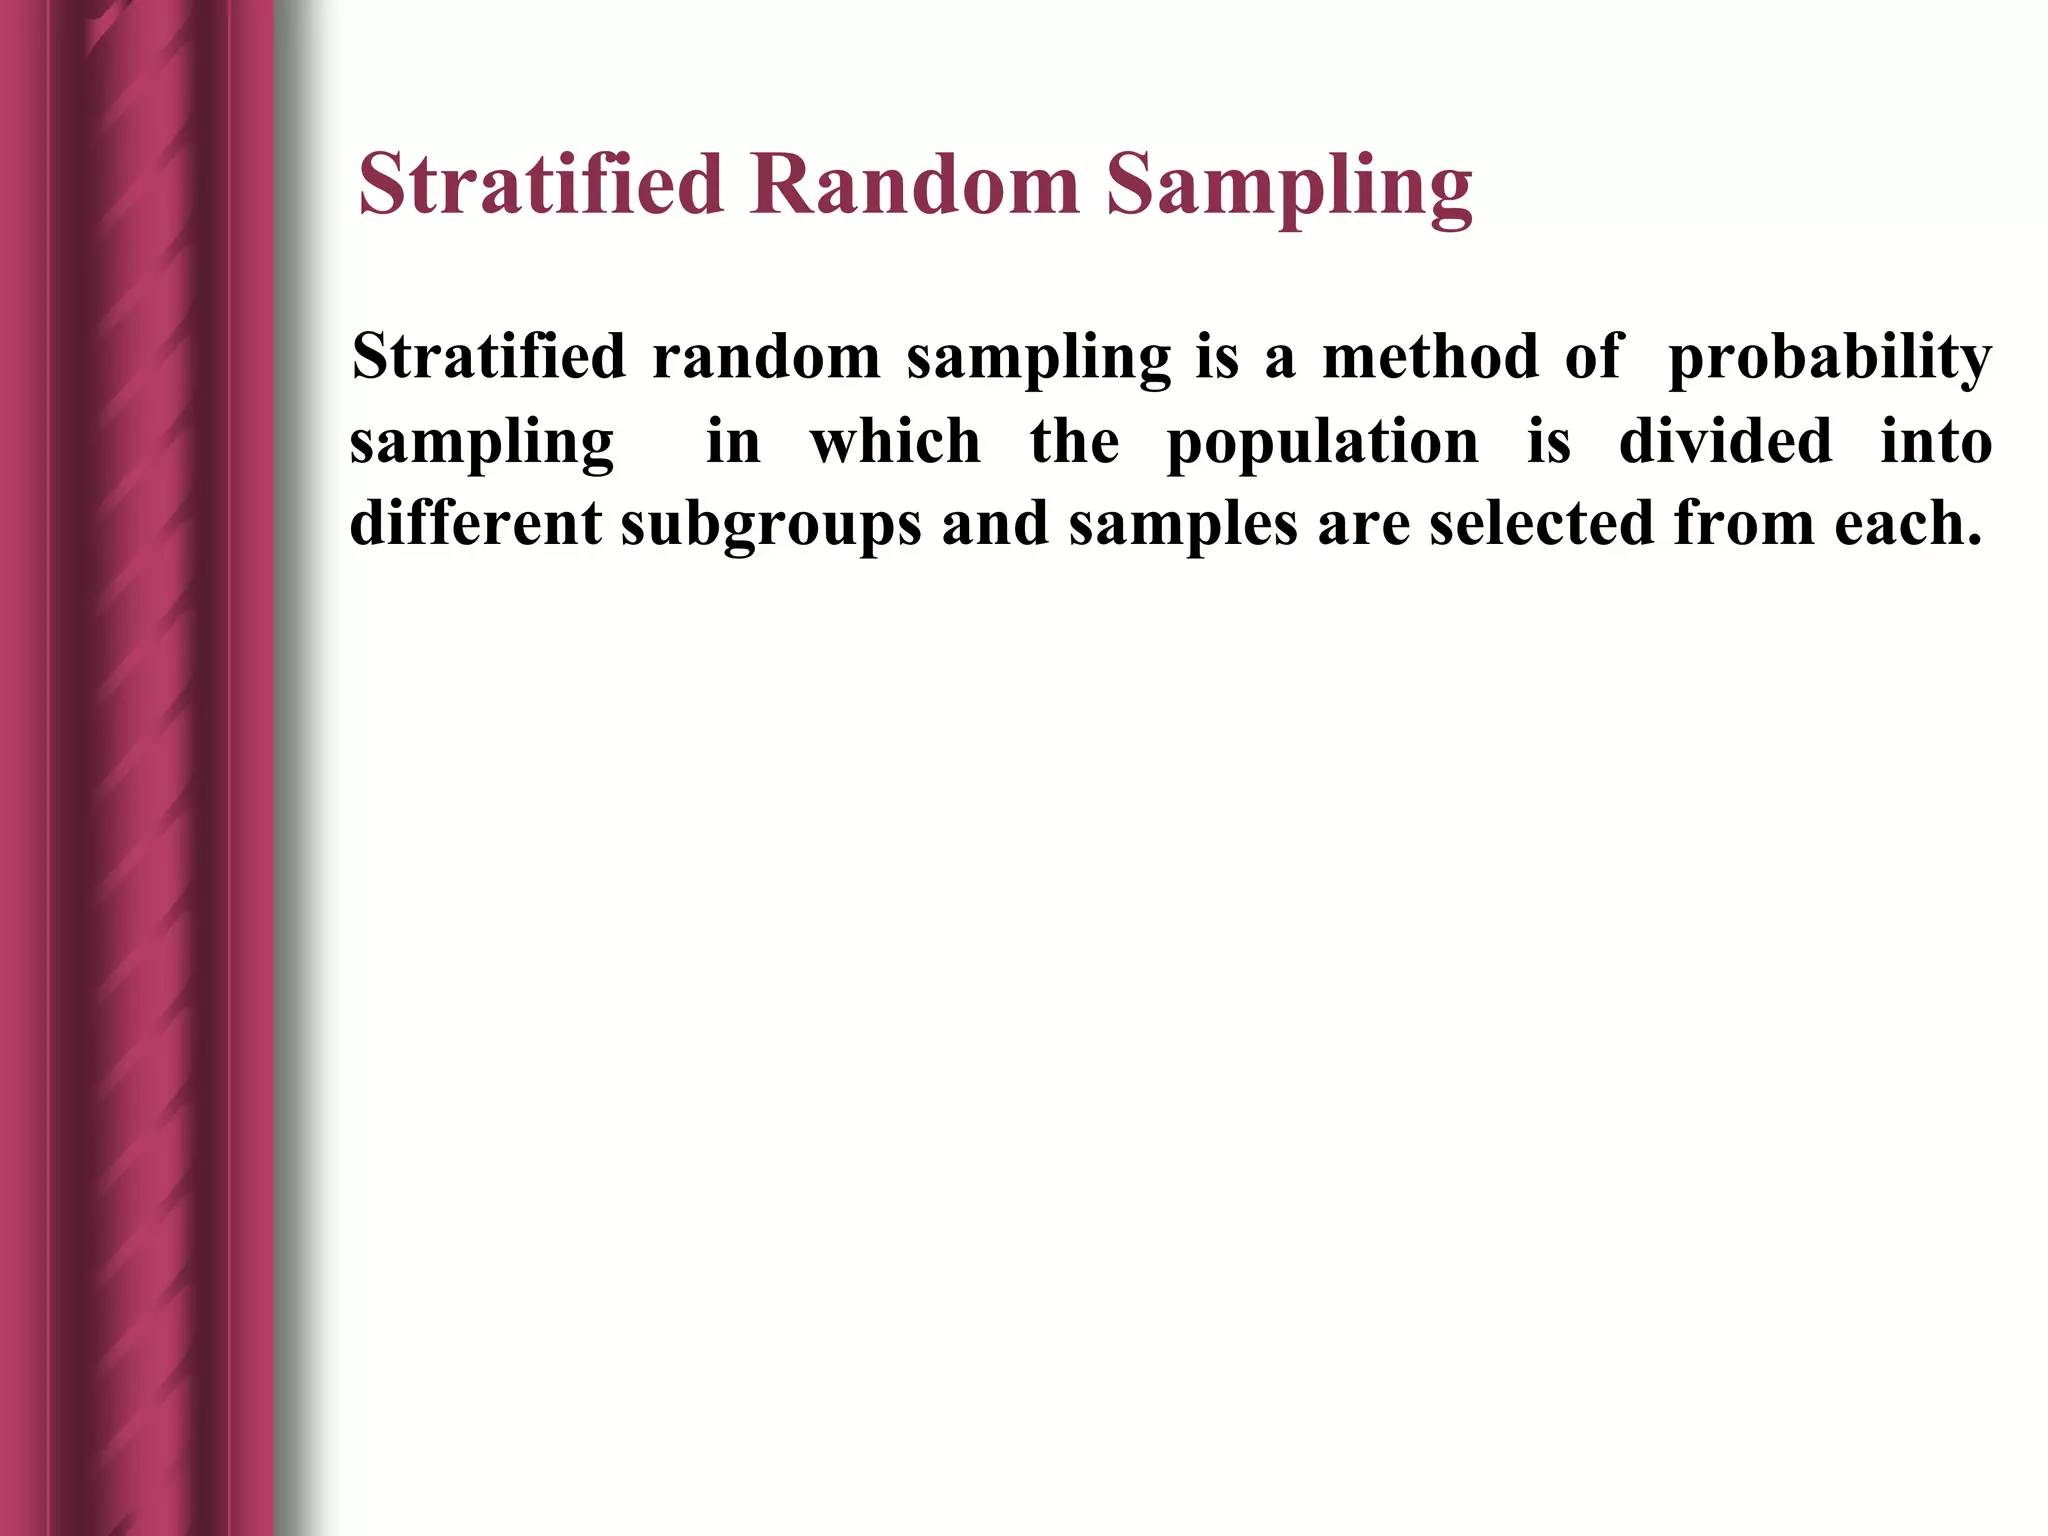
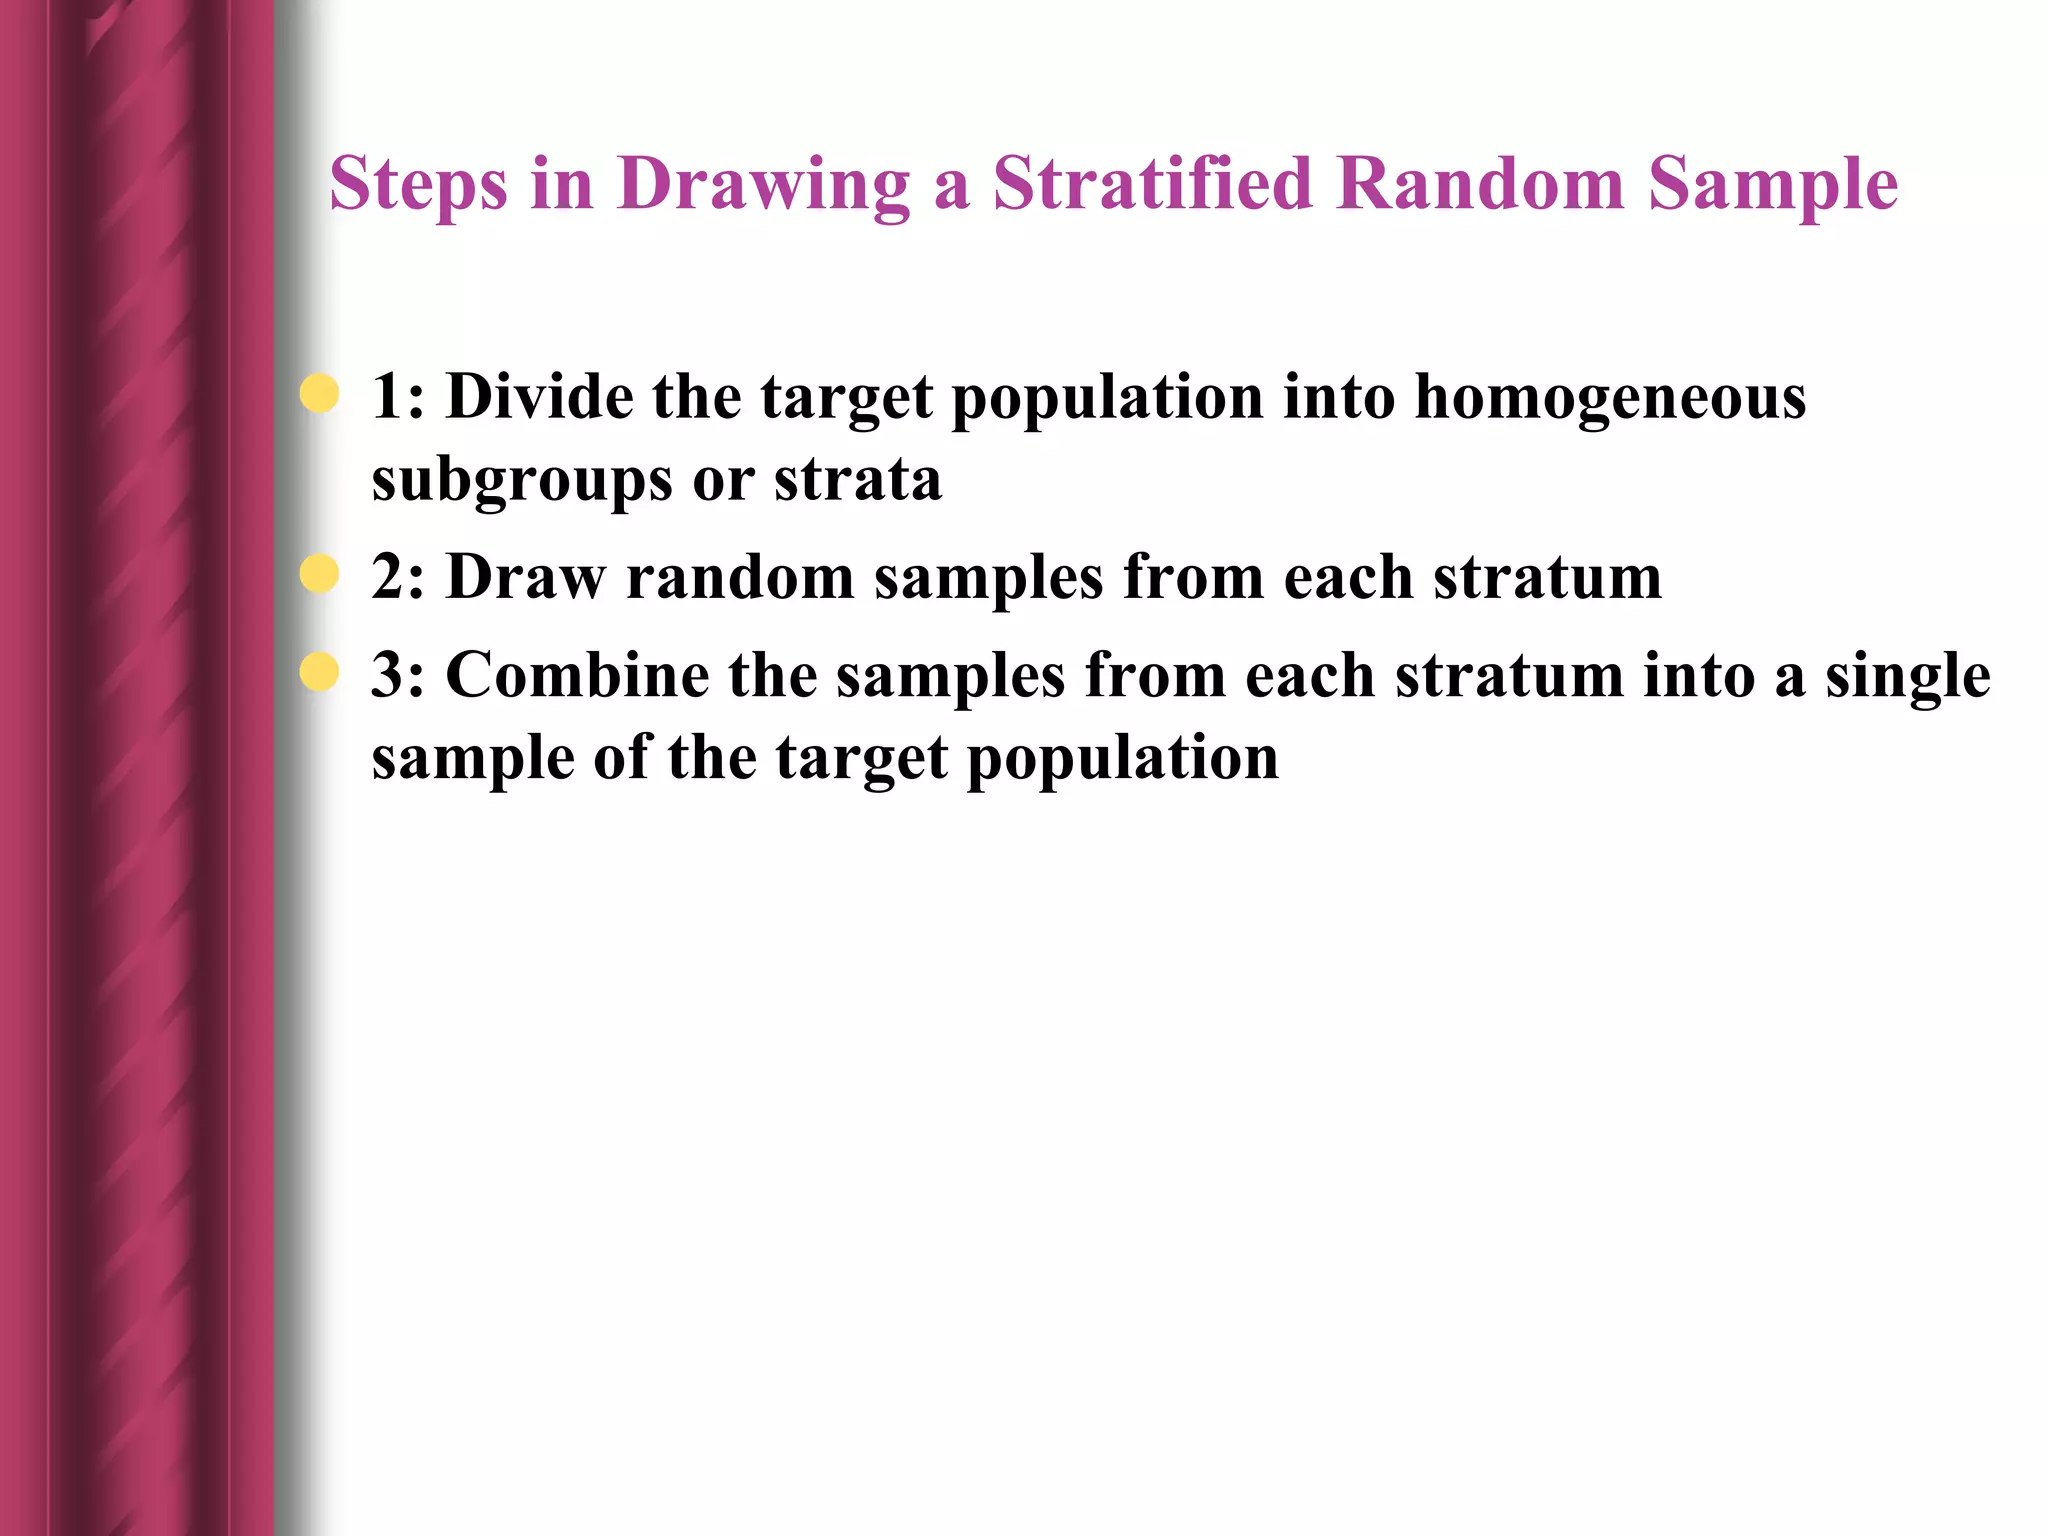
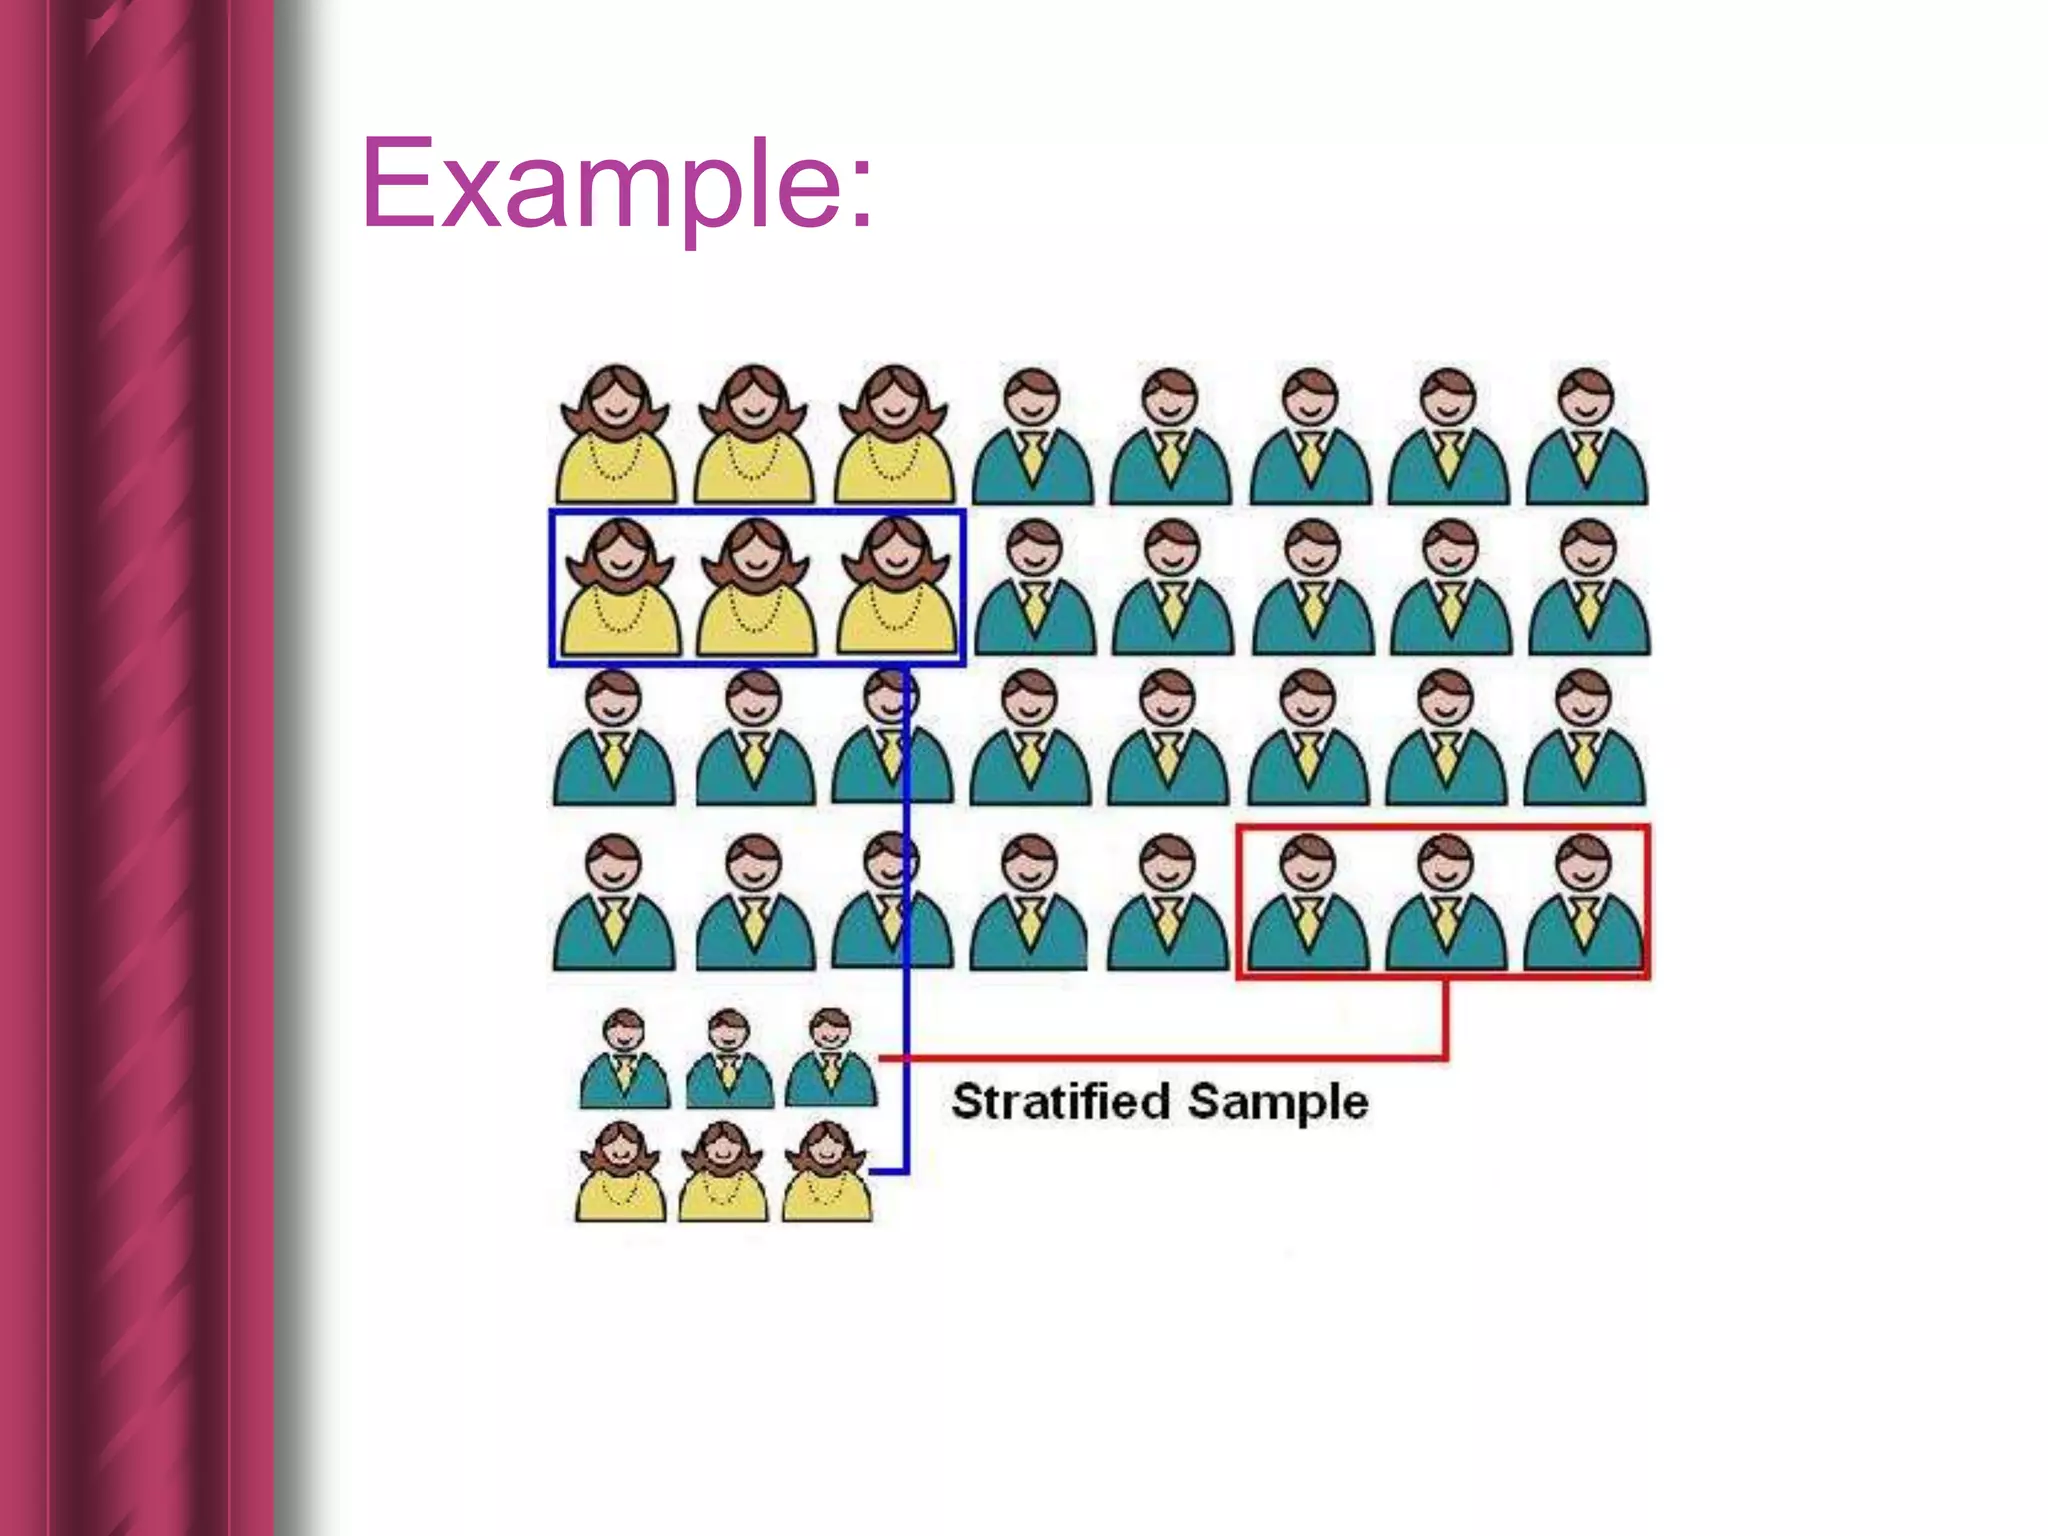
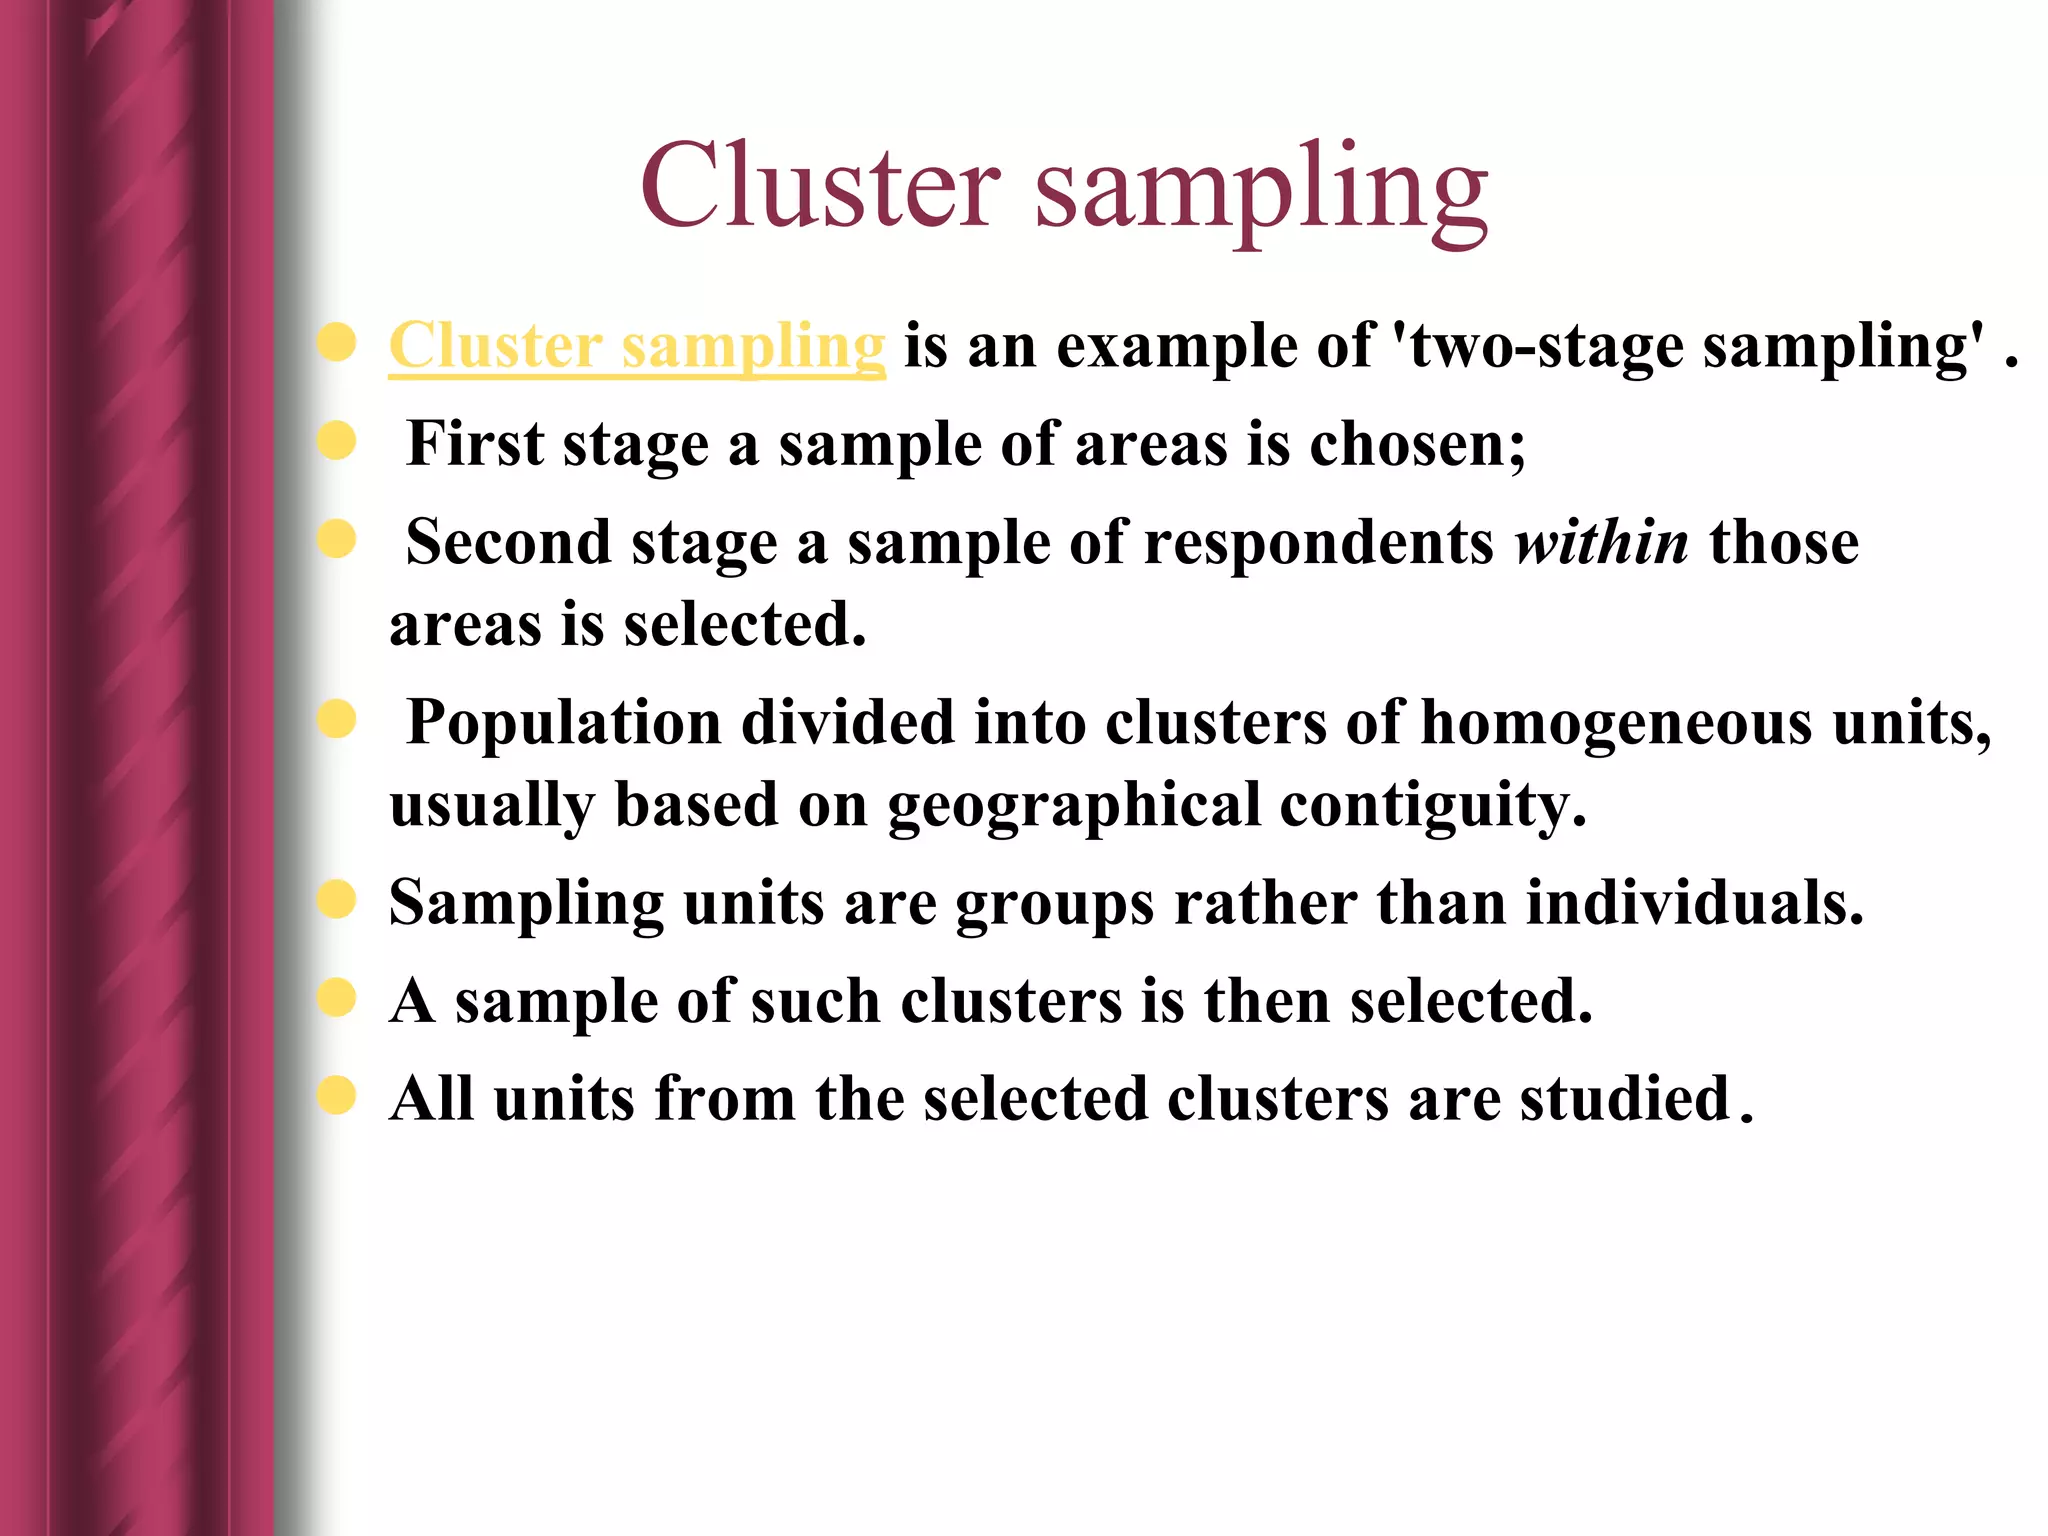
This document discusses sampling methods used in research. It outlines key concepts like population, sample, probability sampling, and non-probability sampling. Probability sampling methods like simple random sampling, systematic sampling, stratified sampling and cluster sampling are explained. Non-probability methods like convenience sampling, judgment sampling, and quota sampling are also outlined. Factors to consider for determining sample size and types of errors in sampling are discussed. The advantages and disadvantages of probability and non-probability sampling are compared.


