Downloaded 50 times


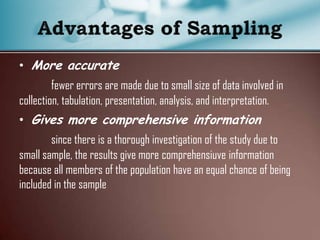

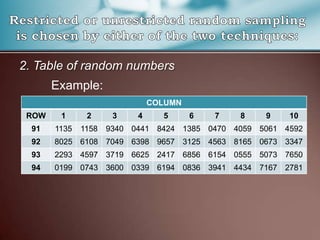
![6. Determine the sample size by using the formula,
NV + [Se2 (1-p)]
NSe + [V2 p(1-p)]
Where:
Ss – sample size
N – population
V – standard value (2.58) of 1% level of
probability with 0.99 reliability level
Se – sampling error (0.01)
p – the largest possible proportion (0.50)](https://image.slidesharecdn.com/samplingdesigns-140519053600-phpapp02/85/Sampling-designs-8-320.jpg)
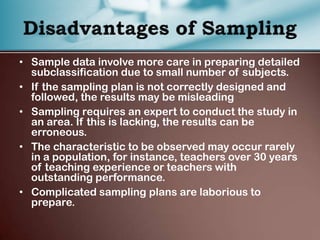
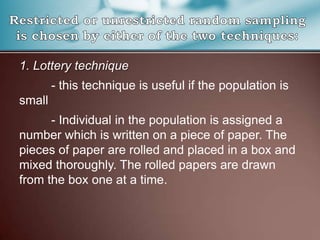
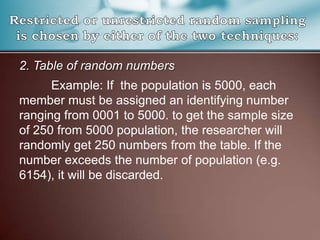
![• Step 1. Determine the total population (N) as
assumed subjects of the study.
• Step 2. Get the value of V(2.58), Se (0.01), and
p (0.50).
• Step 3. Compute the sample size using the
formula:
NV + [Se2 (1-p)]
NSe + [V2 p(1-p)]](https://image.slidesharecdn.com/samplingdesigns-140519053600-phpapp02/85/Sampling-designs-10-320.jpg)
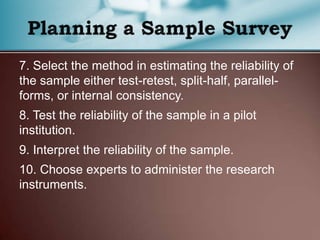
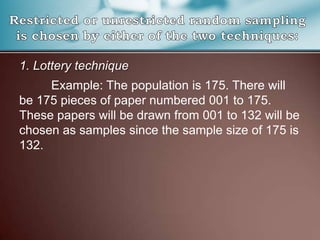
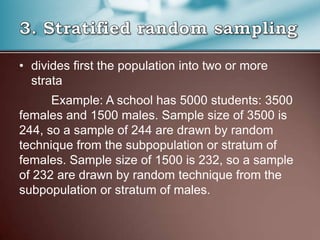
![Given:
N = 900
V = 2.58
Se = 0.01
p = 0.50
NV + [Se2 (1-p)]
NSe + [V2 p(1-p)]
900(2.58) + (0.01)2 x (1– 0.50)
900(0.01)+(2.58)2 x 0.50(1- 0.50)
2322 + 0.0001 x 0.50
9 + 6.6564 x 0.50 (0.50)
2322 + 0.00005
9 + 6.6564 (0.25)
2322.00005
9 + 1.6641
2322.00005
10.6641
Ss = 218](https://image.slidesharecdn.com/samplingdesigns-140519053600-phpapp02/85/Sampling-designs-12-320.jpg)


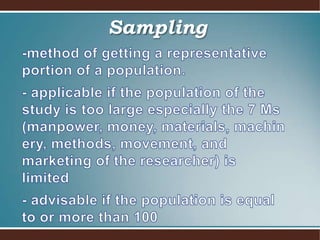
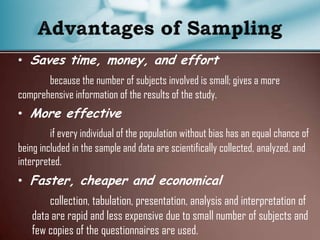
This document discusses different sampling methods that can be used in research. It defines sampling as selecting a subset of individuals from within a population to gather data and make inferences about the entire population. The key methods discussed are scientific sampling methods, like random sampling and stratified sampling, which aim to select representative samples, and non-scientific sampling methods, like purposive and quota sampling, which do not give all individuals an equal chance of being selected. Formulas are provided for determining sample size needed based on the overall population size.