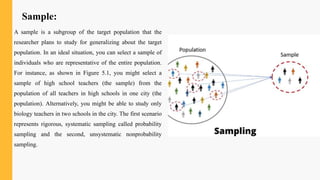
SlideShare a Scribd company logo
Research
Methodology
Dr. Hafiz Kosar
RESEARCH METHODOLOGY
01
03 04
Population
Sampling Techniques
Sample
Sample Size
02
The first step in the process of collecting quantitative data is to
identify the people and places you plan to study. This involves
determining whether you will study individuals or entire
organizations (e.g., schools) or some combination. If you select
either individuals or organizations, you need to decide what type of
people or organizations you will actually study and how many you
will need for your research. These decisions require that you decide
on a unit of analysis, the group and individuals you will study, the
procedure for selecting these individuals, and assessing the numbers
of people needed for your data analysis.
Who can supply the information that you will use to answer your quantitative research questions or hypotheses? Some possibilities
might be students, teachers, parents, adults, some combination of these individuals, or entire schools.At this early stage in data
collection, you must decide at what level (e.g., individual, family, school, school district) the data needs to be gathered. This level is
referred to as the unit of analysis. In some research studies, educators gather data from multiple levels (e.g., individuals and
schools), whereas other studies involve collecting data from only one level (e.g., principals in schools). This decision depends on the
questions or hypotheses that you seek to answer.Also, the data for measuring the independent variable may differ from the unit for
assessing the dependent variable. For example, in the study of the impact of adolescent aggression on school climate, a researcher
would measure the independent variable, adolescent aggression, by collecting data from individuals while measuring the dependent
variable, school climate, based on data from entire schools and their overall climates (e.g., whether students and teachers believe the
school curriculum supports learning). If Faiza wants to answer the question “Why do students carry weapons in high school?” what
unit of analysis will she study?Alternatively, if she wanted to compare answers to the question “Why do students carry weapons in
rural high schools and urban high schools?” what two types of units of analysis will she study?
Identify Your Unit of Analysis
If you select an entire school to study or a small number of individuals, you need to consider what individuals or schools you will study.
In some educational situations, you will select individuals for your research based on who volunteers to participate or who is available
(e.g., a specific classroom of students). However, those individuals may not be similar (in personal characteristics or performance or
attitudes) to all individuals who could be studied. A more advanced research process is to select individuals or schools who are
representative of the entire group of individuals or schools.
Representative refers to the selection of individuals from a sample of a population such that the individuals selected are typical of the
population under study, enabling you to draw conclusions from the sample about the population as a whole. This definition is loaded
with terms, and we will sort them so that you can see alternative procedures for deciding what individuals or organizations to study.
“Apopulation is a group of individuals who have the same characteristic.”
For example, all teachers would make up the population of teachers, and all high school administrators in a school district
would comprise the population of administrators. As these examples illustrate, populations can be small or large. You need
to decide what group you would like to study. In practice, quantitative researchers’sample from lists and people available. A
target population (or the sampling frame) is a group of individuals (or a group of organizations) with some common defining
characteristic that the researcher can identify and study. Within this target population, researchers then select a sample for
study.
Specify the Population and Sample
Sample:
A sample is a subgroup of the target population that the
researcher plans to study for generalizing about the target
population. In an ideal situation, you can select a sample of
individuals who are representative of the entire population.
For instance, as shown in Figure 5.1, you might select a
sample of high school teachers (the sample) from the
population of all teachers in high schools in one city (the
population). Alternatively, you might be able to study only
biology teachers in two schools in the city. The first scenario
represents rigorous, systematic sampling called probability
sampling and the second, unsystematic nonprobability
sampling.
Probability
Sampling
In Statistics, there are different sampling techniques
available to get relevant results from the population.
The two different types of sampling methods are:
Sampling Techniques
Non-probability
Sampling
Probability Sampling Methods
• Probability sampling means that every member of the
population has a chance of being selected. It is mainly used
in quantitative research. If you want to produce results that
are representative of the whole population, probability
sampling techniques are the most valid choice.
• The probability sampling method utilizes some form of
random selection. In this method, all the eligible individuals
have a chance of selecting the sample from the whole
sample space. This method is more time consuming and
expensive than the non-probability sampling method. The
benefit of using probability sampling is that it guarantees
the sample that should be the representative of the
population.
Non-Probability Sampling
Method
In a non-probability sample, individuals are selected based on non-random criteria, and not every individual has a
chance of being included. The non-probability sampling method is a technique in which the researcher selects the
sample based on subjective judgment rather than the random selection. In this method, not all the members of the
population have a chance to participate in the study.
• This type of sample is easier and cheaper to access, but it has a higher risk of sampling bias. That means the
inferences you can make about the population are weaker than with probability samples, and your conclusions
may be more limited. If you use a non-probability sample, you should still aim to make it as representative of
the population as possible.
• Non-probability sampling techniques are often used in exploratory and qualitative research. In these types of
research, the aim is not to test a hypothesis about a broad population, but to develop an initial understanding of
a small or under-researched population.
In simple random sampling technique, every item in the population has an equal and likely chance of being selected in the sample. Since
the item selection entirely depends on the chance, this method is known as “Method of chance Selection”. As the sample size is large, and
the item is chosen randomly, it is known as “Representative Sampling”.
For larger populations, a manual lottery method can be quite time-consuming. Selecting a random sample from a large population usually
requires a computer-generated process, by which the same methodology as the lottery method is used. Among the disadvantages of this
technique are difficulty gaining access to respondents that can be drawn from the larger population, greater time, greater costs, and the fact
that bias can still occur under certain circumstances formed by computers, not humans.
Simple Random Sampling/Lottery Method
Probability Sampling Types
Probability Sampling methods are further classified into different types, such as simple random sampling, systematic
sampling, stratified sampling, and clustered sampling.
Example:
An example of a simple random sample would be the names of 25 employees being chosen out of a hat from a company of 250
employees. In this case, the population is all 250 employees, and the sample is random because each employee has an equal chance of
being chosen.
Suppose we want to select a simple random sample of 200 students from a school. Here, we can assign a number to every student in the
school database from 1 to 500 and use a random number generator to select a sample of 200 numbers.
In the systematic sampling method, the items are selected from the target population by selecting the random selection point and selecting
the other methods after a fixed sample interval. It is calculated by dividing the total population size by the desired population size.
Systematic Sampling
Example:
Suppose the names of 300 students of a school are sorted in the reverse alphabetical order. To select a sample in a systematic sampling
method, we have to choose some 15 students by randomly selecting a starting number, say 5. From number 5 onwards, will select every
15th person from the sorted list. Finally, we can end up with a sample of some students.
Let us say that the researcher is working with a school of 1,400 students; by looking at the table of sample size required for a random
sample of these 1,400 students we see that 302 students are required to be in the sample. Hence the frequency interval (f) is: 1, 400 302 =
4.635 (which rounds up to 5.0) Hence the researcher would pick out every fifth name on the list of cases. Alist of females and males might
list all the females first, before listing all the males; if there were 200 females on the list, the researcher might have reached the desired
sample size before reaching that stage of the list which contained males.
Systematic Sampling...
Step one
Develop a defined structural
audience to start working on the
sampling aspect.
Step two:
As a researcher, figure out the
ideal size of the sample, i.e.,
how many people from the
entire population to choose to
be a part of the sample.
Step four:
Define the interval of this
sample. This will be the
standard distance between the
elements.
Step three:
Once you decide the sample
size, assign a number to every
member of the sample.
Here are the steps to form a systematic sample:
For example, the sample interval should
be 10, which is the result of the division
of 5000 (N= size of the population) and
500 (n=size of the sample).
Systematic Sampling...
Step four...
Systematic Sampling Formula for interval (i)
= N/n = 5000/500 = 10
.
Step six:
Randomly choose the starting member (r) of
the sample and add the interval to the
random number to keep adding members in
the sample.
Step five:
Select the members who fit the
criteria which in this case will be 1 in
10 individuals
When you are sampling, ensure you represent the population fairly. Systematic sampling is a symmetrical process where
the researcher chooses the samples after a specifically defined interval. Sampling like this leaves the researcher no room
for bias regarding choosing the sample. To understand how it exactly works, take the example of the gym class where
the instructor asks the students to line up and asks every third person to step out of the line. Here, the instructor has no
influence over choosing the samples and can accurately represent the class.
Systematic sampling example
For instance, if a local NGO is seeking to form a systematic sample of 500 volunteers from a population of 5000, they
can select every 10th person in the population to build a sample systematically.
Systematic Sampling Types
Here are the types of systematic sampling:
1. Systematic random sampling
2. Linear systematic sampling
3. Circular systematic sampling
How systematic sampling works
Stratified Sampling
In a stratified sample, researchers divide a population into homogeneous subpopulations called strata (the plural of stratum) based on
specific characteristics (e.g., race, gender identity, location, etc.). Every member of the population studied should be in exactly one
stratum.
Each stratum is then sampled using another probability sampling method, such as cluster sampling or simple random sampling, allowing
researchers to estimate statistical measures for each sub-population.
Researchers rely on stratified sampling when a population’s characteristics are diverse and they want to ensure that every characteristic is
properly represented in the sample. This helps with the generalizability and validity of the study, as well as avoiding research biases like
under coverage bias.
Step 1: Separate the population into strata
Collect a list of every member of the population, and assign each member to a stratum.
You must ensure that each stratum is mutually exclusive (there is no overlap/similarity between them), but that together, they contain the
entire population.
Example: Separating the population into strata. You compile a list of every graduate’s name, gender identity, and the degree that they
obtained. Using this list, you stratify on two characteristics: gender identity, with three strata (male, female, and other), and degree, with
three strata (bachelor’s, master’s, and doctorate).
Combining these characteristics, you have nine groups in total. Each graduate must be assigned to exactly one group.
Characteristic Strata Groups
Gender Identity · Female· Male· Other 1. Male bachelor’s graduates,
2. Female bachelor’s graduates,
3. Other bachelor’s graduates
4. Male master’s graduates,
5. Female master’s graduates,
6. Other master’s graduates
7. Male doctoral graduates
Degree · Bachelor’s· Master’s· Doctorate 8. Female doctoral graduates,
9. Other doctoral graduates
Step 1: Separate the population into strata...
Step 2: Decide on the sample size for each stratum
First, you need to decide whether you want your sample to be proportionate or disproportionate.
Proportionate versus disproportionate sampling
In proportionate sampling, the sample size of each stratum is equal to the subgroup’s proportion in the population as a whole.
Subgroups that are less represented in the greater population (for example, rural populations, which make up a lower portion of the
population in most countries) will also be less represented in the sample.
In disproportionate sampling, the sample sizes of each stratum are disproportionate to their representation in the population as a whole.
Sample size
Next, you can decide on your total sample size. This should be large enough to ensure you can draw statistical conclusions about each
subgroup.
If you know your desired margin of error and confidence level as well as estimated size and standard deviation of the population you are
working with, you can use a sample size calculator to estimate the necessary numbers.
Example: Because you need to ensure your sample size of doctoral graduates is large enough, you decide to use disproportionate
sampling.
Even though doctoral students make up a small proportion of the overall student population, your sample is about ⅓ bachelor’s
graduates, ⅓ master’s graduates, and ⅓ doctoral graduates.
Step 3: Randomly sample from each stratum
Finally, you should use another probability sampling method, such as simple random or systematic sampling, to sample from within each
stratum.
If properly done, the randomization inherent in such methods will allow you to obtain a sample that is representative of that particular
subgroup.
Example: Random sampling You use simple random sampling to choose subjects from within each of your nine groups, selecting a
roughly equal sample size from each one.
You can then collect data on salaries and job histories from each of the members of your sample to investigate your question.
In a stratified sampling method, the total population is divided into smaller groups to complete the sampling process. The small group is
formed based on a few characteristics in the population. After separating the population into a smaller group, the statisticians randomly
select the sample.
Stratified sampling involves dividing the population into homogenous groups, each group containing subjects with similar characteristics.
For example, group A might contain males and group B, females. In order to obtain a sample representative of the whole population in
terms of sex, a random selection of subjects from group Aand group B must be taken. If needed, the exact proportion of males to females
in the whole population can be reflected in the sample. The researcher will have to identify those characteristics of the wider population
which must be included in the sample, i.e. to identify the parameters of the wider population. This is the essence of establishing the
sampling frame.
Step 3: Randomly sample from each stratum
A stratified random sample is, therefore, a useful blend of randomization and categorization, thereby enabling both a quantitative and
qualitative piece of research to be undertaken. A quantitative piece of research will be able to use analytical and inferential statistics,
while a qualitative piece of research will be able to target those groups in institutions or clusters of participants who will be able to be
approached to participate in the research.
Choosing characteristics for stratification
You must also choose the characteristic that you will use to divide your groups. This choice is very important: since each member of the
population can only be placed in only one subgroup, the classification of each subject to each subgroup should be clear and obvious.
Clustered Sampling
In the clustered sampling method, the cluster or group of people are formed from the population set. The group has similar significant
characteristics. Also, they have an equal chance of being a part of the sample. This method uses simple random sampling for the cluster
of population.
Example:
An educational institution has ten branches across the country with almost the number of students. If we want to collect some data
regarding facilities and other things, we can’t travel to every unit to collect the required data. Hence, we can use random sampling to
select three or four branches as clusters.
Consider a scenario where an organization is looking to survey the performance of smartphones across Germany. They can divide the
entire country’s population into cities (clusters), select further towns with the highest population, and filter those using mobile devices.
1. Sample: Decide the target audience and also the sample size.
2. Create and evaluate sampling frames: Create a sampling frame by using either an existing framework or creating a new one for the
target audience.
3. Determine groups: Determine the number of groups by including the same average members in each group. So make sure each of
these groups is distinct from one another.
Clustered Sampling...
1. Select clusters: Choose clusters by applying a random selection.
All these four methods can be understood in a better manner with the help of the figure given below. The figure contains various
examples of how samples will be taken from the population using different techniques.
Convenience Sampling
In a convenience sampling method, the samples are selected from the population directly because
they are conveniently available for the researcher. The samples are easy to select, and the
researcher did not choose the sample that outlines the entire population.
Non-Probability Sampling Types
1.
Example
In researching customer support services in a particular region, we ask your few customers to complete a
survey on the products after the purchase. This is a convenient way to collect data. Still, as we only
surveyed customers taking the same product. At the same time, the sample is not representative of all the
customers in that area
Non-probability Sampling methods are further classified into different types, such as convenience sampling, consecutive sampling,
quota sampling, judgmental sampling, snowball sampling.
Consecutive Sampling
In Consecutive sampling is similar to convenience sampling with a slight variation. The researcher
picks a single person or a group of people for sampling. Then the researcher researches for a
period of time to analyze the result and move to another group if needed.
Non-Probability Sampling Types...
2
Quota Sampling
In researching customer support services in a particular region, we ask your few customers to complete a
survey on the products after the purchase. This is a convenient way to collect data. Still, as we only
surveyed customers taking the same product. At the same time, the sample is not representative of all the
customers in that area.
Purposive or Judgmental Sampling
In purposive sampling, the samples are selected only based on the researcher’s knowledge. As their
knowledge is instrumental/influential in creating the samples, there are the chances of obtaining highly
accurate answers with a minimum marginal error. It is also known as judgmental sampling or authoritative
sampling.
3
Snowball sampling is also known as a chain-
referral sampling technique. In this method, the
samples have traits that are difficult to find. So,
each identified member of a population is
asked to find the other sampling units. Those
sampling units also belong to the same targeted
population.Probability Sampling Methods
Non-probability Sampling Methods
Probability Sampling is a sampling technique
in which samples taken from a larger
population are chosen based on probability
theory.
Non-probability sampling method is a
technique in which the researcher chooses
samples based on subjective judgment,
preferably non- random selection.
These are also known as Random sampling
methods.
These are also called non-random sampling
methods.
Snowball Sampling
Non-Probability Sampling Types...
4
These are used for research which is
conclusive/decisive/quantitative
These are used for research which is exploratory/qualitative
These involve a long time to get the
data.
These are easy ways to collect the data quickly.
There is an underlying hypothesis in
probability sampling before the study
starts. Also, the objective of this
method is to validate the defined
hypothesis.
The hypothesis is derived later by conducting the research study in
the case of non-probability sampling.
Snowball Sampling
Non-Probability Sampling Types...
4
THANK YOU!
Contact us:
hafeezkausar.hashmi@gmail.com
https://www.facebook.com/kausar0791
https://www.linkedin.com/in/dr-hafiz-kosar-284484186/
+92-314-3205571

More Related Content

Similar to Population and Sampling Techniques.pptx

non-probabilitysampling-141009034725-conversion-gate01.pdf
non-probabilitysampling-141009034725-conversion-gate01.pdfnon-probabilitysampling-141009034725-conversion-gate01.pdf
non-probabilitysampling-141009034725-conversion-gate01.pdf
MaggelAnclote2
 
Probability sampling techniques
Probability sampling techniquesProbability sampling techniques
Probability sampling techniquesMark Santos
 
Non probability sampling
Non probability samplingNon probability sampling
Non probability sampling
safwanthayath
 
Sampling and instrumentation
Sampling and instrumentationSampling and instrumentation
Sampling and instrumentationshree.vivek
 
Collecting Quantitative Datafinished
Collecting Quantitative DatafinishedCollecting Quantitative Datafinished
Collecting Quantitative Datafinishedzainab85
 
Sample Methods.pptx
Sample Methods.pptxSample Methods.pptx
Sample Methods.pptx
MaxamedSheekhAmiin
 
RESEARCH COURSE WORK Makerere University.pptx
RESEARCH COURSE WORK Makerere University.pptxRESEARCH COURSE WORK Makerere University.pptx
RESEARCH COURSE WORK Makerere University.pptx
YIKIISAAC
 
Research
Research Research
Research
Simson Toppo
 
Educational Resarch I, II Bimestre
Educational Resarch I,  II BimestreEducational Resarch I,  II Bimestre
Educational Resarch I, II Bimestre
Videoconferencias UTPL
 
Sampling & Its Types
Sampling & Its TypesSampling & Its Types
Sampling and its types of Biostatistics.
Sampling and its types of Biostatistics.Sampling and its types of Biostatistics.
Sampling and its types of Biostatistics.
AabidMir10
 
sampling techniques in business research methods
sampling techniques in business research methodssampling techniques in business research methods
sampling techniques in business research methods
ziyauddinkhan90
 
RESEARCH-DESIGN on lichen diversity.pptx
RESEARCH-DESIGN on lichen diversity.pptxRESEARCH-DESIGN on lichen diversity.pptx
RESEARCH-DESIGN on lichen diversity.pptx
immunedarksempai0
 
RM - Lecture Eleven of transportation.pptx
RM - Lecture Eleven of transportation.pptxRM - Lecture Eleven of transportation.pptx
RM - Lecture Eleven of transportation.pptx
bombvoyage
 
Sampling techniques Psychology
Sampling techniques PsychologySampling techniques Psychology
Sampling techniques Psychology
nelson elias
 
Research techniques; samling and ethics elt
Research techniques; samling and ethics eltResearch techniques; samling and ethics elt
Research techniques; samling and ethics elt
Abdo90nussair
 
SAMPLING METHODS in Research Methodology.pptx
SAMPLING METHODS in Research Methodology.pptxSAMPLING METHODS in Research Methodology.pptx
SAMPLING METHODS in Research Methodology.pptx
YIKIISAAC
 
RESEARCH METHOD - SAMPLING
RESEARCH METHOD - SAMPLINGRESEARCH METHOD - SAMPLING
RESEARCH METHOD - SAMPLING
Hafizah Hajimia
 
Qt
QtQt

Similar to Population and Sampling Techniques.pptx (20)

non-probabilitysampling-141009034725-conversion-gate01.pdf
non-probabilitysampling-141009034725-conversion-gate01.pdfnon-probabilitysampling-141009034725-conversion-gate01.pdf
non-probabilitysampling-141009034725-conversion-gate01.pdf
 
Probability sampling techniques
Probability sampling techniquesProbability sampling techniques
Probability sampling techniques
 
Non probability sampling
Non probability samplingNon probability sampling
Non probability sampling
 
Sampling and instrumentation
Sampling and instrumentationSampling and instrumentation
Sampling and instrumentation
 
Sampling
SamplingSampling
Sampling
 
Collecting Quantitative Datafinished
Collecting Quantitative DatafinishedCollecting Quantitative Datafinished
Collecting Quantitative Datafinished
 
Sample Methods.pptx
Sample Methods.pptxSample Methods.pptx
Sample Methods.pptx
 
RESEARCH COURSE WORK Makerere University.pptx
RESEARCH COURSE WORK Makerere University.pptxRESEARCH COURSE WORK Makerere University.pptx
RESEARCH COURSE WORK Makerere University.pptx
 
Research
Research Research
Research
 
Educational Resarch I, II Bimestre
Educational Resarch I,  II BimestreEducational Resarch I,  II Bimestre
Educational Resarch I, II Bimestre
 
Sampling & Its Types
Sampling & Its TypesSampling & Its Types
Sampling & Its Types
 
Sampling and its types of Biostatistics.
Sampling and its types of Biostatistics.Sampling and its types of Biostatistics.
Sampling and its types of Biostatistics.
 
sampling techniques in business research methods
sampling techniques in business research methodssampling techniques in business research methods
sampling techniques in business research methods
 
RESEARCH-DESIGN on lichen diversity.pptx
RESEARCH-DESIGN on lichen diversity.pptxRESEARCH-DESIGN on lichen diversity.pptx
RESEARCH-DESIGN on lichen diversity.pptx
 
RM - Lecture Eleven of transportation.pptx
RM - Lecture Eleven of transportation.pptxRM - Lecture Eleven of transportation.pptx
RM - Lecture Eleven of transportation.pptx
 
Sampling techniques Psychology
Sampling techniques PsychologySampling techniques Psychology
Sampling techniques Psychology
 
Research techniques; samling and ethics elt
Research techniques; samling and ethics eltResearch techniques; samling and ethics elt
Research techniques; samling and ethics elt
 
SAMPLING METHODS in Research Methodology.pptx
SAMPLING METHODS in Research Methodology.pptxSAMPLING METHODS in Research Methodology.pptx
SAMPLING METHODS in Research Methodology.pptx
 
RESEARCH METHOD - SAMPLING
RESEARCH METHOD - SAMPLINGRESEARCH METHOD - SAMPLING
RESEARCH METHOD - SAMPLING
 
Qt
QtQt
Qt
 

More from DrHafizKosar

Pakistan and Global Standards of Education.pptx
Pakistan and Global Standards of Education.pptxPakistan and Global Standards of Education.pptx
Pakistan and Global Standards of Education.pptx
DrHafizKosar
 
Concept of Development.pptx
Concept of Development.pptxConcept of Development.pptx
Concept of Development.pptx
DrHafizKosar
 
Writing Styles for Educational Materials.pptx
Writing Styles for Educational Materials.pptxWriting Styles for Educational Materials.pptx
Writing Styles for Educational Materials.pptx
DrHafizKosar
 
First Educational Conference of Pakistan (1947).pptx
First Educational Conference of Pakistan (1947).pptxFirst Educational Conference of Pakistan (1947).pptx
First Educational Conference of Pakistan (1947).pptx
DrHafizKosar
 
Adapting Language for Different Age Groups and Cultural Contexts.pptx
Adapting Language for Different Age Groups and Cultural Contexts.pptxAdapting Language for Different Age Groups and Cultural Contexts.pptx
Adapting Language for Different Age Groups and Cultural Contexts.pptx
DrHafizKosar
 
Global Education and Development Process.pptx
Global Education and Development Process.pptxGlobal Education and Development Process.pptx
Global Education and Development Process.pptx
DrHafizKosar
 
NATIONAL PARKS AND PROJECTS OF ENVIRONMENTAL PROTECTION.pptx
NATIONAL PARKS AND PROJECTS OF ENVIRONMENTAL PROTECTION.pptxNATIONAL PARKS AND PROJECTS OF ENVIRONMENTAL PROTECTION.pptx
NATIONAL PARKS AND PROJECTS OF ENVIRONMENTAL PROTECTION.pptx
DrHafizKosar
 
Different Spheres of Tthe Earth.pptx
Different Spheres of Tthe Earth.pptxDifferent Spheres of Tthe Earth.pptx
Different Spheres of Tthe Earth.pptx
DrHafizKosar
 
Assessment of Future Needs, Costing the Future Needs.pptx
Assessment of Future Needs, Costing the Future Needs.pptxAssessment of Future Needs, Costing the Future Needs.pptx
Assessment of Future Needs, Costing the Future Needs.pptx
DrHafizKosar
 
Content Organization and Sequencing.pptx
Content Organization and Sequencing.pptxContent Organization and Sequencing.pptx
Content Organization and Sequencing.pptx
DrHafizKosar
 
Climate Biodiversity and Ecosystem.pptx
Climate Biodiversity and Ecosystem.pptxClimate Biodiversity and Ecosystem.pptx
Climate Biodiversity and Ecosystem.pptx
DrHafizKosar
 
Jean Piaget’s Theory of Learning Process.pptx
Jean Piaget’s Theory of Learning Process.pptxJean Piaget’s Theory of Learning Process.pptx
Jean Piaget’s Theory of Learning Process.pptx
DrHafizKosar
 
Achored Instruction.pptx
Achored Instruction.pptxAchored Instruction.pptx
Achored Instruction.pptx
DrHafizKosar
 
Extrapolation & Interpolation.pptx
Extrapolation & Interpolation.pptxExtrapolation & Interpolation.pptx
Extrapolation & Interpolation.pptx
DrHafizKosar
 
Rates & Ratios.pptx
Rates & Ratios.pptxRates & Ratios.pptx
Rates & Ratios.pptx
DrHafizKosar
 
Index Number.pptx
Index Number.pptxIndex Number.pptx
Index Number.pptx
DrHafizKosar
 
Writing Learning Material and Textbook Level PhD (1).pptx
Writing Learning Material and Textbook Level PhD (1).pptxWriting Learning Material and Textbook Level PhD (1).pptx
Writing Learning Material and Textbook Level PhD (1).pptx
DrHafizKosar
 
Preparation for Policy Formulation, Data on Educational Personnel_20231223_11...
Preparation for Policy Formulation, Data on Educational Personnel_20231223_11...Preparation for Policy Formulation, Data on Educational Personnel_20231223_11...
Preparation for Policy Formulation, Data on Educational Personnel_20231223_11...
DrHafizKosar
 
Action Verbs to write research objectives.pptx
Action Verbs to write research objectives.pptxAction Verbs to write research objectives.pptx
Action Verbs to write research objectives.pptx
DrHafizKosar
 
Identifying learning outcomes and objectives.pptx
Identifying learning outcomes and objectives.pptxIdentifying learning outcomes and objectives.pptx
Identifying learning outcomes and objectives.pptx
DrHafizKosar
 

More from DrHafizKosar (20)

Pakistan and Global Standards of Education.pptx
Pakistan and Global Standards of Education.pptxPakistan and Global Standards of Education.pptx
Pakistan and Global Standards of Education.pptx
 
Concept of Development.pptx
Concept of Development.pptxConcept of Development.pptx
Concept of Development.pptx
 
Writing Styles for Educational Materials.pptx
Writing Styles for Educational Materials.pptxWriting Styles for Educational Materials.pptx
Writing Styles for Educational Materials.pptx
 
First Educational Conference of Pakistan (1947).pptx
First Educational Conference of Pakistan (1947).pptxFirst Educational Conference of Pakistan (1947).pptx
First Educational Conference of Pakistan (1947).pptx
 
Adapting Language for Different Age Groups and Cultural Contexts.pptx
Adapting Language for Different Age Groups and Cultural Contexts.pptxAdapting Language for Different Age Groups and Cultural Contexts.pptx
Adapting Language for Different Age Groups and Cultural Contexts.pptx
 
Global Education and Development Process.pptx
Global Education and Development Process.pptxGlobal Education and Development Process.pptx
Global Education and Development Process.pptx
 
NATIONAL PARKS AND PROJECTS OF ENVIRONMENTAL PROTECTION.pptx
NATIONAL PARKS AND PROJECTS OF ENVIRONMENTAL PROTECTION.pptxNATIONAL PARKS AND PROJECTS OF ENVIRONMENTAL PROTECTION.pptx
NATIONAL PARKS AND PROJECTS OF ENVIRONMENTAL PROTECTION.pptx
 
Different Spheres of Tthe Earth.pptx
Different Spheres of Tthe Earth.pptxDifferent Spheres of Tthe Earth.pptx
Different Spheres of Tthe Earth.pptx
 
Assessment of Future Needs, Costing the Future Needs.pptx
Assessment of Future Needs, Costing the Future Needs.pptxAssessment of Future Needs, Costing the Future Needs.pptx
Assessment of Future Needs, Costing the Future Needs.pptx
 
Content Organization and Sequencing.pptx
Content Organization and Sequencing.pptxContent Organization and Sequencing.pptx
Content Organization and Sequencing.pptx
 
Climate Biodiversity and Ecosystem.pptx
Climate Biodiversity and Ecosystem.pptxClimate Biodiversity and Ecosystem.pptx
Climate Biodiversity and Ecosystem.pptx
 
Jean Piaget’s Theory of Learning Process.pptx
Jean Piaget’s Theory of Learning Process.pptxJean Piaget’s Theory of Learning Process.pptx
Jean Piaget’s Theory of Learning Process.pptx
 
Achored Instruction.pptx
Achored Instruction.pptxAchored Instruction.pptx
Achored Instruction.pptx
 
Extrapolation & Interpolation.pptx
Extrapolation & Interpolation.pptxExtrapolation & Interpolation.pptx
Extrapolation & Interpolation.pptx
 
Rates & Ratios.pptx
Rates & Ratios.pptxRates & Ratios.pptx
Rates & Ratios.pptx
 
Index Number.pptx
Index Number.pptxIndex Number.pptx
Index Number.pptx
 
Writing Learning Material and Textbook Level PhD (1).pptx
Writing Learning Material and Textbook Level PhD (1).pptxWriting Learning Material and Textbook Level PhD (1).pptx
Writing Learning Material and Textbook Level PhD (1).pptx
 
Preparation for Policy Formulation, Data on Educational Personnel_20231223_11...
Preparation for Policy Formulation, Data on Educational Personnel_20231223_11...Preparation for Policy Formulation, Data on Educational Personnel_20231223_11...
Preparation for Policy Formulation, Data on Educational Personnel_20231223_11...
 
Action Verbs to write research objectives.pptx
Action Verbs to write research objectives.pptxAction Verbs to write research objectives.pptx
Action Verbs to write research objectives.pptx
 
Identifying learning outcomes and objectives.pptx
Identifying learning outcomes and objectives.pptxIdentifying learning outcomes and objectives.pptx
Identifying learning outcomes and objectives.pptx
 

Recently uploaded

The geography of Taylor Swift - some ideas
The geography of Taylor Swift - some ideasThe geography of Taylor Swift - some ideas
The geography of Taylor Swift - some ideas
GeoBlogs
 
TESDA TM1 REVIEWER FOR NATIONAL ASSESSMENT WRITTEN AND ORAL QUESTIONS WITH A...
TESDA TM1 REVIEWER  FOR NATIONAL ASSESSMENT WRITTEN AND ORAL QUESTIONS WITH A...TESDA TM1 REVIEWER  FOR NATIONAL ASSESSMENT WRITTEN AND ORAL QUESTIONS WITH A...
TESDA TM1 REVIEWER FOR NATIONAL ASSESSMENT WRITTEN AND ORAL QUESTIONS WITH A...
EugeneSaldivar
 
2024.06.01 Introducing a competency framework for languag learning materials ...
2024.06.01 Introducing a competency framework for languag learning materials ...2024.06.01 Introducing a competency framework for languag learning materials ...
2024.06.01 Introducing a competency framework for languag learning materials ...
Sandy Millin
 
Additional Benefits for Employee Website.pdf
Additional Benefits for Employee Website.pdfAdditional Benefits for Employee Website.pdf
Additional Benefits for Employee Website.pdf
joachimlavalley1
 
How to Break the cycle of negative Thoughts
How to Break the cycle of negative ThoughtsHow to Break the cycle of negative Thoughts
How to Break the cycle of negative Thoughts
Col Mukteshwar Prasad
 
CLASS 11 CBSE B.St Project AIDS TO TRADE - INSURANCE
CLASS 11 CBSE B.St Project AIDS TO TRADE - INSURANCECLASS 11 CBSE B.St Project AIDS TO TRADE - INSURANCE
CLASS 11 CBSE B.St Project AIDS TO TRADE - INSURANCE
BhavyaRajput3
 
PART A. Introduction to Costumer Service
PART A. Introduction to Costumer ServicePART A. Introduction to Costumer Service
PART A. Introduction to Costumer Service
PedroFerreira53928
 
Instructions for Submissions thorugh G- Classroom.pptx
Instructions for Submissions thorugh G- Classroom.pptxInstructions for Submissions thorugh G- Classroom.pptx
Instructions for Submissions thorugh G- Classroom.pptx
Jheel Barad
 
Chapter 3 - Islamic Banking Products and Services.pptx
Chapter 3 - Islamic Banking Products and Services.pptxChapter 3 - Islamic Banking Products and Services.pptx
Chapter 3 - Islamic Banking Products and Services.pptx
Mohd Adib Abd Muin, Senior Lecturer at Universiti Utara Malaysia
 
How to Create Map Views in the Odoo 17 ERP
How to Create Map Views in the Odoo 17 ERPHow to Create Map Views in the Odoo 17 ERP
How to Create Map Views in the Odoo 17 ERP
Celine George
 
Sectors of the Indian Economy - Class 10 Study Notes pdf
Sectors of the Indian Economy - Class 10 Study Notes pdfSectors of the Indian Economy - Class 10 Study Notes pdf
Sectors of the Indian Economy - Class 10 Study Notes pdf
Vivekanand Anglo Vedic Academy
 
Supporting (UKRI) OA monographs at Salford.pptx
Supporting (UKRI) OA monographs at Salford.pptxSupporting (UKRI) OA monographs at Salford.pptx
Supporting (UKRI) OA monographs at Salford.pptx
Jisc
 
The French Revolution Class 9 Study Material pdf free download
The French Revolution Class 9 Study Material pdf free downloadThe French Revolution Class 9 Study Material pdf free download
The French Revolution Class 9 Study Material pdf free download
Vivekanand Anglo Vedic Academy
 
Phrasal Verbs.XXXXXXXXXXXXXXXXXXXXXXXXXX
Phrasal Verbs.XXXXXXXXXXXXXXXXXXXXXXXXXXPhrasal Verbs.XXXXXXXXXXXXXXXXXXXXXXXXXX
Phrasal Verbs.XXXXXXXXXXXXXXXXXXXXXXXXXX
MIRIAMSALINAS13
 
Language Across the Curriculm LAC B.Ed.
Language Across the  Curriculm LAC B.Ed.Language Across the  Curriculm LAC B.Ed.
Language Across the Curriculm LAC B.Ed.
Atul Kumar Singh
 
ESC Beyond Borders _From EU to You_ InfoPack general.pdf
ESC Beyond Borders _From EU to You_ InfoPack general.pdfESC Beyond Borders _From EU to You_ InfoPack general.pdf
ESC Beyond Borders _From EU to You_ InfoPack general.pdf
Fundacja Rozwoju Społeczeństwa Przedsiębiorczego
 
MARUTI SUZUKI- A Successful Joint Venture in India.pptx
MARUTI SUZUKI- A Successful Joint Venture in India.pptxMARUTI SUZUKI- A Successful Joint Venture in India.pptx
MARUTI SUZUKI- A Successful Joint Venture in India.pptx
bennyroshan06
 
Template Jadual Bertugas Kelas (Boleh Edit)
Template Jadual Bertugas Kelas (Boleh Edit)Template Jadual Bertugas Kelas (Boleh Edit)
Template Jadual Bertugas Kelas (Boleh Edit)
rosedainty
 
Home assignment II on Spectroscopy 2024 Answers.pdf
Home assignment II on Spectroscopy 2024 Answers.pdfHome assignment II on Spectroscopy 2024 Answers.pdf
Home assignment II on Spectroscopy 2024 Answers.pdf
Tamralipta Mahavidyalaya
 
aaaaaaaaaaaaaaaaaaaaaaaaaaaaaaaaaaaaaaaaa
aaaaaaaaaaaaaaaaaaaaaaaaaaaaaaaaaaaaaaaaaaaaaaaaaaaaaaaaaaaaaaaaaaaaaaaaaaaaaaaaaa
aaaaaaaaaaaaaaaaaaaaaaaaaaaaaaaaaaaaaaaaa
siemaillard
 

Recently uploaded (20)

The geography of Taylor Swift - some ideas
The geography of Taylor Swift - some ideasThe geography of Taylor Swift - some ideas
The geography of Taylor Swift - some ideas
 
TESDA TM1 REVIEWER FOR NATIONAL ASSESSMENT WRITTEN AND ORAL QUESTIONS WITH A...
TESDA TM1 REVIEWER  FOR NATIONAL ASSESSMENT WRITTEN AND ORAL QUESTIONS WITH A...TESDA TM1 REVIEWER  FOR NATIONAL ASSESSMENT WRITTEN AND ORAL QUESTIONS WITH A...
TESDA TM1 REVIEWER FOR NATIONAL ASSESSMENT WRITTEN AND ORAL QUESTIONS WITH A...
 
2024.06.01 Introducing a competency framework for languag learning materials ...
2024.06.01 Introducing a competency framework for languag learning materials ...2024.06.01 Introducing a competency framework for languag learning materials ...
2024.06.01 Introducing a competency framework for languag learning materials ...
 
Additional Benefits for Employee Website.pdf
Additional Benefits for Employee Website.pdfAdditional Benefits for Employee Website.pdf
Additional Benefits for Employee Website.pdf
 
How to Break the cycle of negative Thoughts
How to Break the cycle of negative ThoughtsHow to Break the cycle of negative Thoughts
How to Break the cycle of negative Thoughts
 
CLASS 11 CBSE B.St Project AIDS TO TRADE - INSURANCE
CLASS 11 CBSE B.St Project AIDS TO TRADE - INSURANCECLASS 11 CBSE B.St Project AIDS TO TRADE - INSURANCE
CLASS 11 CBSE B.St Project AIDS TO TRADE - INSURANCE
 
PART A. Introduction to Costumer Service
PART A. Introduction to Costumer ServicePART A. Introduction to Costumer Service
PART A. Introduction to Costumer Service
 
Instructions for Submissions thorugh G- Classroom.pptx
Instructions for Submissions thorugh G- Classroom.pptxInstructions for Submissions thorugh G- Classroom.pptx
Instructions for Submissions thorugh G- Classroom.pptx
 
Chapter 3 - Islamic Banking Products and Services.pptx
Chapter 3 - Islamic Banking Products and Services.pptxChapter 3 - Islamic Banking Products and Services.pptx
Chapter 3 - Islamic Banking Products and Services.pptx
 
How to Create Map Views in the Odoo 17 ERP
How to Create Map Views in the Odoo 17 ERPHow to Create Map Views in the Odoo 17 ERP
How to Create Map Views in the Odoo 17 ERP
 
Sectors of the Indian Economy - Class 10 Study Notes pdf
Sectors of the Indian Economy - Class 10 Study Notes pdfSectors of the Indian Economy - Class 10 Study Notes pdf
Sectors of the Indian Economy - Class 10 Study Notes pdf
 
Supporting (UKRI) OA monographs at Salford.pptx
Supporting (UKRI) OA monographs at Salford.pptxSupporting (UKRI) OA monographs at Salford.pptx
Supporting (UKRI) OA monographs at Salford.pptx
 
The French Revolution Class 9 Study Material pdf free download
The French Revolution Class 9 Study Material pdf free downloadThe French Revolution Class 9 Study Material pdf free download
The French Revolution Class 9 Study Material pdf free download
 
Phrasal Verbs.XXXXXXXXXXXXXXXXXXXXXXXXXX
Phrasal Verbs.XXXXXXXXXXXXXXXXXXXXXXXXXXPhrasal Verbs.XXXXXXXXXXXXXXXXXXXXXXXXXX
Phrasal Verbs.XXXXXXXXXXXXXXXXXXXXXXXXXX
 
Language Across the Curriculm LAC B.Ed.
Language Across the  Curriculm LAC B.Ed.Language Across the  Curriculm LAC B.Ed.
Language Across the Curriculm LAC B.Ed.
 
ESC Beyond Borders _From EU to You_ InfoPack general.pdf
ESC Beyond Borders _From EU to You_ InfoPack general.pdfESC Beyond Borders _From EU to You_ InfoPack general.pdf
ESC Beyond Borders _From EU to You_ InfoPack general.pdf
 
MARUTI SUZUKI- A Successful Joint Venture in India.pptx
MARUTI SUZUKI- A Successful Joint Venture in India.pptxMARUTI SUZUKI- A Successful Joint Venture in India.pptx
MARUTI SUZUKI- A Successful Joint Venture in India.pptx
 
Template Jadual Bertugas Kelas (Boleh Edit)
Template Jadual Bertugas Kelas (Boleh Edit)Template Jadual Bertugas Kelas (Boleh Edit)
Template Jadual Bertugas Kelas (Boleh Edit)
 
Home assignment II on Spectroscopy 2024 Answers.pdf
Home assignment II on Spectroscopy 2024 Answers.pdfHome assignment II on Spectroscopy 2024 Answers.pdf
Home assignment II on Spectroscopy 2024 Answers.pdf
 
aaaaaaaaaaaaaaaaaaaaaaaaaaaaaaaaaaaaaaaaa
aaaaaaaaaaaaaaaaaaaaaaaaaaaaaaaaaaaaaaaaaaaaaaaaaaaaaaaaaaaaaaaaaaaaaaaaaaaaaaaaaa
aaaaaaaaaaaaaaaaaaaaaaaaaaaaaaaaaaaaaaaaa
 

Population and Sampling Techniques.pptx

  • 2. RESEARCH METHODOLOGY 01 03 04 Population Sampling Techniques Sample Sample Size 02
  • 3. The first step in the process of collecting quantitative data is to identify the people and places you plan to study. This involves determining whether you will study individuals or entire organizations (e.g., schools) or some combination. If you select either individuals or organizations, you need to decide what type of people or organizations you will actually study and how many you will need for your research. These decisions require that you decide on a unit of analysis, the group and individuals you will study, the procedure for selecting these individuals, and assessing the numbers of people needed for your data analysis.
  • 4. Who can supply the information that you will use to answer your quantitative research questions or hypotheses? Some possibilities might be students, teachers, parents, adults, some combination of these individuals, or entire schools.At this early stage in data collection, you must decide at what level (e.g., individual, family, school, school district) the data needs to be gathered. This level is referred to as the unit of analysis. In some research studies, educators gather data from multiple levels (e.g., individuals and schools), whereas other studies involve collecting data from only one level (e.g., principals in schools). This decision depends on the questions or hypotheses that you seek to answer.Also, the data for measuring the independent variable may differ from the unit for assessing the dependent variable. For example, in the study of the impact of adolescent aggression on school climate, a researcher would measure the independent variable, adolescent aggression, by collecting data from individuals while measuring the dependent variable, school climate, based on data from entire schools and their overall climates (e.g., whether students and teachers believe the school curriculum supports learning). If Faiza wants to answer the question “Why do students carry weapons in high school?” what unit of analysis will she study?Alternatively, if she wanted to compare answers to the question “Why do students carry weapons in rural high schools and urban high schools?” what two types of units of analysis will she study? Identify Your Unit of Analysis
  • 5. If you select an entire school to study or a small number of individuals, you need to consider what individuals or schools you will study. In some educational situations, you will select individuals for your research based on who volunteers to participate or who is available (e.g., a specific classroom of students). However, those individuals may not be similar (in personal characteristics or performance or attitudes) to all individuals who could be studied. A more advanced research process is to select individuals or schools who are representative of the entire group of individuals or schools. Representative refers to the selection of individuals from a sample of a population such that the individuals selected are typical of the population under study, enabling you to draw conclusions from the sample about the population as a whole. This definition is loaded with terms, and we will sort them so that you can see alternative procedures for deciding what individuals or organizations to study. “Apopulation is a group of individuals who have the same characteristic.” For example, all teachers would make up the population of teachers, and all high school administrators in a school district would comprise the population of administrators. As these examples illustrate, populations can be small or large. You need to decide what group you would like to study. In practice, quantitative researchers’sample from lists and people available. A target population (or the sampling frame) is a group of individuals (or a group of organizations) with some common defining characteristic that the researcher can identify and study. Within this target population, researchers then select a sample for study. Specify the Population and Sample
  • 6. Sample: A sample is a subgroup of the target population that the researcher plans to study for generalizing about the target population. In an ideal situation, you can select a sample of individuals who are representative of the entire population. For instance, as shown in Figure 5.1, you might select a sample of high school teachers (the sample) from the population of all teachers in high schools in one city (the population). Alternatively, you might be able to study only biology teachers in two schools in the city. The first scenario represents rigorous, systematic sampling called probability sampling and the second, unsystematic nonprobability sampling.
  • 7. Probability Sampling In Statistics, there are different sampling techniques available to get relevant results from the population. The two different types of sampling methods are: Sampling Techniques Non-probability Sampling
  • 8. Probability Sampling Methods • Probability sampling means that every member of the population has a chance of being selected. It is mainly used in quantitative research. If you want to produce results that are representative of the whole population, probability sampling techniques are the most valid choice. • The probability sampling method utilizes some form of random selection. In this method, all the eligible individuals have a chance of selecting the sample from the whole sample space. This method is more time consuming and expensive than the non-probability sampling method. The benefit of using probability sampling is that it guarantees the sample that should be the representative of the population.
  • 9. Non-Probability Sampling Method In a non-probability sample, individuals are selected based on non-random criteria, and not every individual has a chance of being included. The non-probability sampling method is a technique in which the researcher selects the sample based on subjective judgment rather than the random selection. In this method, not all the members of the population have a chance to participate in the study. • This type of sample is easier and cheaper to access, but it has a higher risk of sampling bias. That means the inferences you can make about the population are weaker than with probability samples, and your conclusions may be more limited. If you use a non-probability sample, you should still aim to make it as representative of the population as possible. • Non-probability sampling techniques are often used in exploratory and qualitative research. In these types of research, the aim is not to test a hypothesis about a broad population, but to develop an initial understanding of a small or under-researched population.
  • 10.
  • 11. In simple random sampling technique, every item in the population has an equal and likely chance of being selected in the sample. Since the item selection entirely depends on the chance, this method is known as “Method of chance Selection”. As the sample size is large, and the item is chosen randomly, it is known as “Representative Sampling”. For larger populations, a manual lottery method can be quite time-consuming. Selecting a random sample from a large population usually requires a computer-generated process, by which the same methodology as the lottery method is used. Among the disadvantages of this technique are difficulty gaining access to respondents that can be drawn from the larger population, greater time, greater costs, and the fact that bias can still occur under certain circumstances formed by computers, not humans. Simple Random Sampling/Lottery Method Probability Sampling Types Probability Sampling methods are further classified into different types, such as simple random sampling, systematic sampling, stratified sampling, and clustered sampling. Example: An example of a simple random sample would be the names of 25 employees being chosen out of a hat from a company of 250 employees. In this case, the population is all 250 employees, and the sample is random because each employee has an equal chance of being chosen. Suppose we want to select a simple random sample of 200 students from a school. Here, we can assign a number to every student in the school database from 1 to 500 and use a random number generator to select a sample of 200 numbers.
  • 12. In the systematic sampling method, the items are selected from the target population by selecting the random selection point and selecting the other methods after a fixed sample interval. It is calculated by dividing the total population size by the desired population size. Systematic Sampling
  • 13. Example: Suppose the names of 300 students of a school are sorted in the reverse alphabetical order. To select a sample in a systematic sampling method, we have to choose some 15 students by randomly selecting a starting number, say 5. From number 5 onwards, will select every 15th person from the sorted list. Finally, we can end up with a sample of some students. Let us say that the researcher is working with a school of 1,400 students; by looking at the table of sample size required for a random sample of these 1,400 students we see that 302 students are required to be in the sample. Hence the frequency interval (f) is: 1, 400 302 = 4.635 (which rounds up to 5.0) Hence the researcher would pick out every fifth name on the list of cases. Alist of females and males might list all the females first, before listing all the males; if there were 200 females on the list, the researcher might have reached the desired sample size before reaching that stage of the list which contained males. Systematic Sampling...
  • 14. Systematic Sampling... Step one Develop a defined structural audience to start working on the sampling aspect. Step two: As a researcher, figure out the ideal size of the sample, i.e., how many people from the entire population to choose to be a part of the sample. Step four: Define the interval of this sample. This will be the standard distance between the elements. Step three: Once you decide the sample size, assign a number to every member of the sample. Here are the steps to form a systematic sample: For example, the sample interval should be 10, which is the result of the division of 5000 (N= size of the population) and 500 (n=size of the sample).
  • 15. Systematic Sampling... Step four... Systematic Sampling Formula for interval (i) = N/n = 5000/500 = 10 . Step six: Randomly choose the starting member (r) of the sample and add the interval to the random number to keep adding members in the sample. Step five: Select the members who fit the criteria which in this case will be 1 in 10 individuals
  • 16. When you are sampling, ensure you represent the population fairly. Systematic sampling is a symmetrical process where the researcher chooses the samples after a specifically defined interval. Sampling like this leaves the researcher no room for bias regarding choosing the sample. To understand how it exactly works, take the example of the gym class where the instructor asks the students to line up and asks every third person to step out of the line. Here, the instructor has no influence over choosing the samples and can accurately represent the class. Systematic sampling example For instance, if a local NGO is seeking to form a systematic sample of 500 volunteers from a population of 5000, they can select every 10th person in the population to build a sample systematically. Systematic Sampling Types Here are the types of systematic sampling: 1. Systematic random sampling 2. Linear systematic sampling 3. Circular systematic sampling How systematic sampling works
  • 17. Stratified Sampling In a stratified sample, researchers divide a population into homogeneous subpopulations called strata (the plural of stratum) based on specific characteristics (e.g., race, gender identity, location, etc.). Every member of the population studied should be in exactly one stratum. Each stratum is then sampled using another probability sampling method, such as cluster sampling or simple random sampling, allowing researchers to estimate statistical measures for each sub-population. Researchers rely on stratified sampling when a population’s characteristics are diverse and they want to ensure that every characteristic is properly represented in the sample. This helps with the generalizability and validity of the study, as well as avoiding research biases like under coverage bias.
  • 18. Step 1: Separate the population into strata Collect a list of every member of the population, and assign each member to a stratum. You must ensure that each stratum is mutually exclusive (there is no overlap/similarity between them), but that together, they contain the entire population. Example: Separating the population into strata. You compile a list of every graduate’s name, gender identity, and the degree that they obtained. Using this list, you stratify on two characteristics: gender identity, with three strata (male, female, and other), and degree, with three strata (bachelor’s, master’s, and doctorate). Combining these characteristics, you have nine groups in total. Each graduate must be assigned to exactly one group.
  • 19. Characteristic Strata Groups Gender Identity · Female· Male· Other 1. Male bachelor’s graduates, 2. Female bachelor’s graduates, 3. Other bachelor’s graduates 4. Male master’s graduates, 5. Female master’s graduates, 6. Other master’s graduates 7. Male doctoral graduates Degree · Bachelor’s· Master’s· Doctorate 8. Female doctoral graduates, 9. Other doctoral graduates Step 1: Separate the population into strata...
  • 20. Step 2: Decide on the sample size for each stratum First, you need to decide whether you want your sample to be proportionate or disproportionate. Proportionate versus disproportionate sampling In proportionate sampling, the sample size of each stratum is equal to the subgroup’s proportion in the population as a whole. Subgroups that are less represented in the greater population (for example, rural populations, which make up a lower portion of the population in most countries) will also be less represented in the sample. In disproportionate sampling, the sample sizes of each stratum are disproportionate to their representation in the population as a whole. Sample size Next, you can decide on your total sample size. This should be large enough to ensure you can draw statistical conclusions about each subgroup. If you know your desired margin of error and confidence level as well as estimated size and standard deviation of the population you are working with, you can use a sample size calculator to estimate the necessary numbers. Example: Because you need to ensure your sample size of doctoral graduates is large enough, you decide to use disproportionate sampling. Even though doctoral students make up a small proportion of the overall student population, your sample is about ⅓ bachelor’s graduates, ⅓ master’s graduates, and ⅓ doctoral graduates.
  • 21. Step 3: Randomly sample from each stratum Finally, you should use another probability sampling method, such as simple random or systematic sampling, to sample from within each stratum. If properly done, the randomization inherent in such methods will allow you to obtain a sample that is representative of that particular subgroup. Example: Random sampling You use simple random sampling to choose subjects from within each of your nine groups, selecting a roughly equal sample size from each one. You can then collect data on salaries and job histories from each of the members of your sample to investigate your question. In a stratified sampling method, the total population is divided into smaller groups to complete the sampling process. The small group is formed based on a few characteristics in the population. After separating the population into a smaller group, the statisticians randomly select the sample. Stratified sampling involves dividing the population into homogenous groups, each group containing subjects with similar characteristics. For example, group A might contain males and group B, females. In order to obtain a sample representative of the whole population in terms of sex, a random selection of subjects from group Aand group B must be taken. If needed, the exact proportion of males to females in the whole population can be reflected in the sample. The researcher will have to identify those characteristics of the wider population which must be included in the sample, i.e. to identify the parameters of the wider population. This is the essence of establishing the sampling frame.
  • 22. Step 3: Randomly sample from each stratum A stratified random sample is, therefore, a useful blend of randomization and categorization, thereby enabling both a quantitative and qualitative piece of research to be undertaken. A quantitative piece of research will be able to use analytical and inferential statistics, while a qualitative piece of research will be able to target those groups in institutions or clusters of participants who will be able to be approached to participate in the research. Choosing characteristics for stratification You must also choose the characteristic that you will use to divide your groups. This choice is very important: since each member of the population can only be placed in only one subgroup, the classification of each subject to each subgroup should be clear and obvious.
  • 23. Clustered Sampling In the clustered sampling method, the cluster or group of people are formed from the population set. The group has similar significant characteristics. Also, they have an equal chance of being a part of the sample. This method uses simple random sampling for the cluster of population. Example: An educational institution has ten branches across the country with almost the number of students. If we want to collect some data regarding facilities and other things, we can’t travel to every unit to collect the required data. Hence, we can use random sampling to select three or four branches as clusters. Consider a scenario where an organization is looking to survey the performance of smartphones across Germany. They can divide the entire country’s population into cities (clusters), select further towns with the highest population, and filter those using mobile devices. 1. Sample: Decide the target audience and also the sample size. 2. Create and evaluate sampling frames: Create a sampling frame by using either an existing framework or creating a new one for the target audience. 3. Determine groups: Determine the number of groups by including the same average members in each group. So make sure each of these groups is distinct from one another.
  • 24. Clustered Sampling... 1. Select clusters: Choose clusters by applying a random selection. All these four methods can be understood in a better manner with the help of the figure given below. The figure contains various examples of how samples will be taken from the population using different techniques.
  • 25.
  • 26. Convenience Sampling In a convenience sampling method, the samples are selected from the population directly because they are conveniently available for the researcher. The samples are easy to select, and the researcher did not choose the sample that outlines the entire population. Non-Probability Sampling Types 1. Example In researching customer support services in a particular region, we ask your few customers to complete a survey on the products after the purchase. This is a convenient way to collect data. Still, as we only surveyed customers taking the same product. At the same time, the sample is not representative of all the customers in that area Non-probability Sampling methods are further classified into different types, such as convenience sampling, consecutive sampling, quota sampling, judgmental sampling, snowball sampling.
  • 27. Consecutive Sampling In Consecutive sampling is similar to convenience sampling with a slight variation. The researcher picks a single person or a group of people for sampling. Then the researcher researches for a period of time to analyze the result and move to another group if needed. Non-Probability Sampling Types... 2 Quota Sampling In researching customer support services in a particular region, we ask your few customers to complete a survey on the products after the purchase. This is a convenient way to collect data. Still, as we only surveyed customers taking the same product. At the same time, the sample is not representative of all the customers in that area. Purposive or Judgmental Sampling In purposive sampling, the samples are selected only based on the researcher’s knowledge. As their knowledge is instrumental/influential in creating the samples, there are the chances of obtaining highly accurate answers with a minimum marginal error. It is also known as judgmental sampling or authoritative sampling. 3
  • 28. Snowball sampling is also known as a chain- referral sampling technique. In this method, the samples have traits that are difficult to find. So, each identified member of a population is asked to find the other sampling units. Those sampling units also belong to the same targeted population.Probability Sampling Methods Non-probability Sampling Methods Probability Sampling is a sampling technique in which samples taken from a larger population are chosen based on probability theory. Non-probability sampling method is a technique in which the researcher chooses samples based on subjective judgment, preferably non- random selection. These are also known as Random sampling methods. These are also called non-random sampling methods. Snowball Sampling Non-Probability Sampling Types... 4
  • 29. These are used for research which is conclusive/decisive/quantitative These are used for research which is exploratory/qualitative These involve a long time to get the data. These are easy ways to collect the data quickly. There is an underlying hypothesis in probability sampling before the study starts. Also, the objective of this method is to validate the defined hypothesis. The hypothesis is derived later by conducting the research study in the case of non-probability sampling. Snowball Sampling Non-Probability Sampling Types... 4