Downloaded 1,771 times
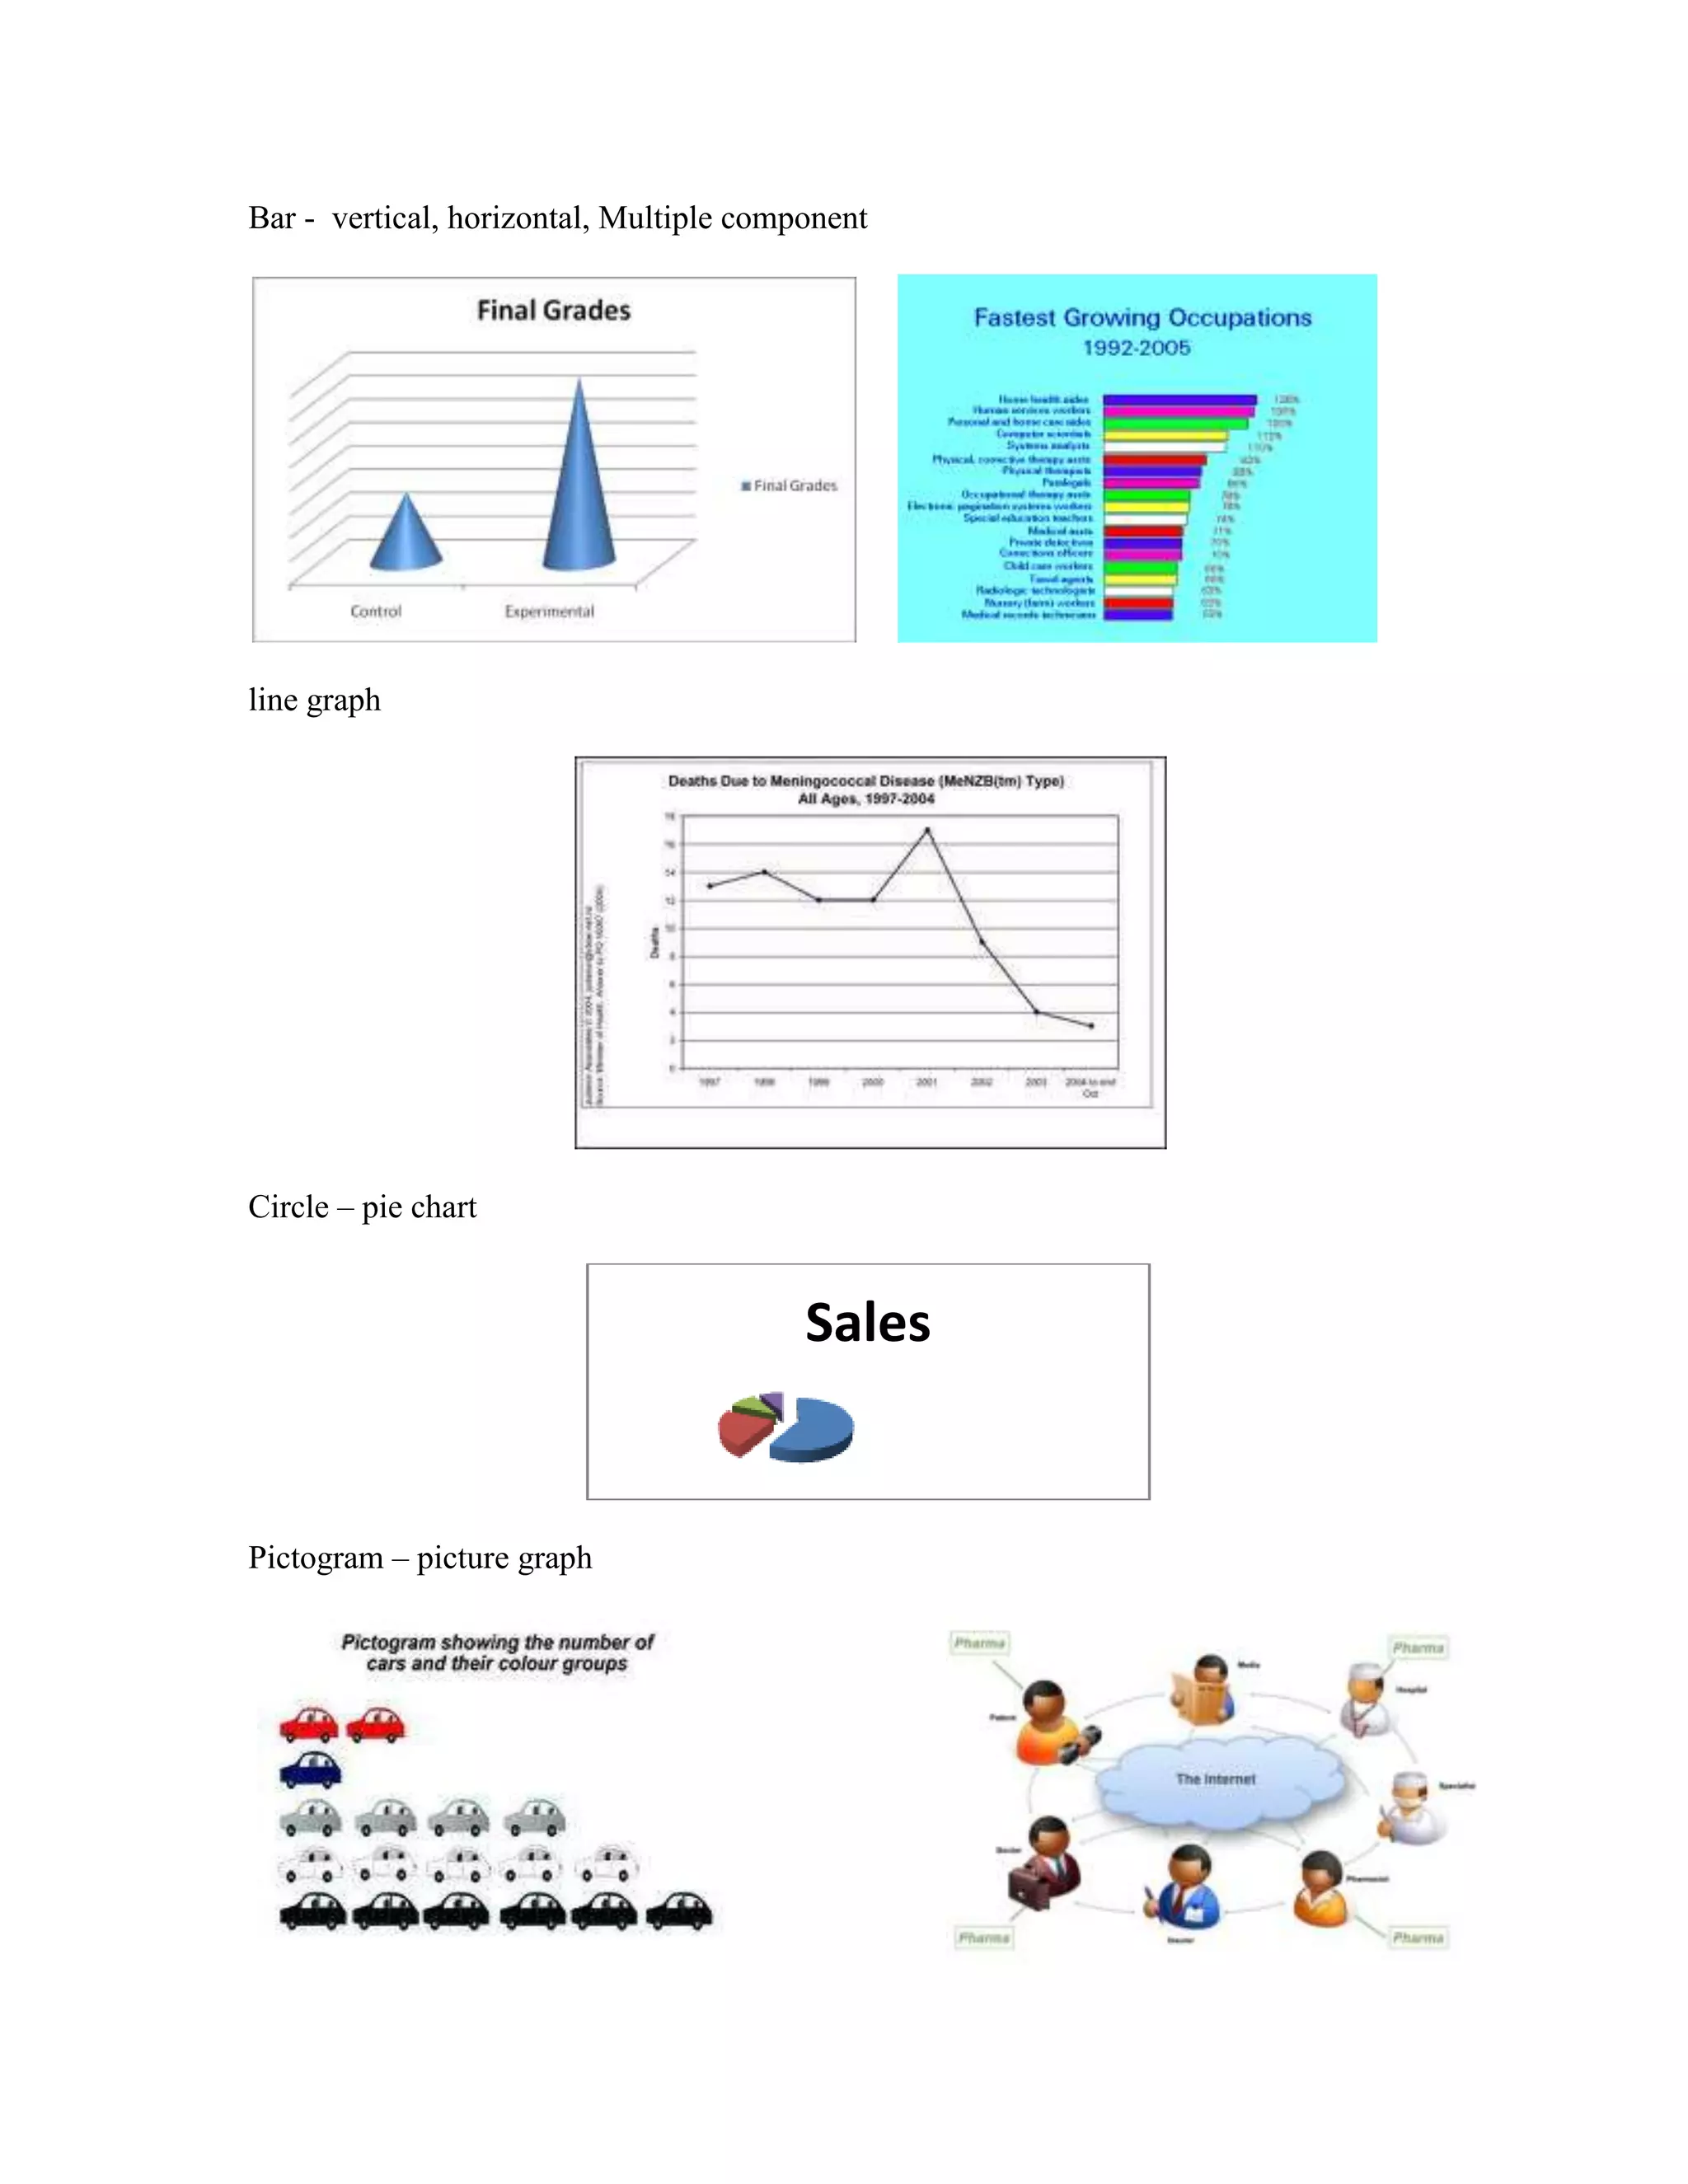
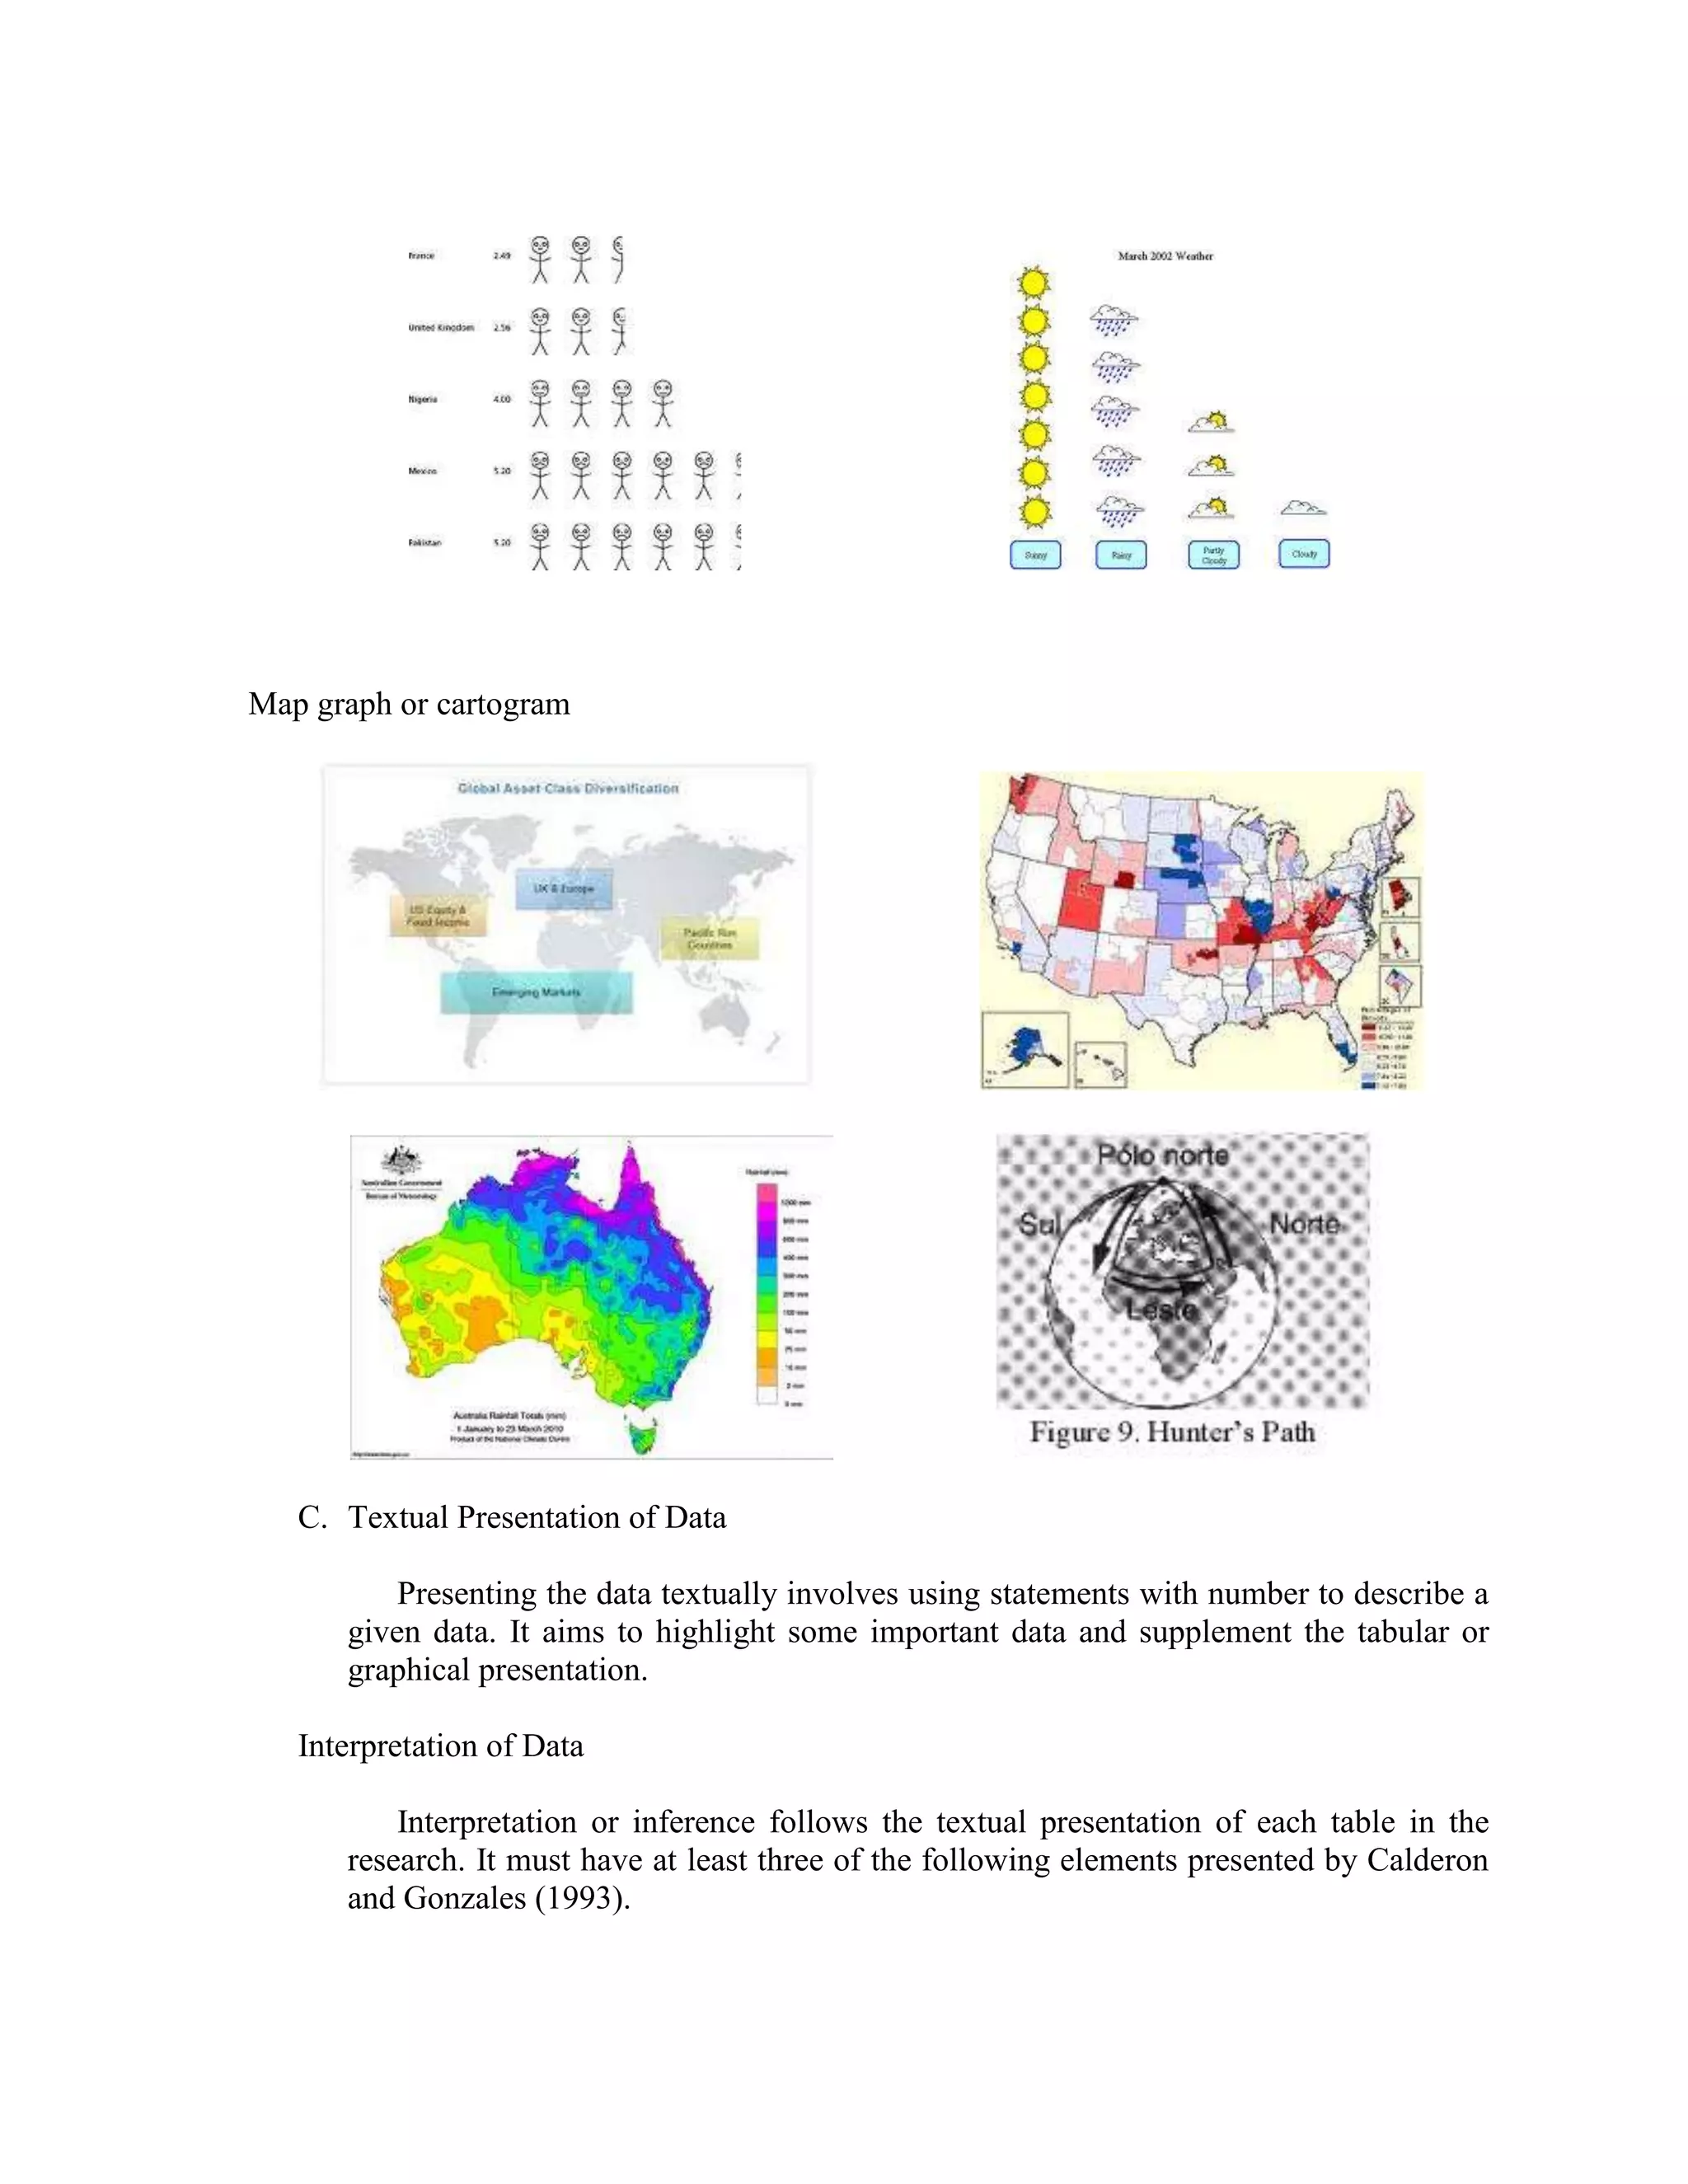

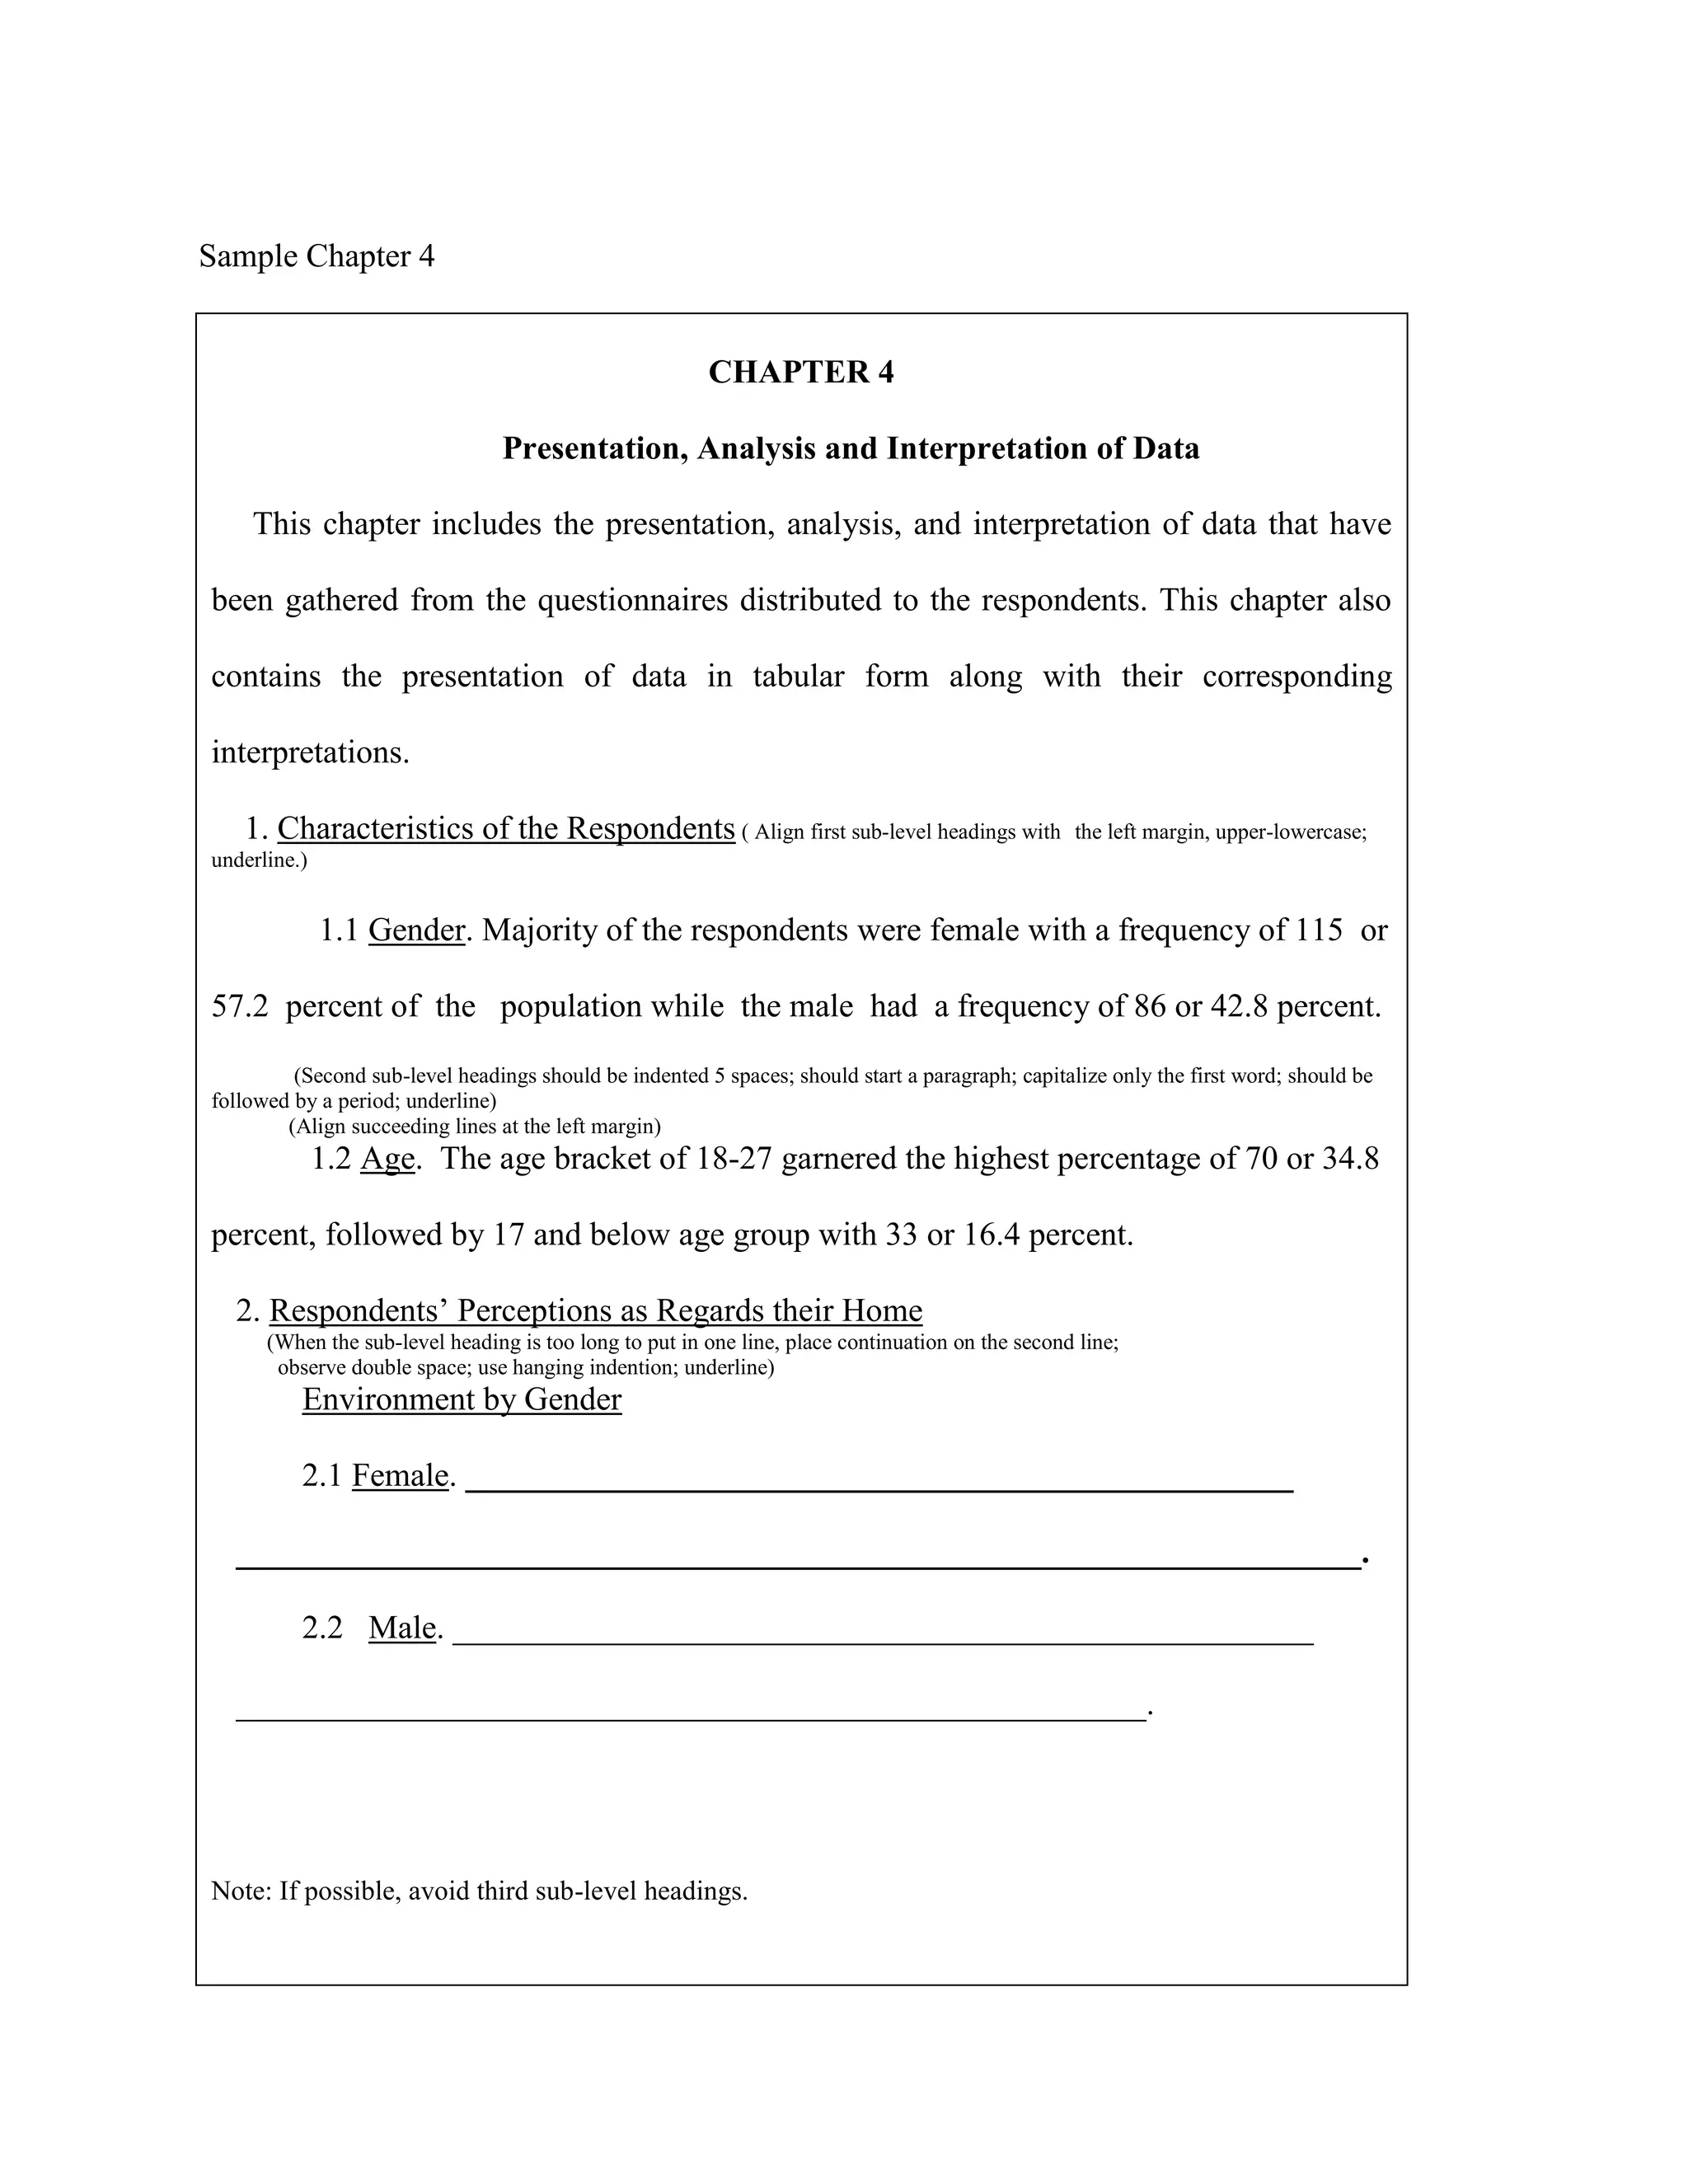
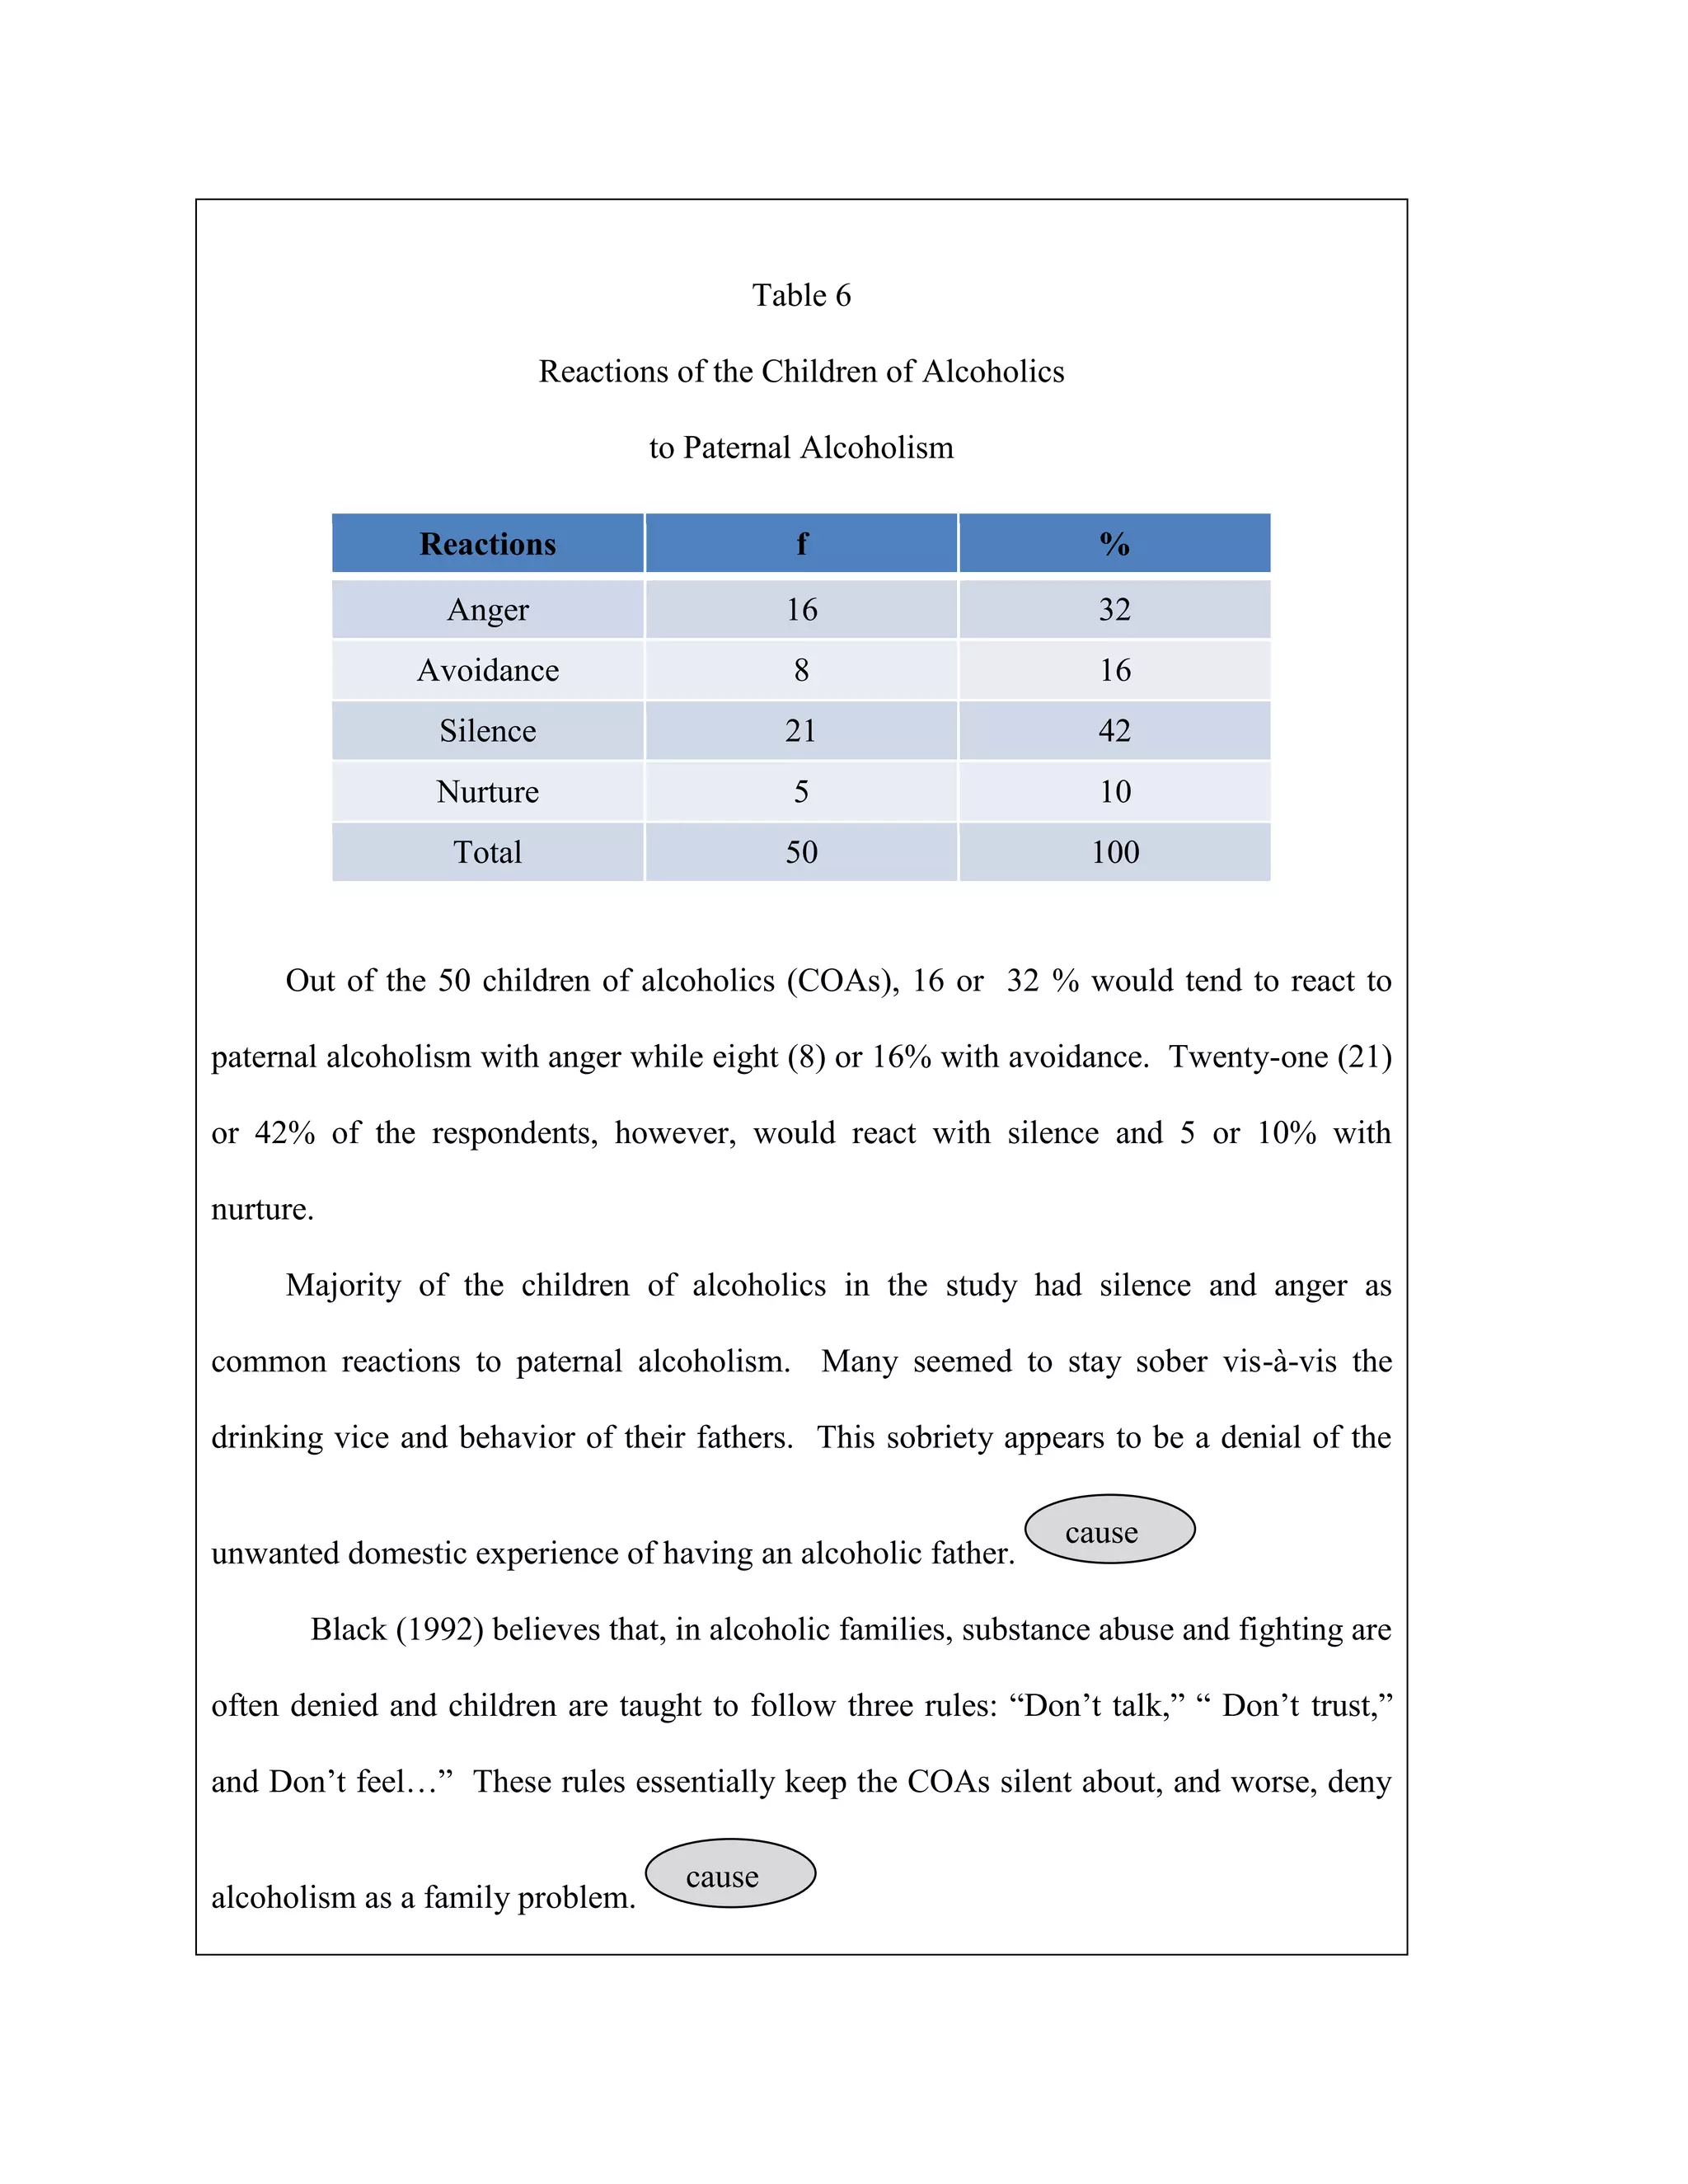
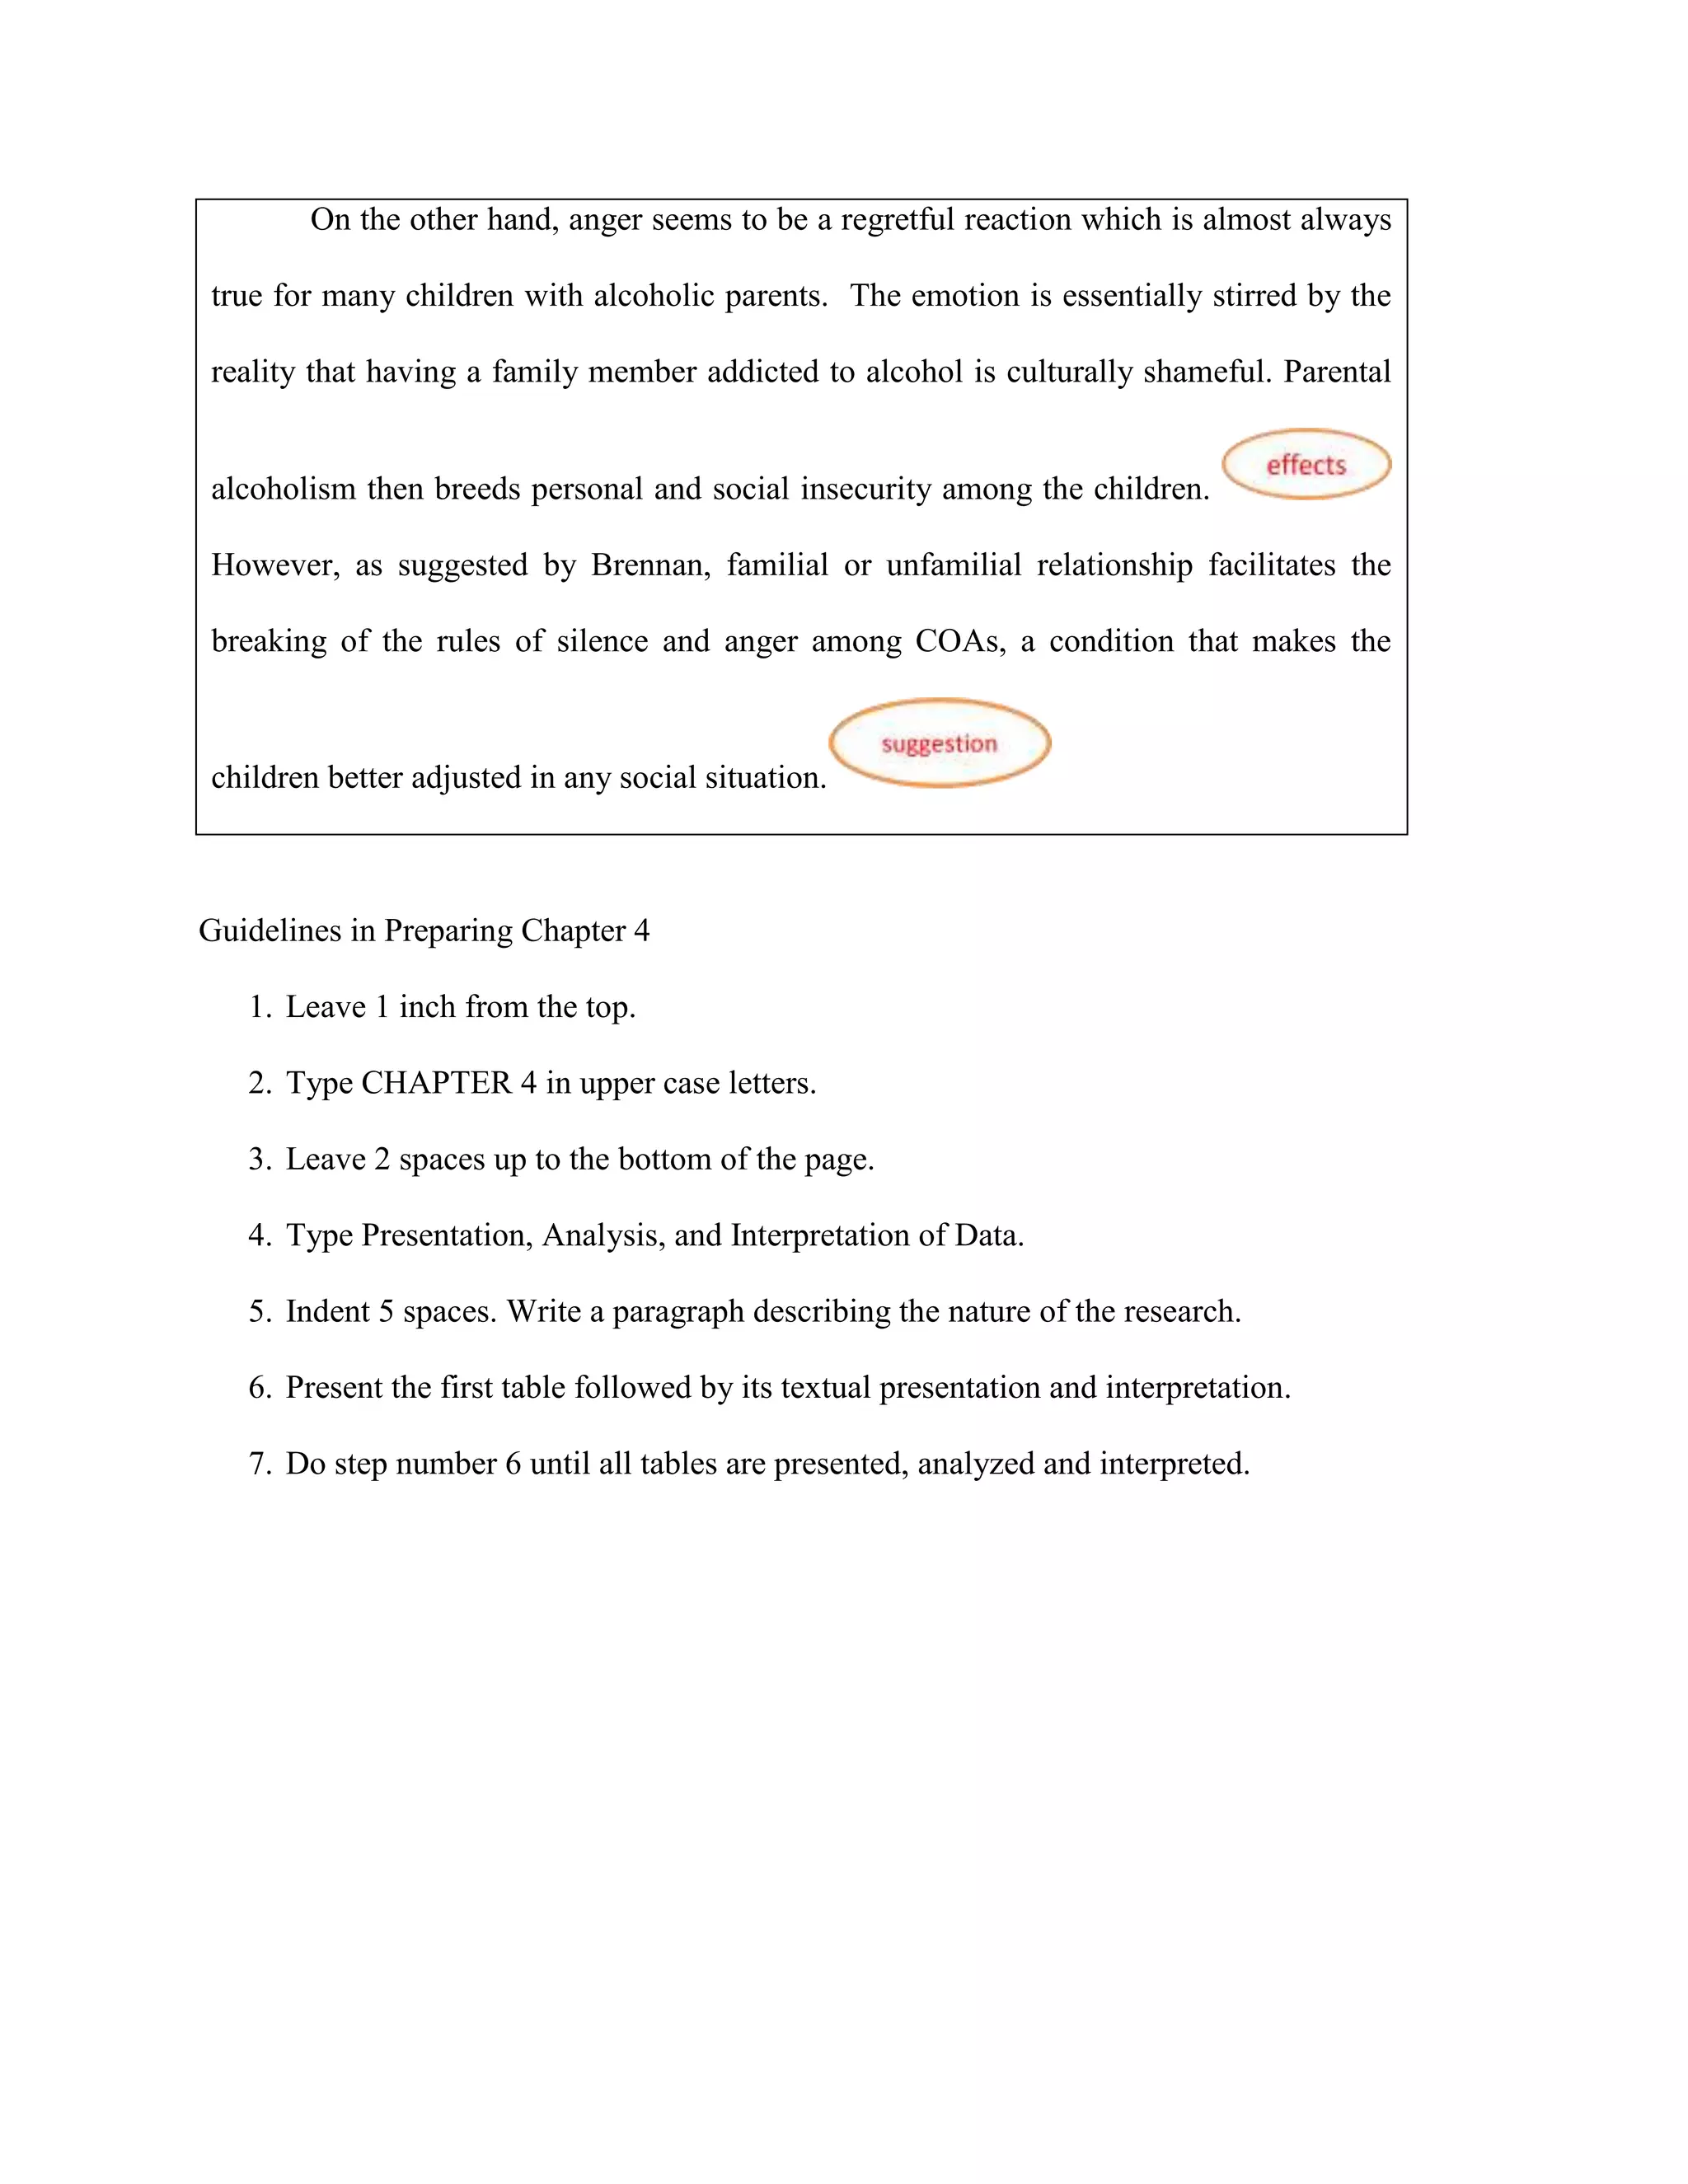

This chapter discusses the presentation, analysis, and interpretation of data in a research paper. It explains that data should be presented in chronological order through statistical tables and graphs, textual presentation, and interpretation or inferences. The chapter focuses on guidelines for tabular presentation, including constructing tables with titles, numbers, headings, bodies, and notes. It also discusses graphical presentation of data through common graphs like bar graphs, line graphs, circle graphs, pictograms, and map graphs. The chapter notes that textual presentation involves using statements with numbers to describe data and supplement tables and graphs. It concludes that interpretation should follow each table and include conditions, possible causes, possible effects, and comparisons to previous studies.