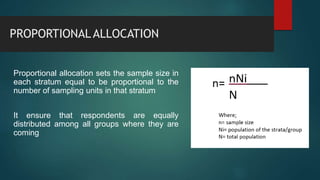
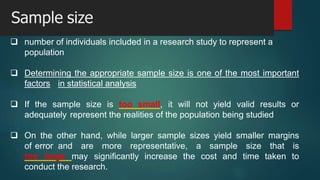
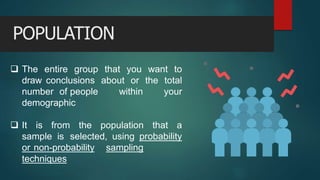
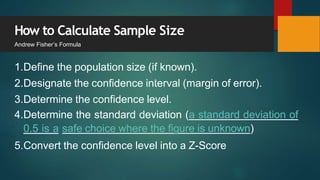
This document discusses factors to consider when determining the appropriate sample size for a research study, including population size, margin of error, confidence level, and standard deviation. It provides formulas for calculating sample size for both known and unknown populations. The key aspects are that sample size must be large enough to represent the population and yield valid results, but not so large as to greatly increase time and costs. Formulas shown allow researchers to calculate the minimum required sample size based on the desired confidence level and margin of error.

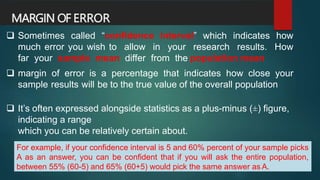


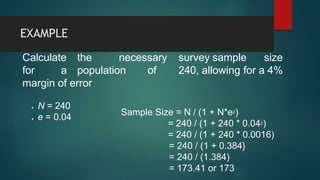
![Using the standard formula
= [2.582 * 0.5(1-0.5)] / 0.052
/ 2 2
1 + [2.58 * 0.5(1-0.5)] / 0.05 * 425]
= [6.6564 * 0.25] / 0.0025 / 1 + [6.6564 * 0.25] / 1.0625
= 665 / 2.5663
= 259.39](https://image.slidesharecdn.com/4determinesamplesizeforaresearchstudy-240215054705-016d3e7b/85/4-Determine-Sample-Size-for-a-Research-Study-pptx-11-320.jpg)
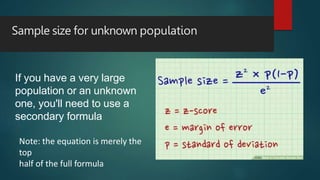

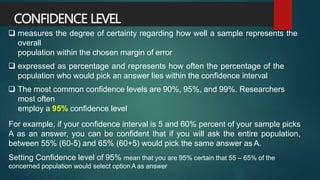
![Using the secondary formula
= [1.652 * 0.5(1-0.5)] / 0.032
= [2.7225 * 0.25] / 0.0009
= 0.6806 / 0.0009
= 756.22 or 756](https://image.slidesharecdn.com/4determinesamplesizeforaresearchstudy-240215054705-016d3e7b/85/4-Determine-Sample-Size-for-a-Research-Study-pptx-14-320.jpg)
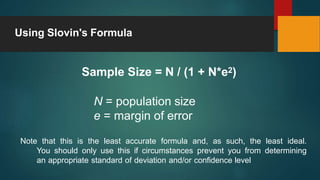
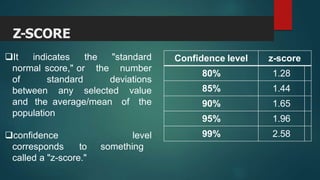
![= [2.582 * 0.5(1-0.5)] / 0.052
/ 2 2
1 + [2.58 * 0.5(1-0.5)] / 0.05 * 1274]
= [6.6564 * 0.25] / 0.0025 / 1 + [6.6564 * 0.25] / 3.185
= 665 / 1.5224
= 436.81 or 437
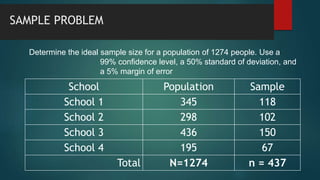
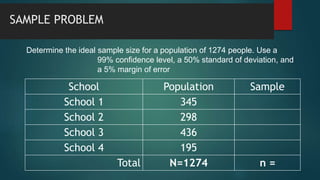
SAMPLE PROBLEM
N = 1274 people
Confidence level = 99%
SD = 50% (0.5)
Margin of error = 5%](https://image.slidesharecdn.com/4determinesamplesizeforaresearchstudy-240215054705-016d3e7b/85/4-Determine-Sample-Size-for-a-Research-Study-pptx-18-320.jpg)