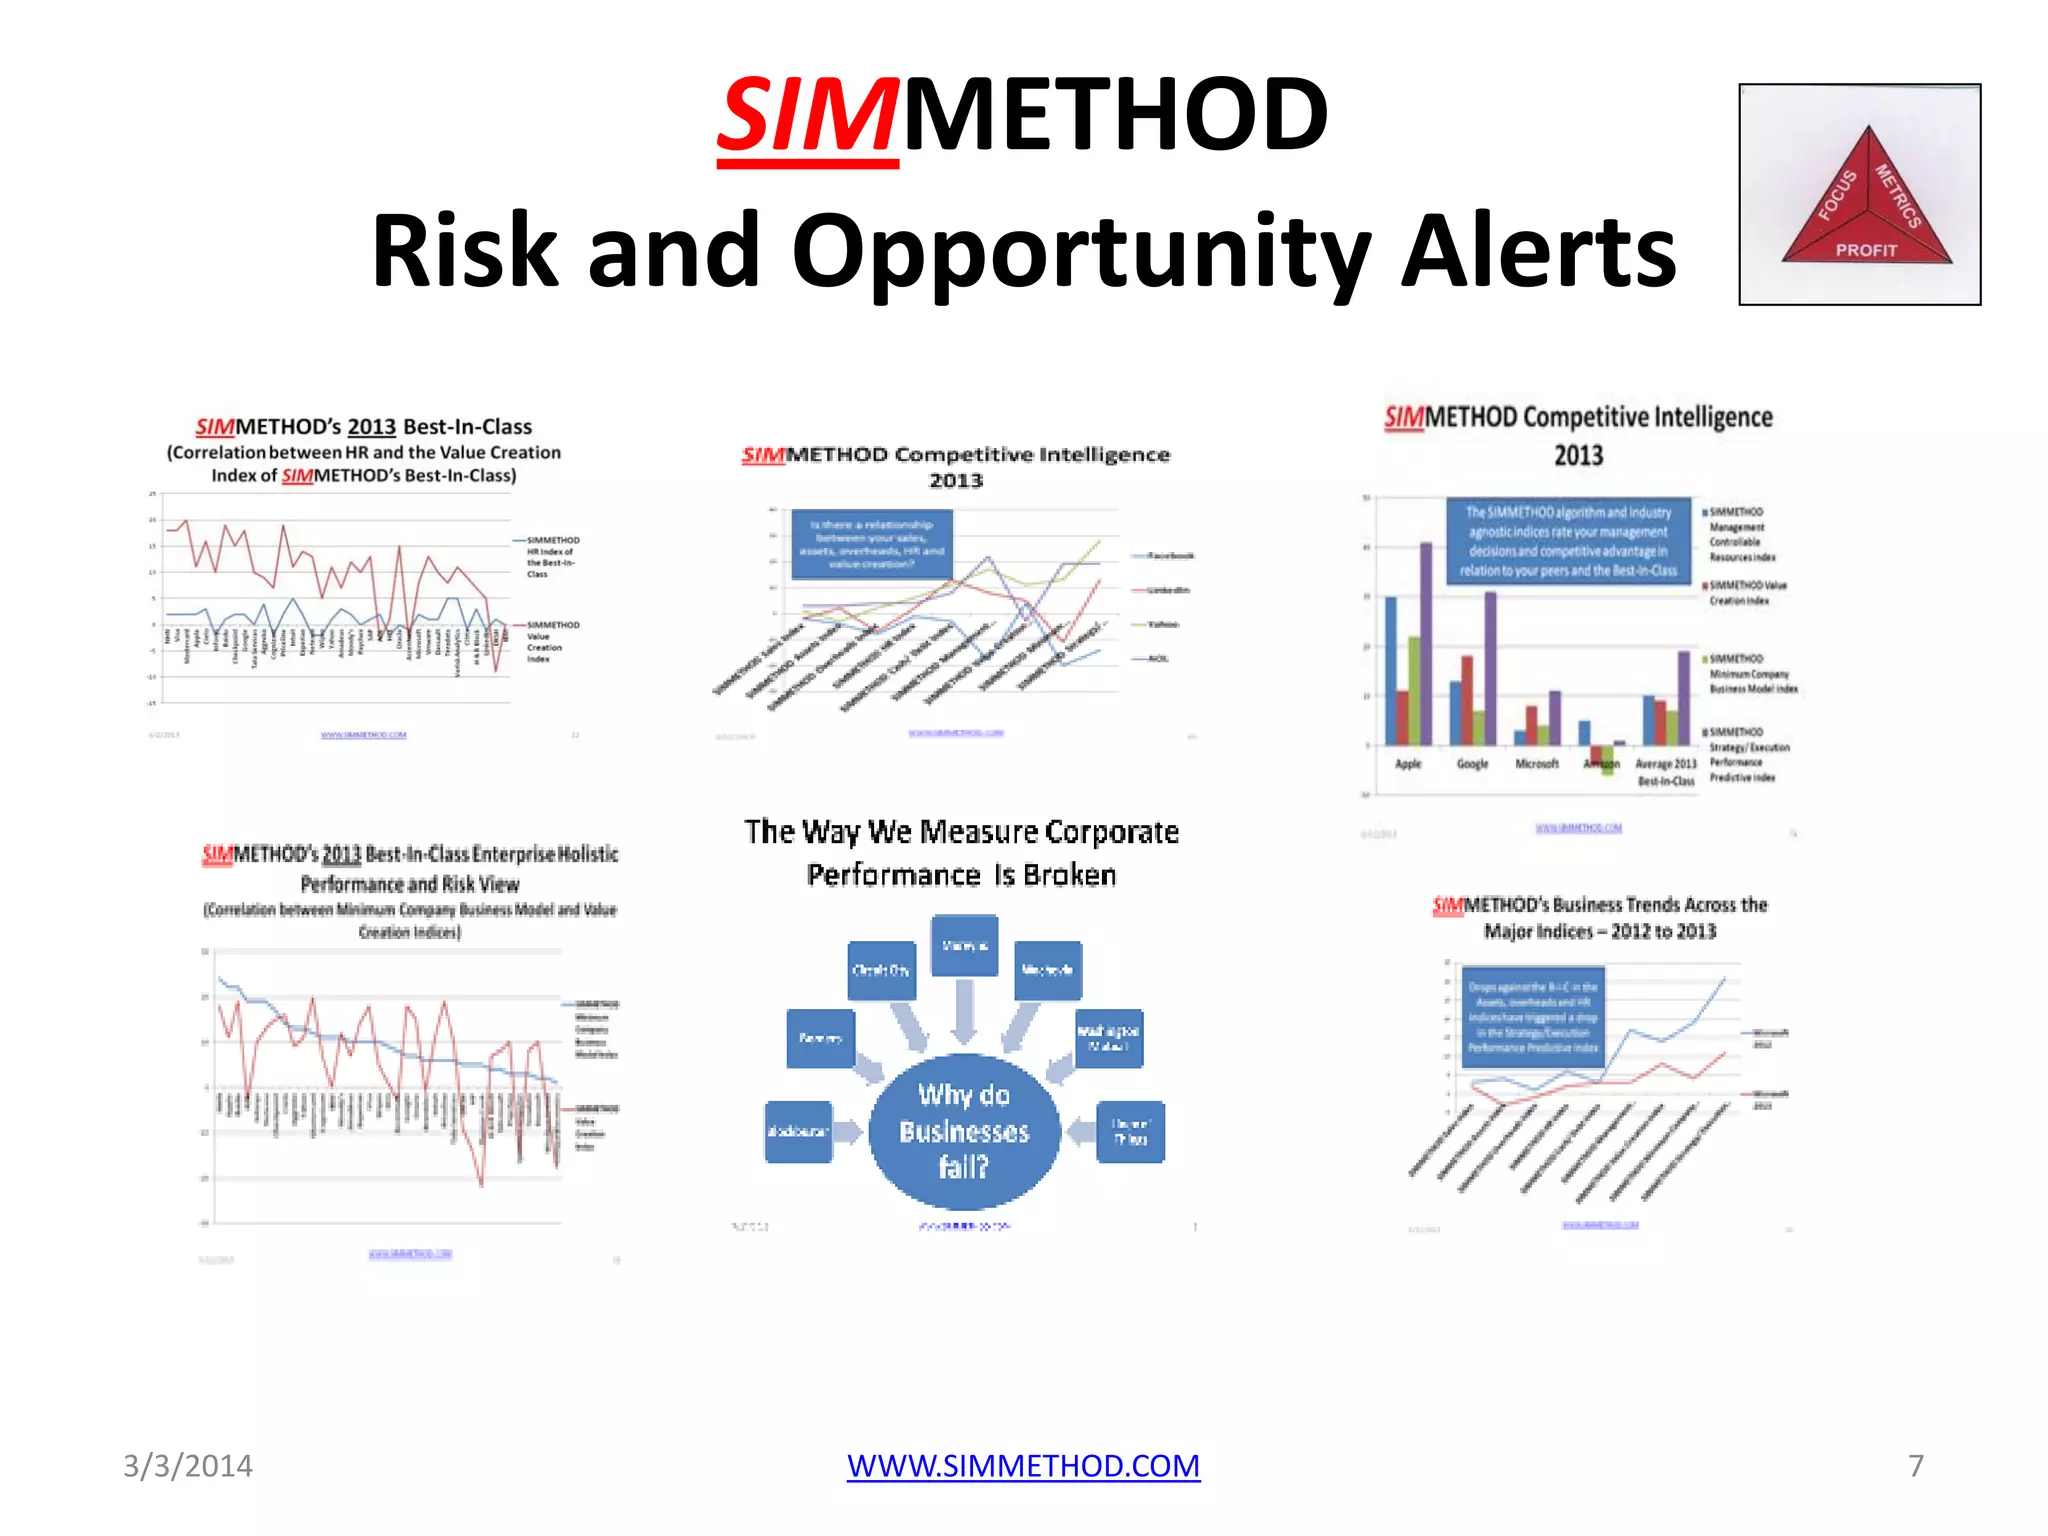
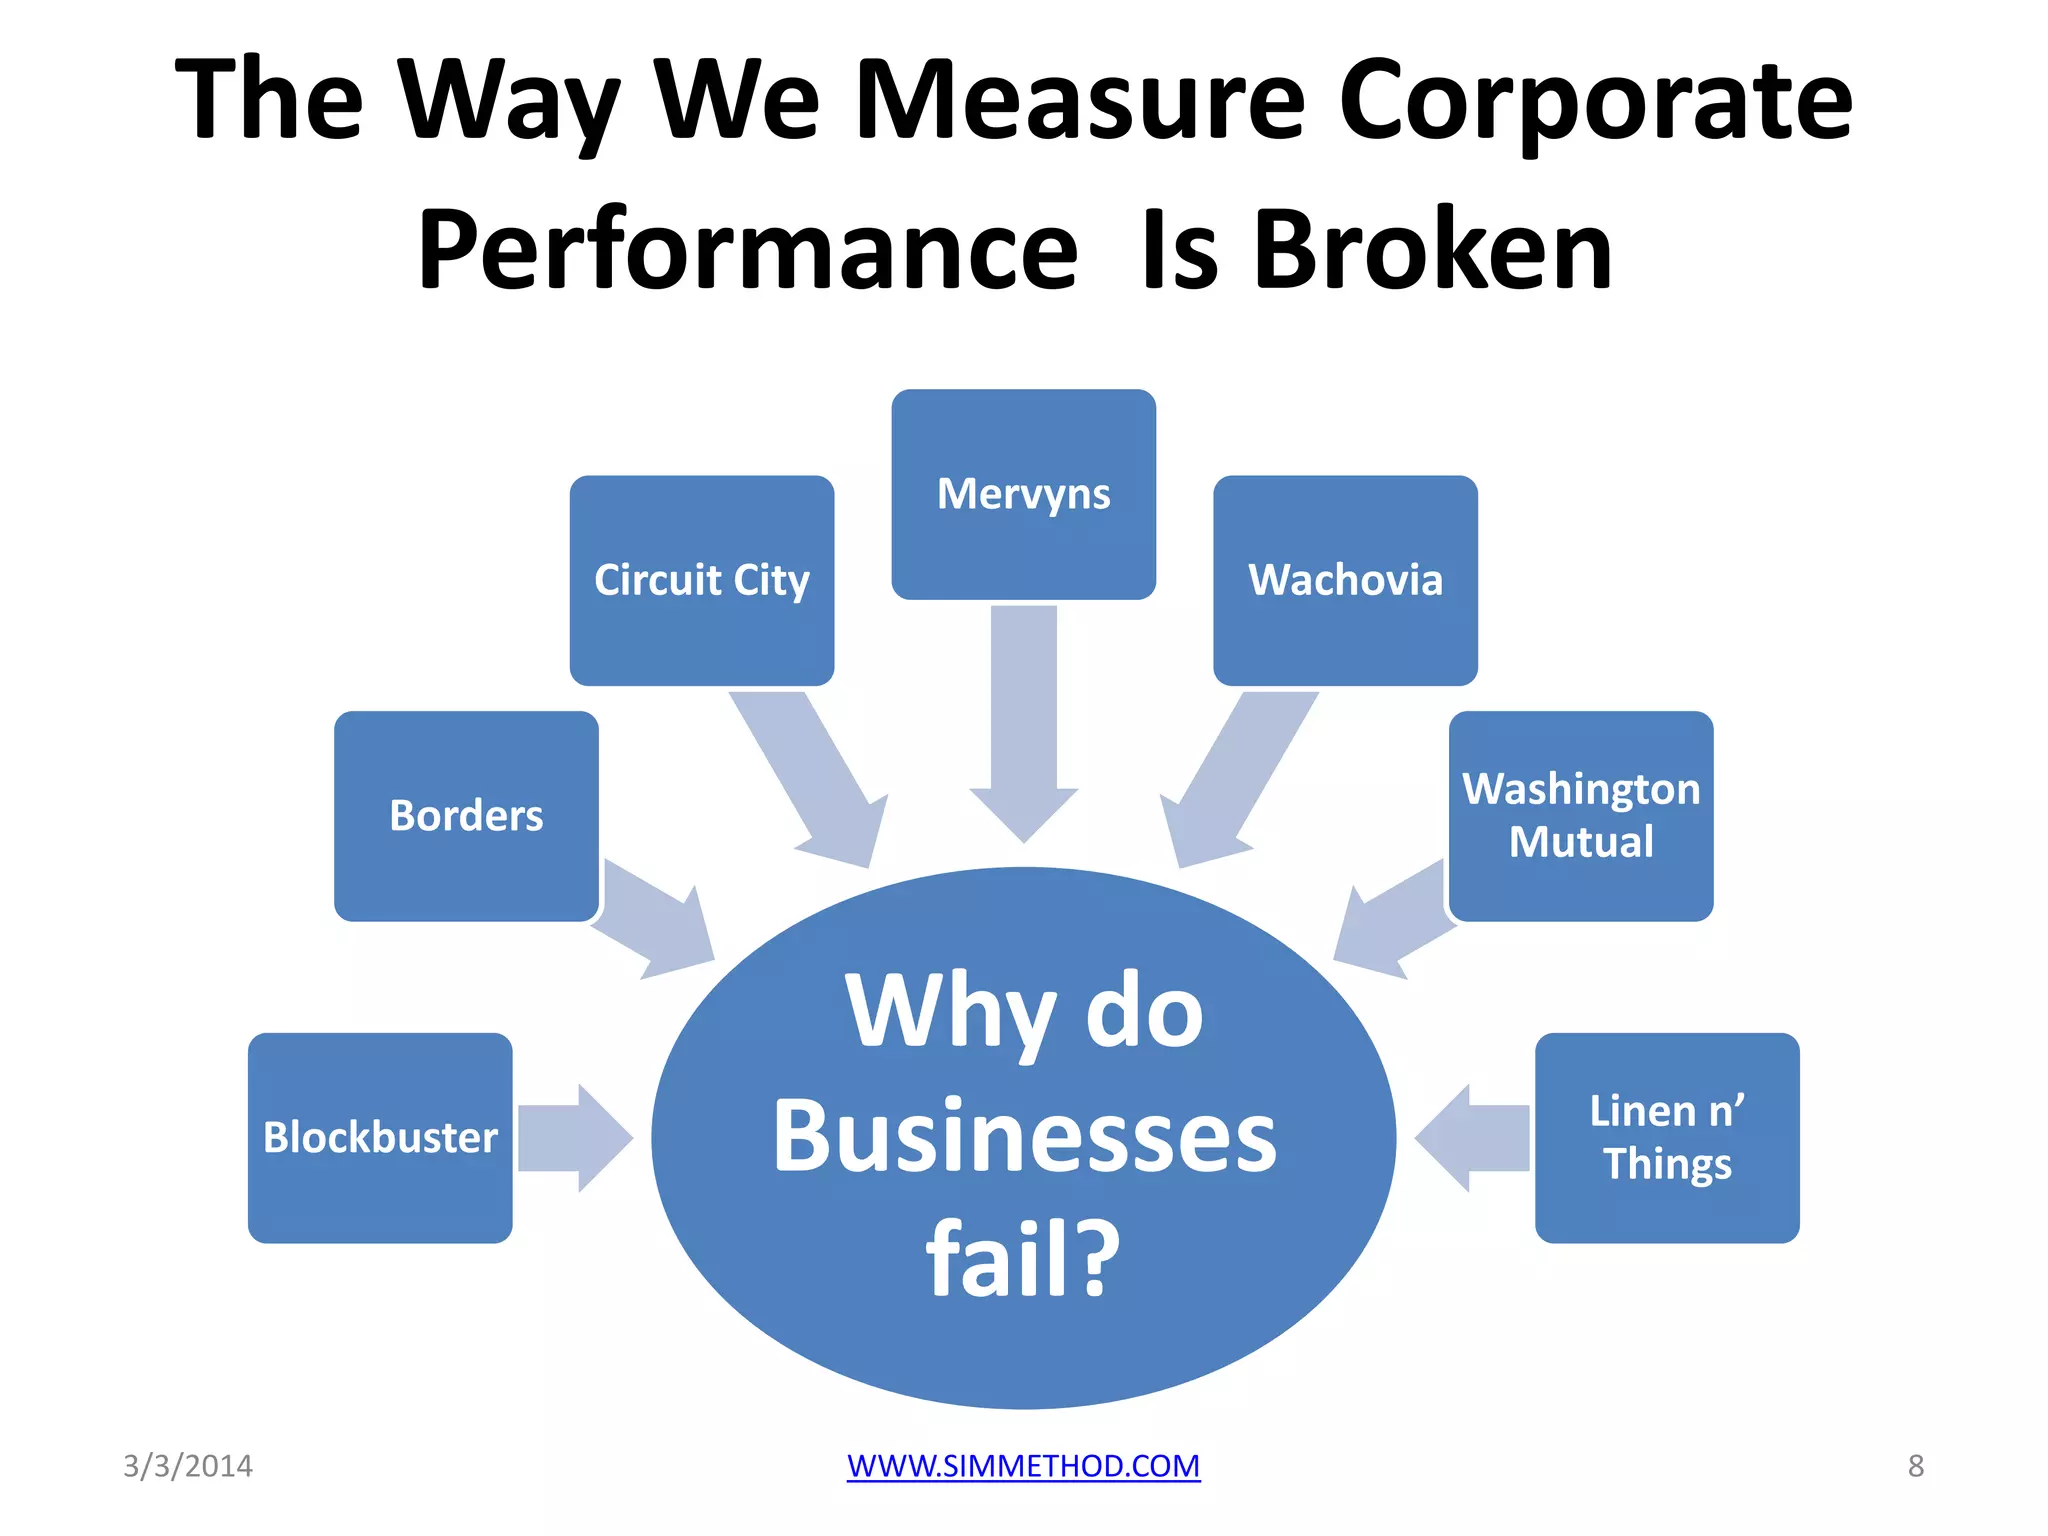
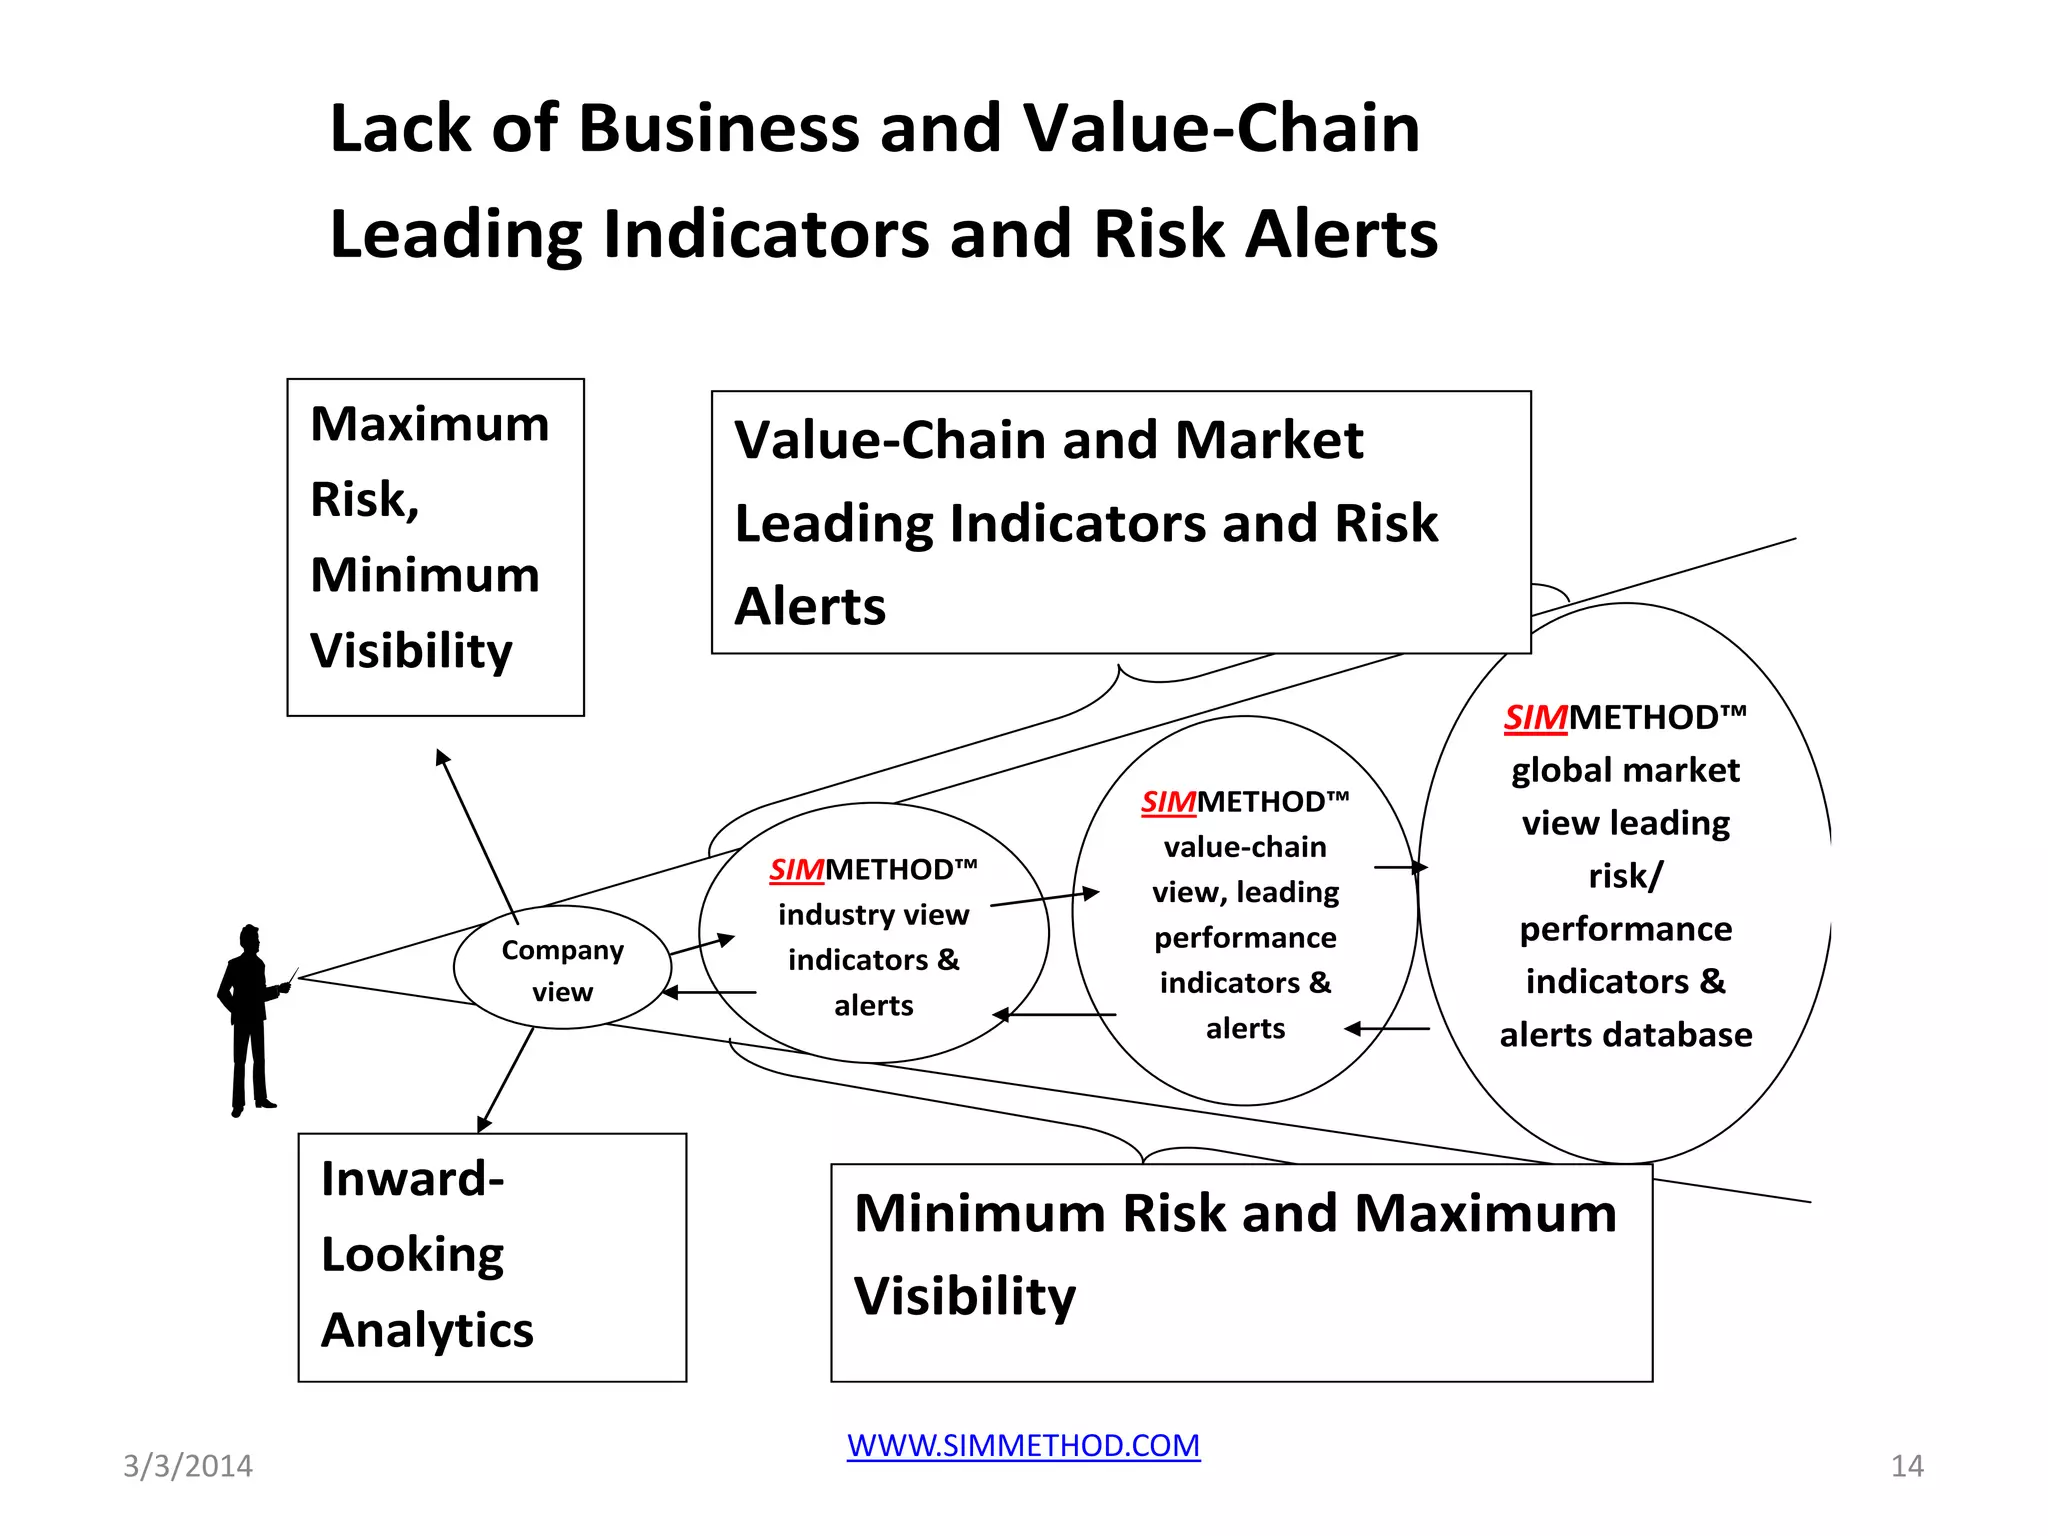
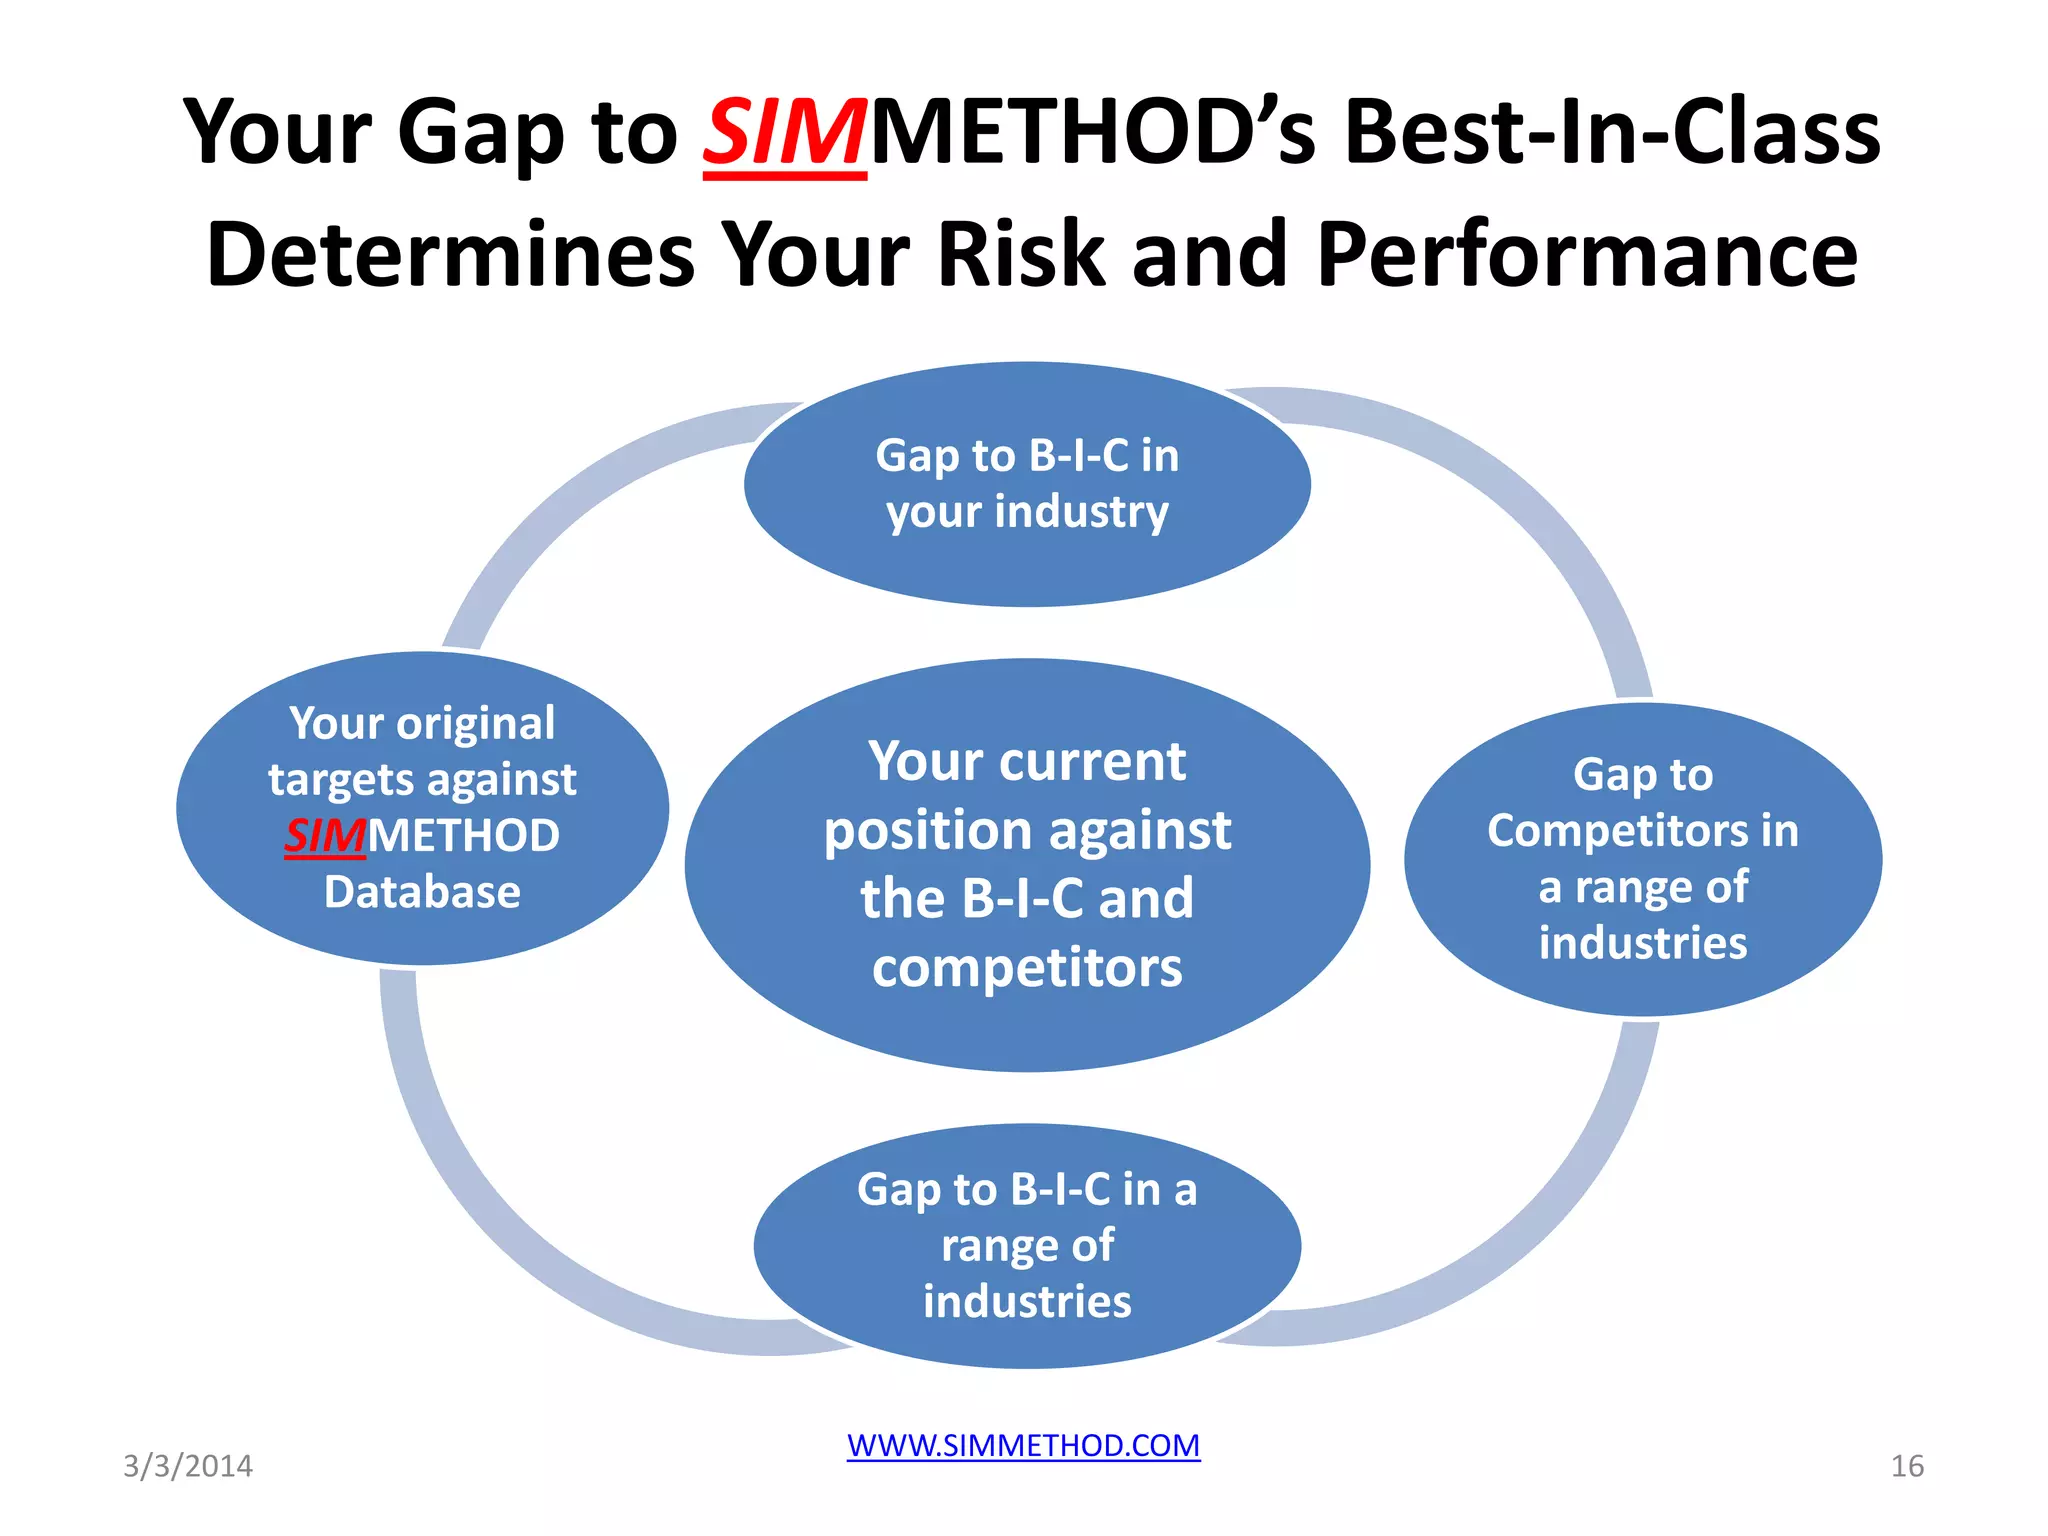
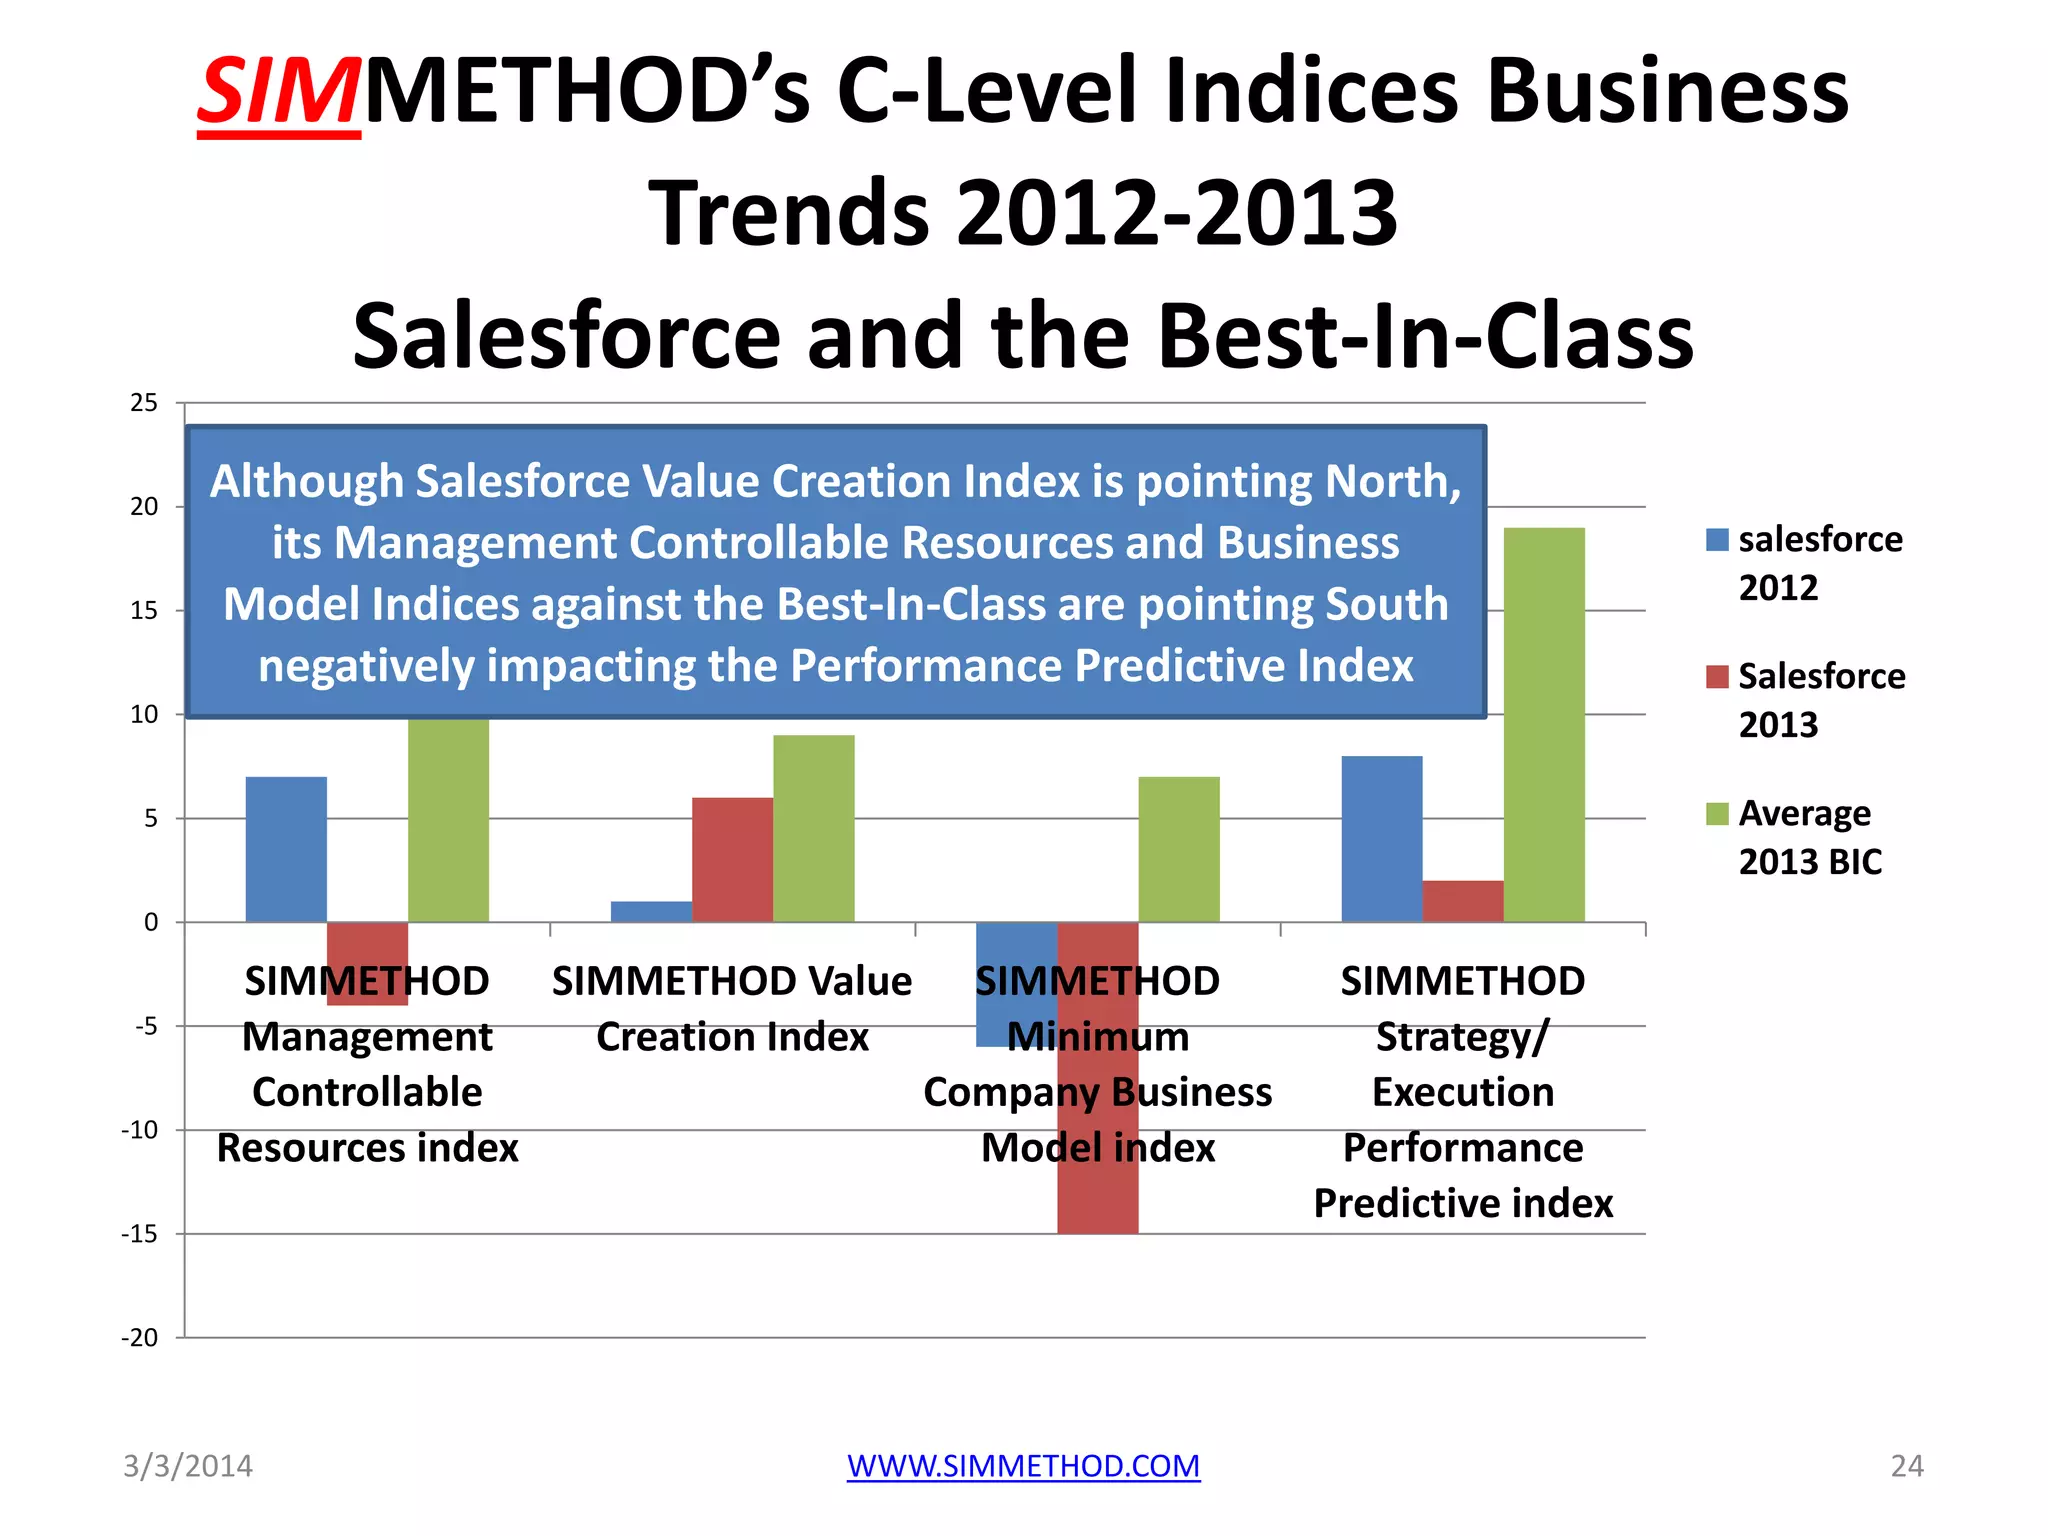
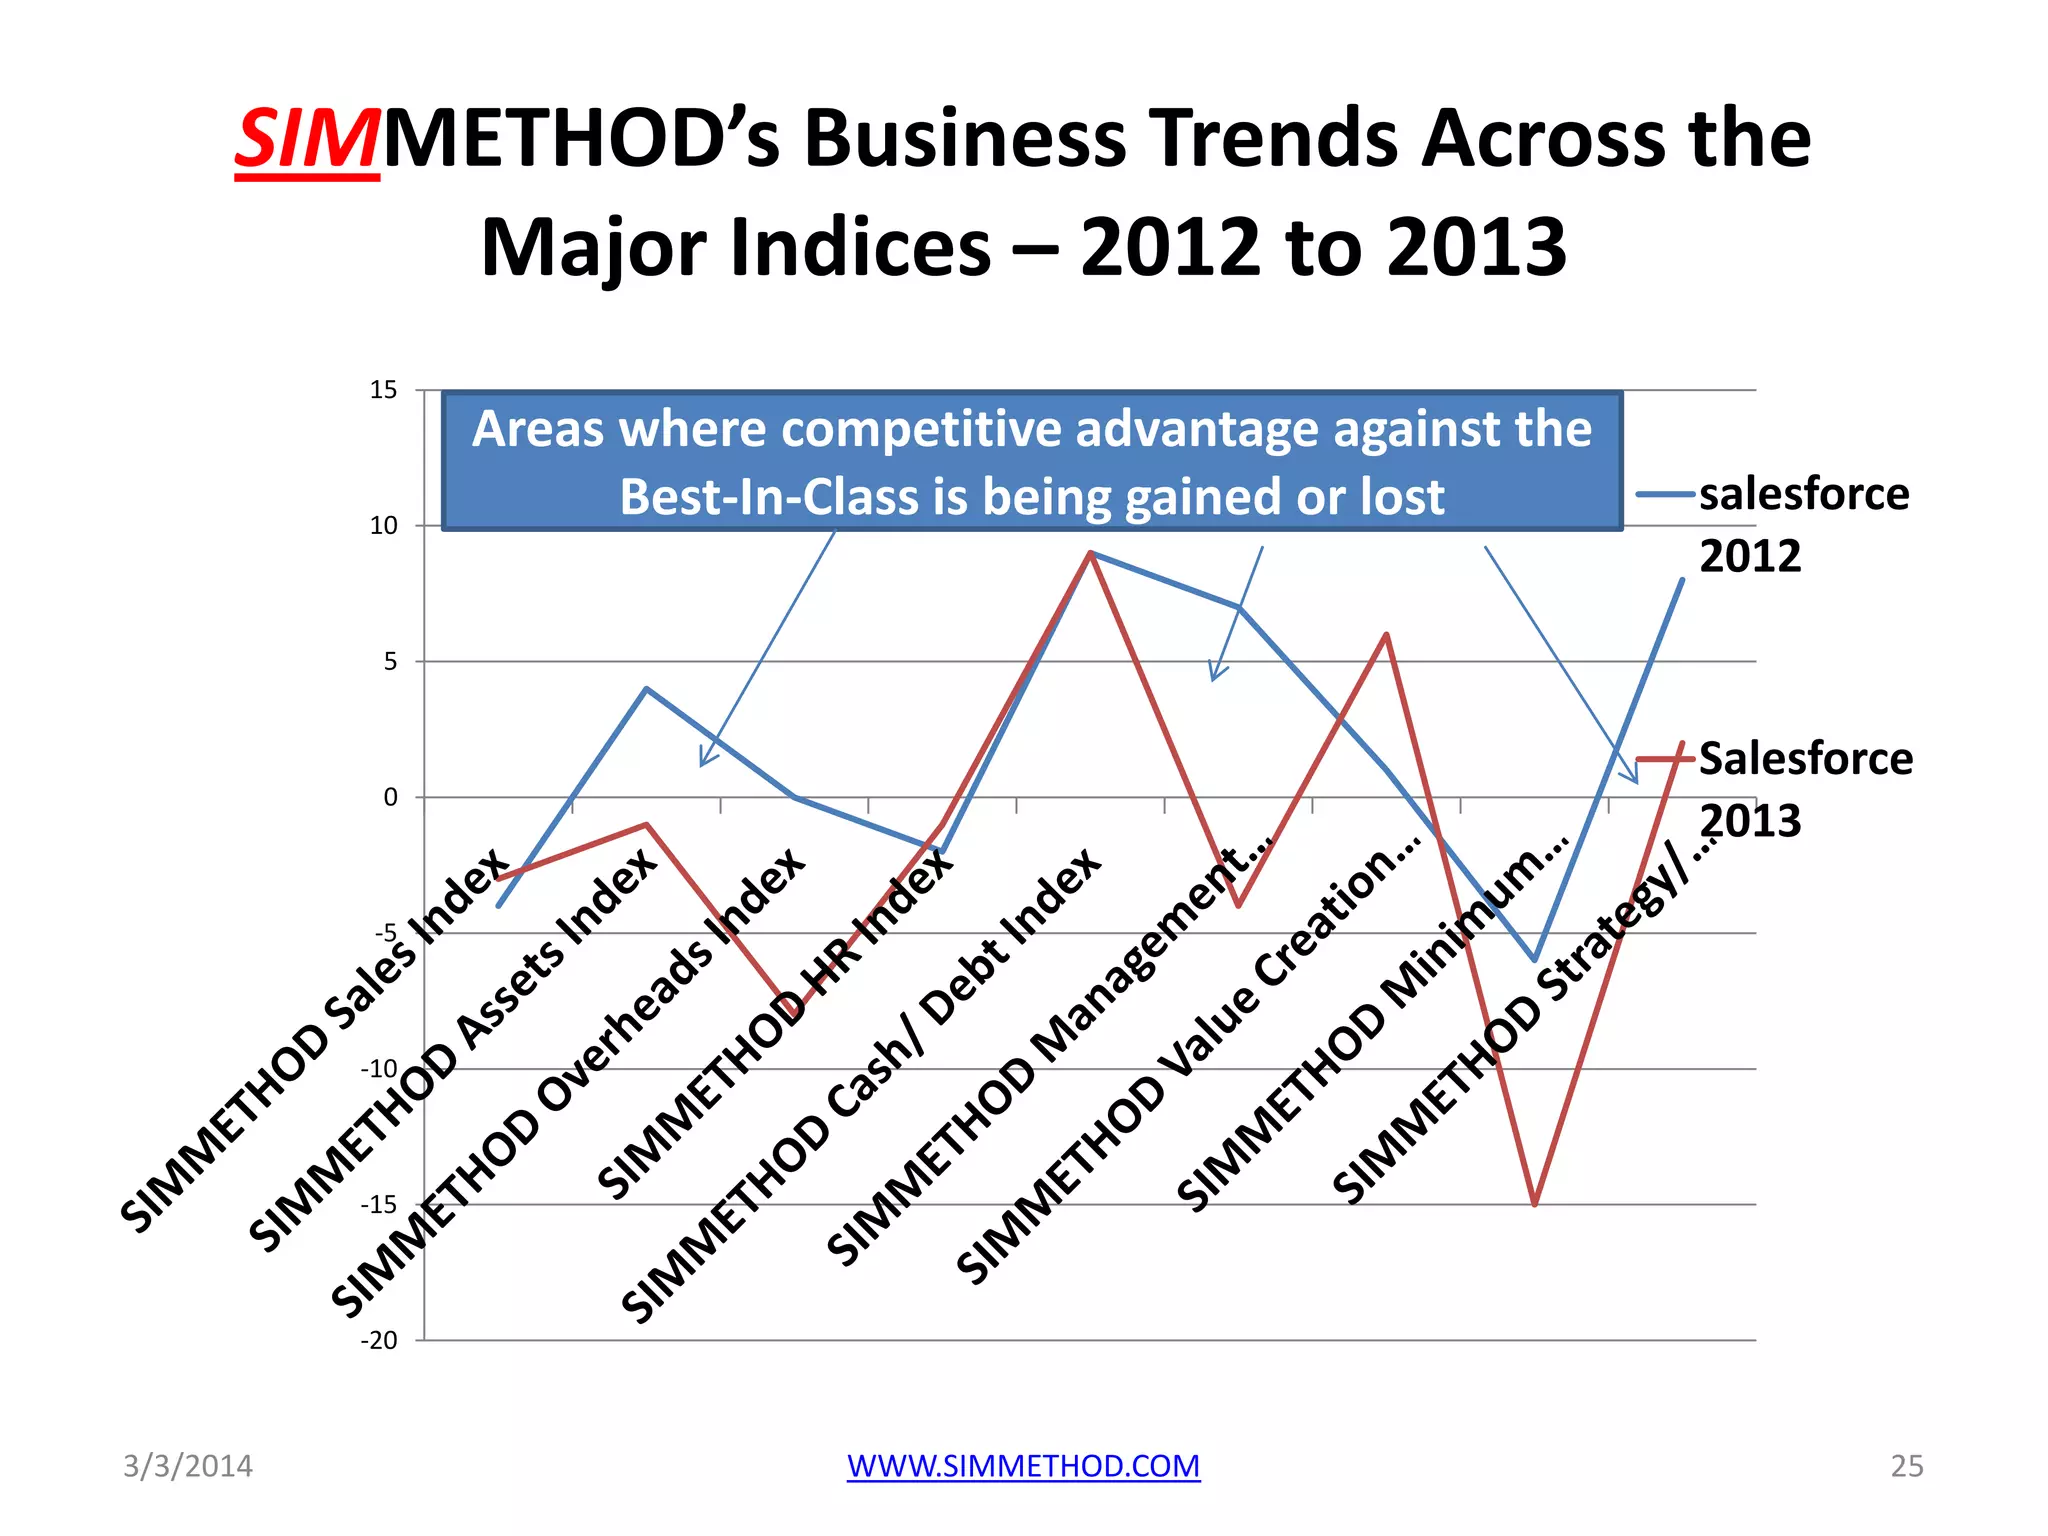
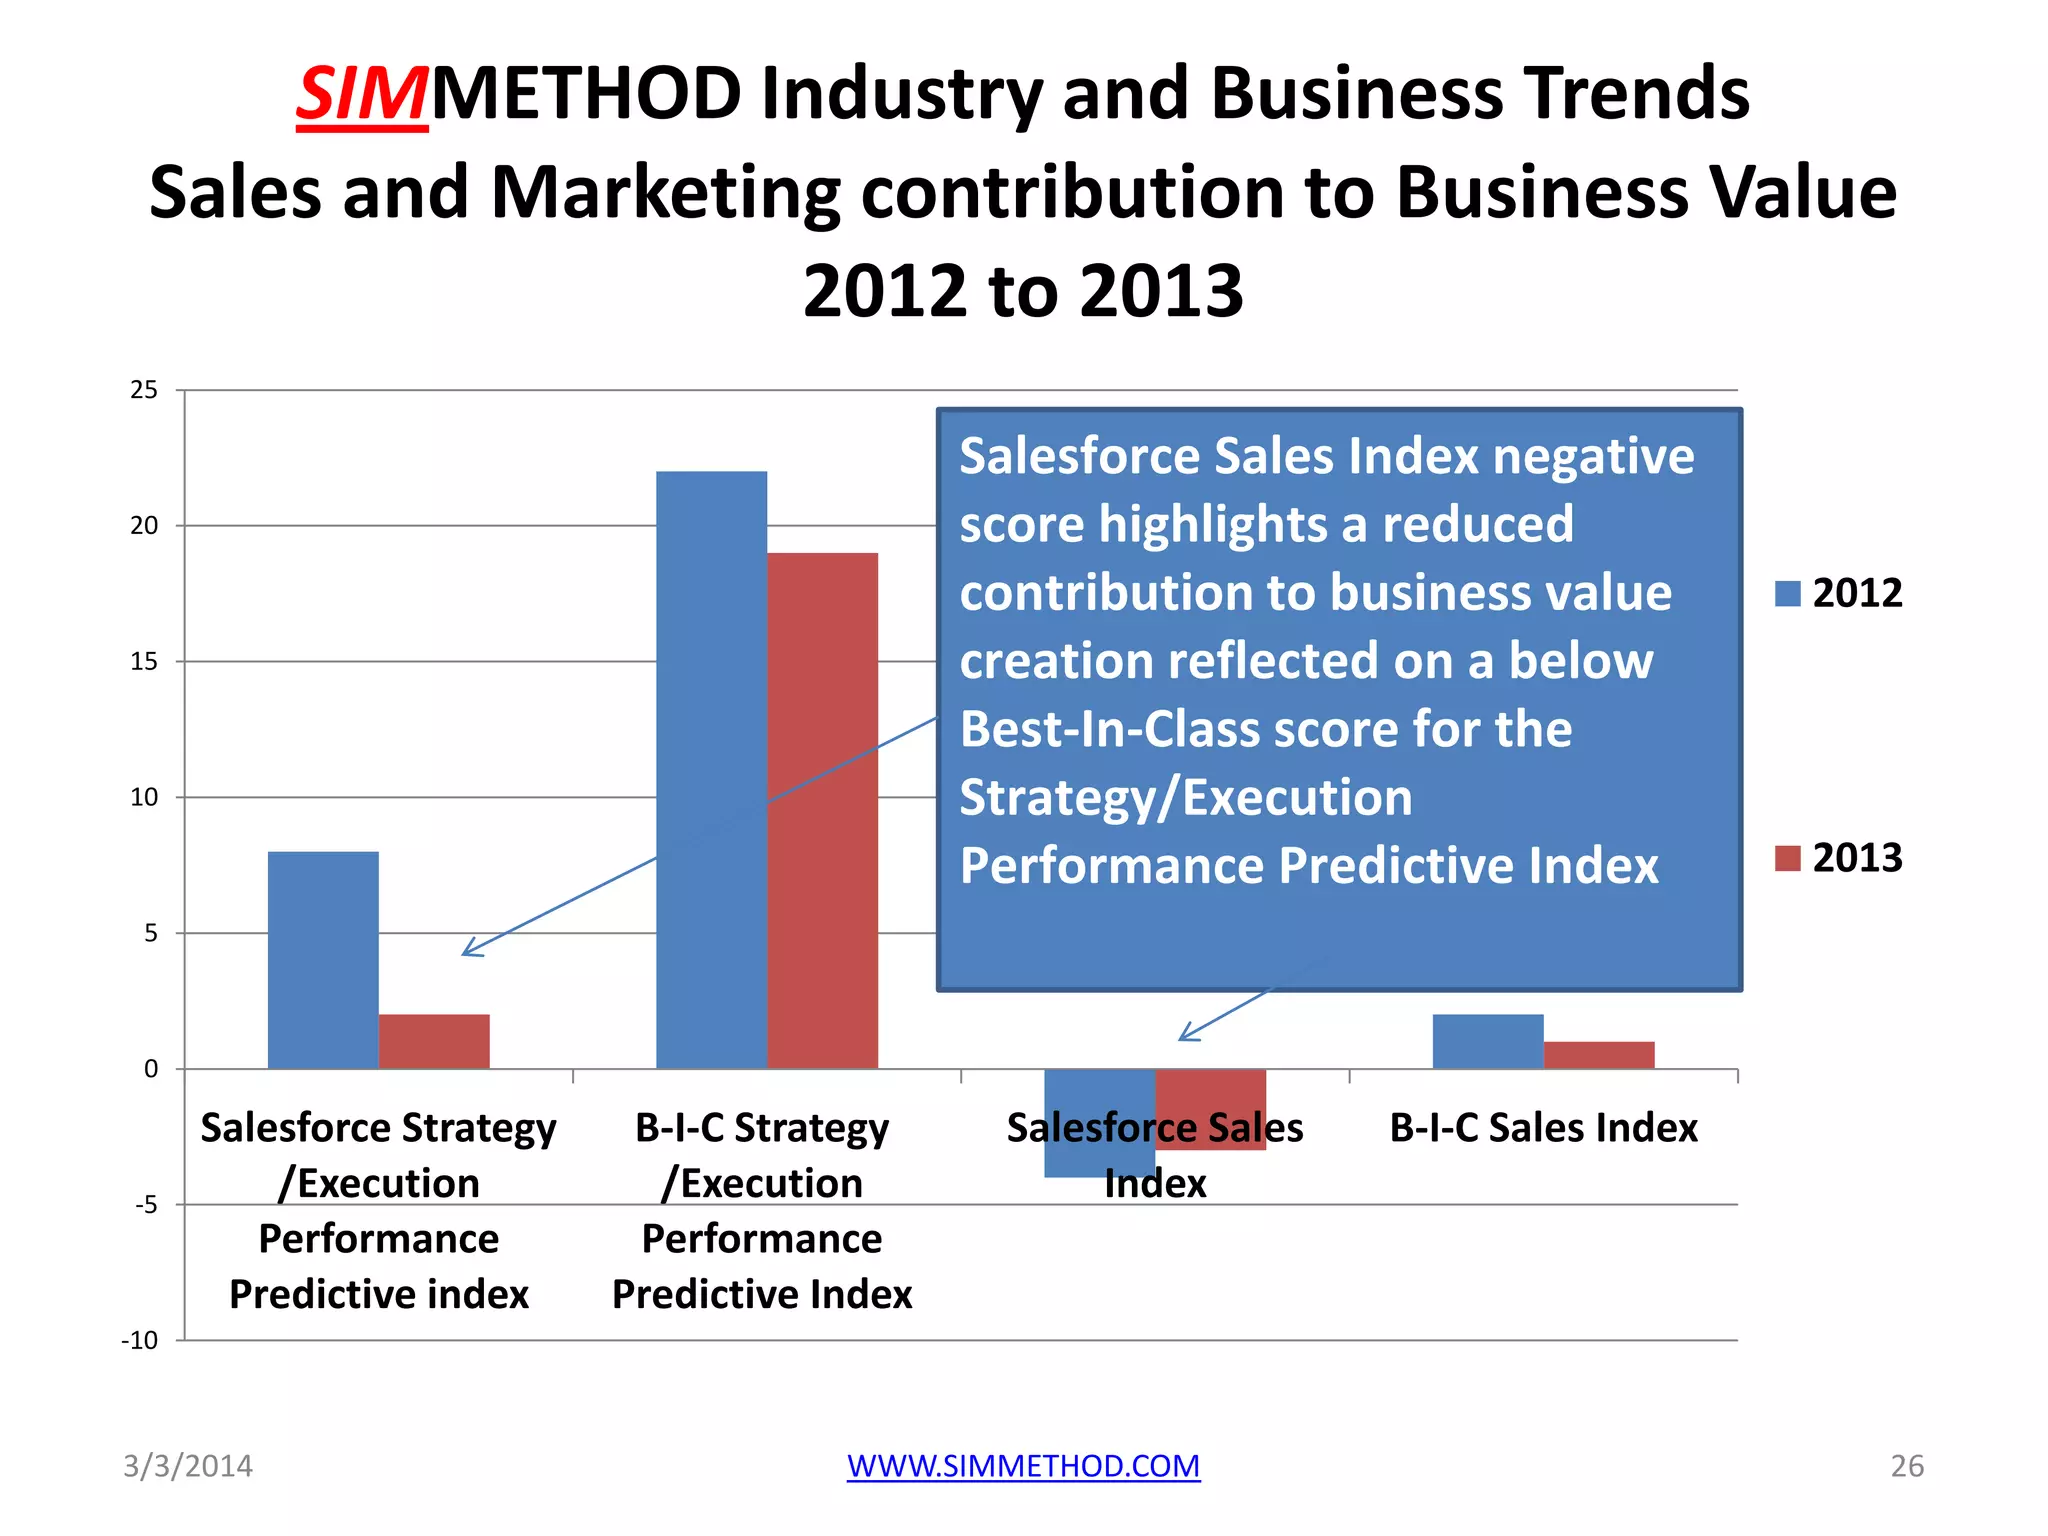
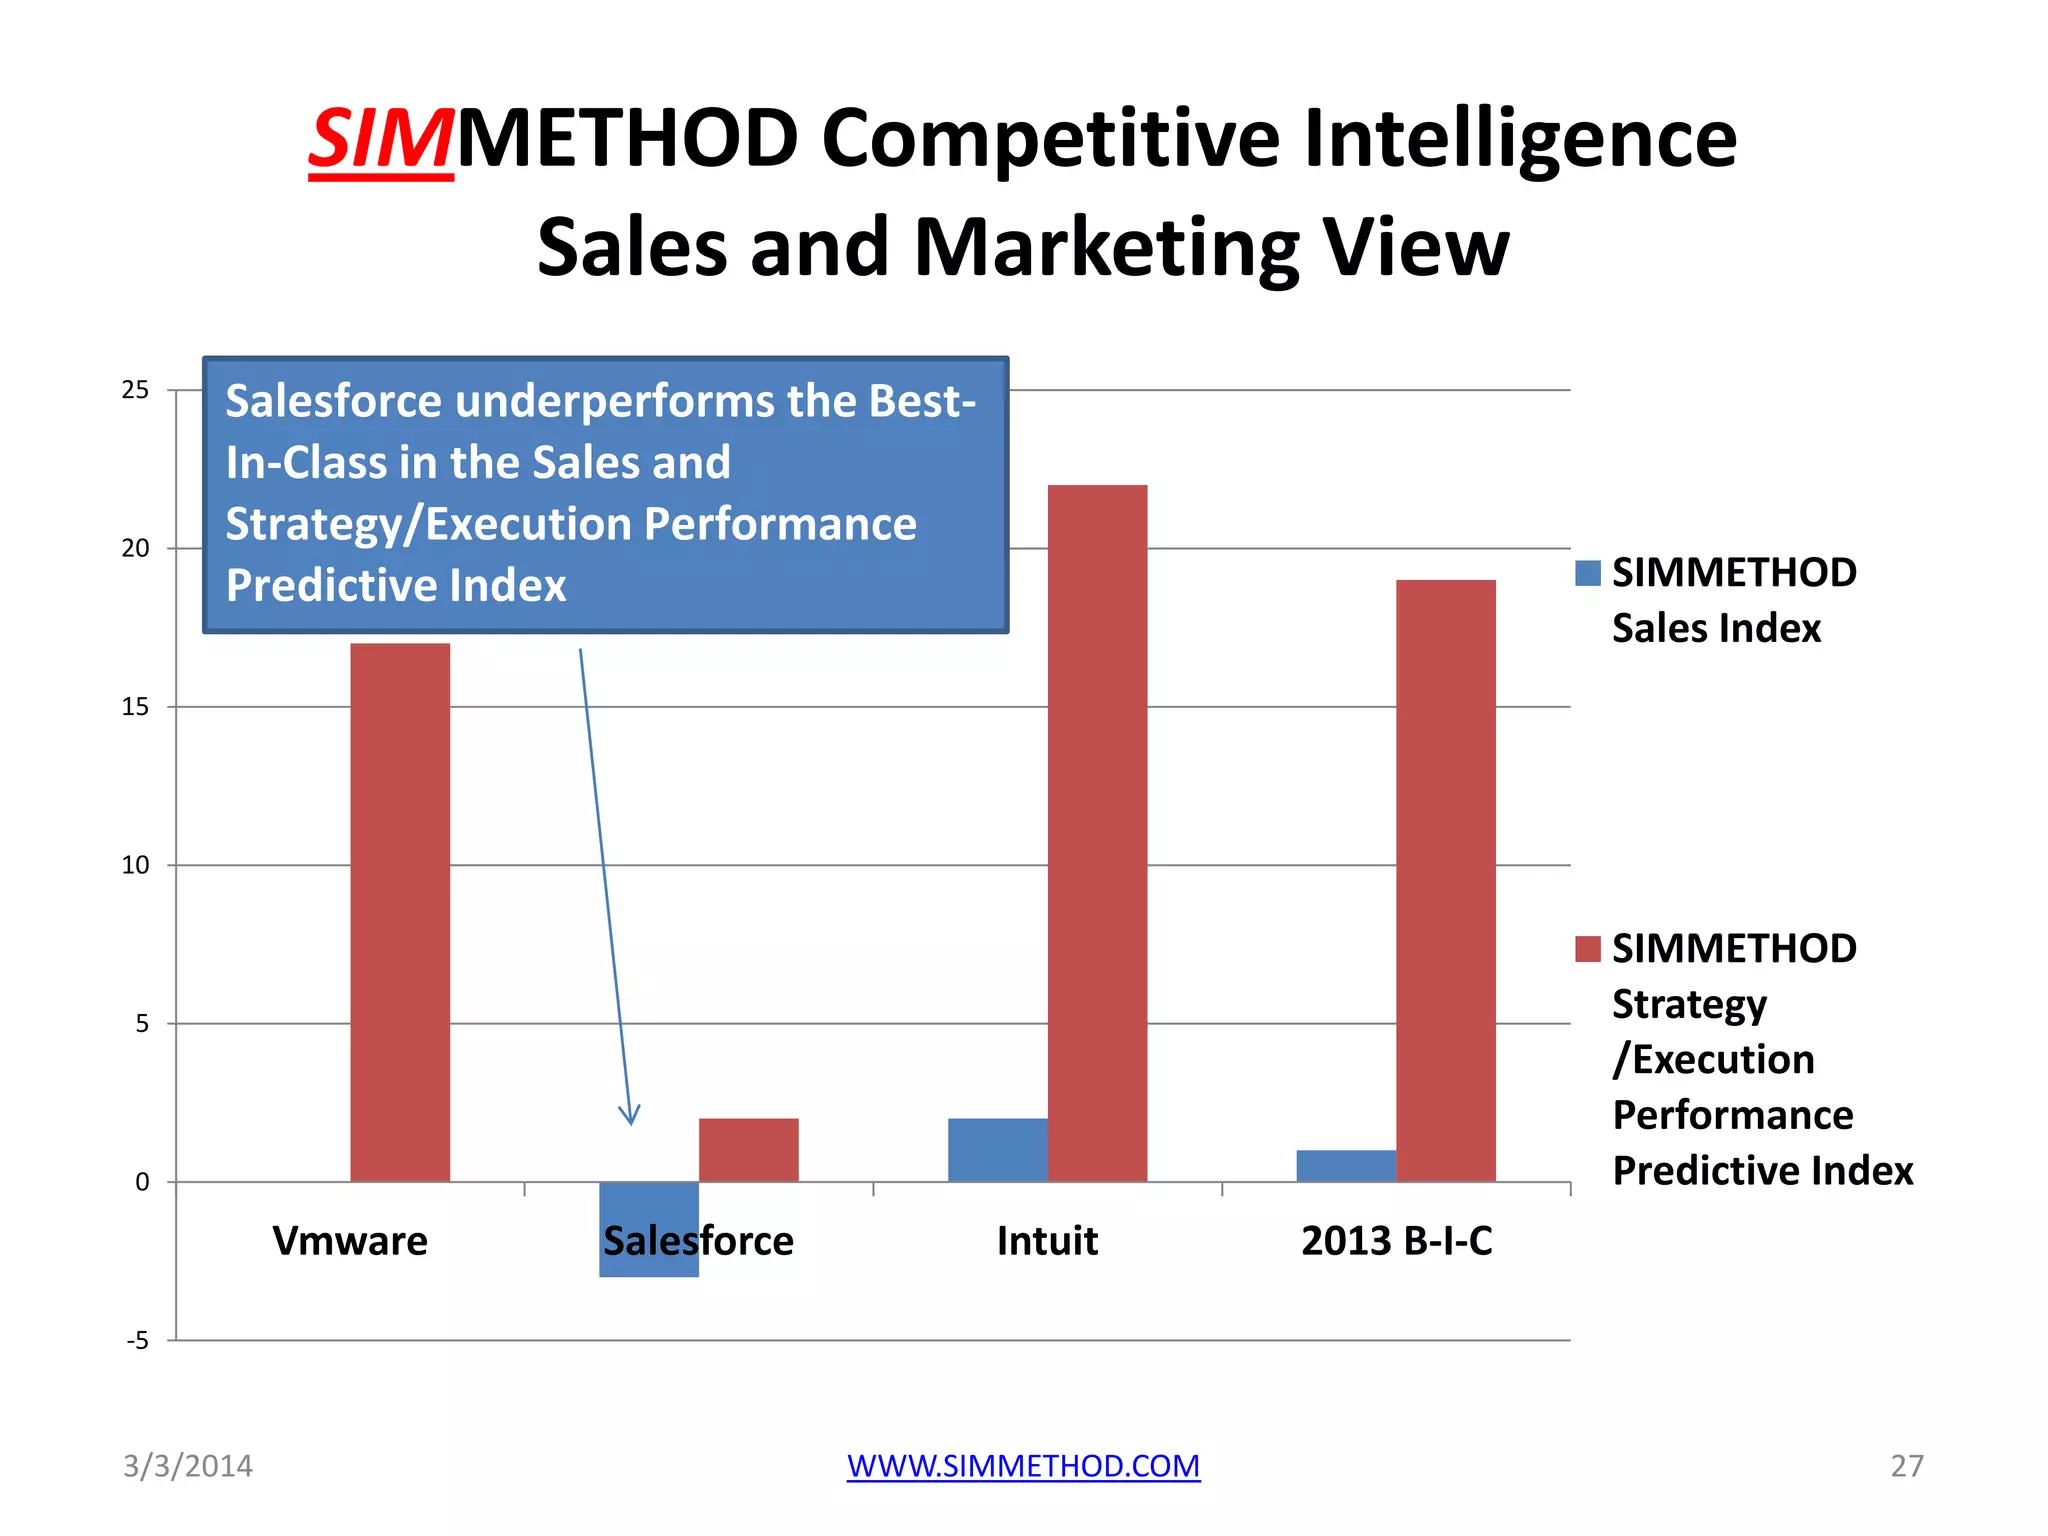
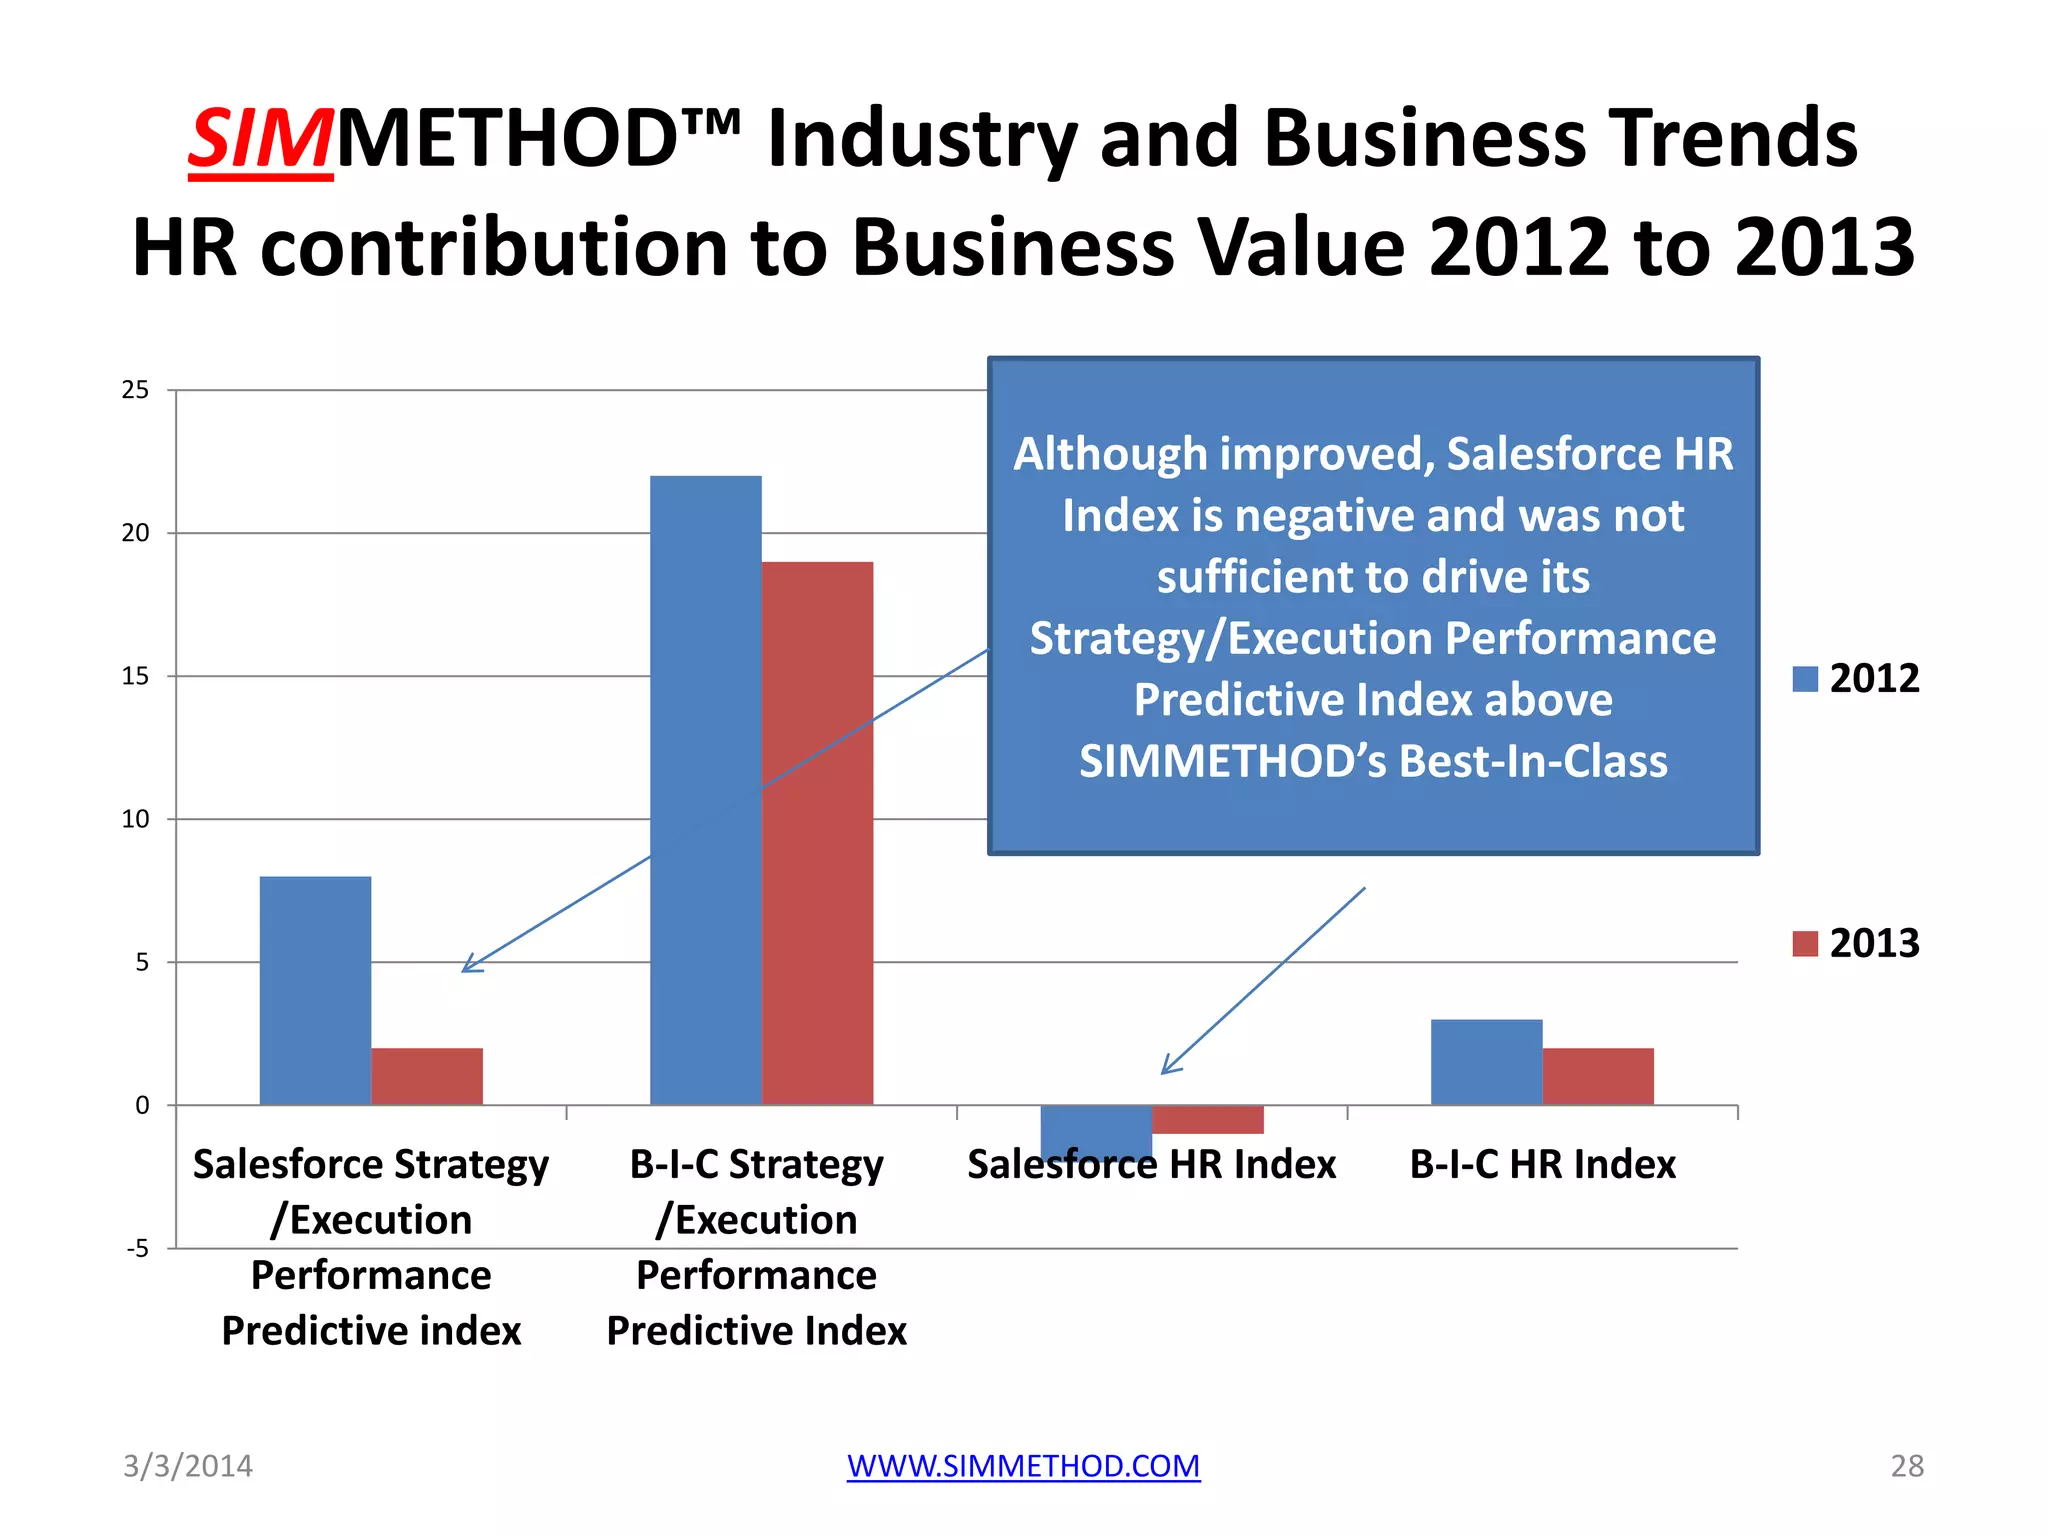
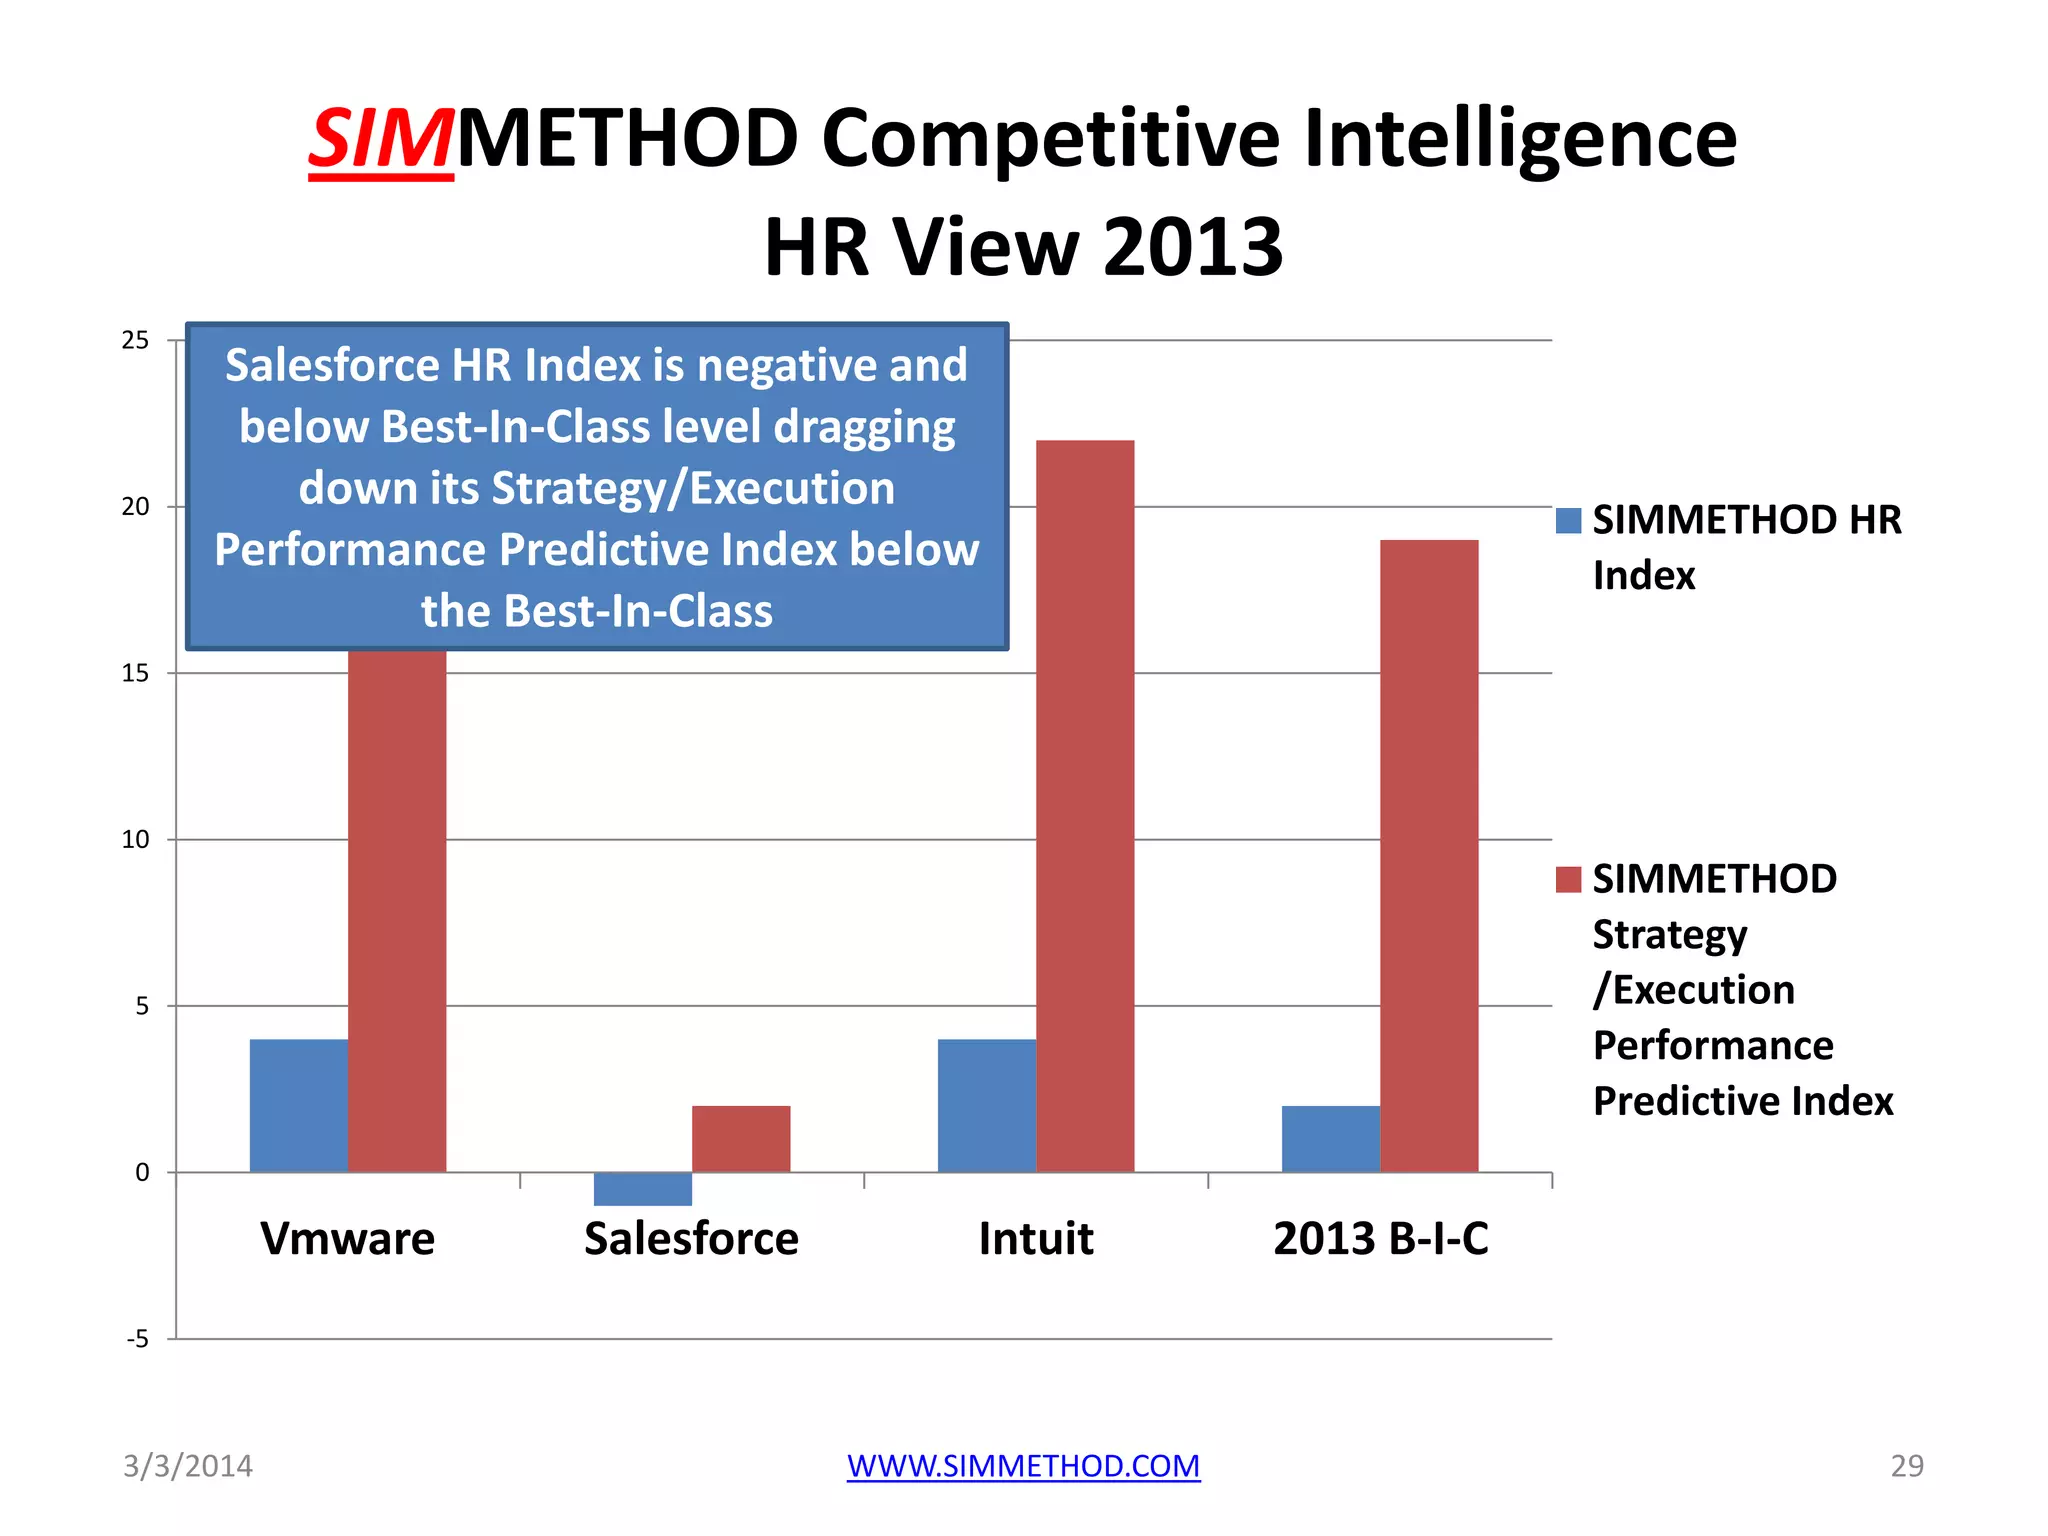
SIMMETHOD
A new way to measure and predict
your corporate risk and
performance
Was Salesforce Performance
Predictable?

3/3/2014

WWW.SIMMETHOD.COM

1
SIMMETHOD Strategy & Execution
Performance Predictive Index
On February 28, Seeking Alpha Trefis
Notes of the Day published the
following observations:
• “Steep Net Income Decline Despite Tax
Benefit Underlies Salesforce's Lopsided
Growth Strategy”
3/3/2014

WWW.SIMMETHOD.COM

2
SIMMETHOD Strategy & Execution
Performance Predictive Index
• “Margins for the company continued to
tread a downward trajectory as
operating expense grew even faster
than revenue for the third successive
year. Salesforce posted an GAAP
operating loss of $286 million for FY14,
which translates into a staggering -7%
operating profit margin”.
3/3/2014

WWW.SIMMETHOD.COM

3
SIMMETHOD Strategy & Execution
Performance Predictive Index
• “We expect to see continued erosion in
margins for Salesforce in the near term,
as competition intensifies within the
cloud enterprise software industry and
Salesforce’s increases its investments to
increase its lead over competitors”.

3/3/2014

WWW.SIMMETHOD.COM

4
SIMMETHOD Strategy & Execution
Performance Predictive Index
• “What’s more worrying is that
Salesforce’s loss before tax deductions
nearly tripled, increasing from a loss of
$128 million in the previous year to
$358 million in fiscal 2014”.

3/3/2014

WWW.SIMMETHOD.COM

5
SIMMETHOD

•

3/3/2014

Was Salesforce performance
predictable based on the
SIMMETHOD Strategy and
Execution Performance
Predictive Indices?
WWW.SIMMETHOD.COM

6
SIMMETHOD
Risk and Opportunity Alerts

3/3/2014

WWW.SIMMETHOD.COM

7
The Way We Measure Corporate
Performance Is Broken
Mervyns

Circuit City

Wachovia

Washington
Mutual

Borders

Blockbuster

3/3/2014

Why do
Businesses
fail?
WWW.SIMMETHOD.COM

Linen n’
Things

8
The CEO Lament in the Business
Analytics Market
• We did not see it coming. All my
Divisions and Product’s Analytics
pointed North while my Business
as a whole (in comparison to
new competitors and the BestIn-Class in multiple industries)
went South.
3/3/2014

WWW.SIMMETHOD.COM

9
Disrupting the Way We Measure
Corporate Risk and Performance
There are three main problems:
• The lack of a single industry-agnostic
scale to measure and predict corporate
strategy & execution (competitive
advantage) leads to erroneous and
inconsistent C-level visibility and
decision-making
3/3/2014

WWW.SIMMETHOD.COM

10
Disrupting the Way We Measure
Corporate Risk and Performance
• Silos-analytics and leading indicators
that lead to erroneous C-level decisions
based on many versions of the truth
unintegrated to business strategy and
objectives

3/3/2014

WWW.SIMMETHOD.COM

11
Disrupting the Way We Measure
Corporate Risk and Performance
• C-level risk and performance metrics
and ratios based on industrial-era
analytics that were not designed to
capture intangible values or the
dynamic relationships between
businesses and their value chains

3/3/2014

WWW.SIMMETHOD.COM

12
Silos Analytics Lead to Many Versions
of the Truth and Erroneous Decisions

3/3/2014

WWW.SIMMETHOD.COM

13
Lack of Business and Value-Chain
Leading Indicators and Risk Alerts
Maximum
Risk,
Minimum
Visibility

Company
view

InwardLooking
Analytics
3/3/2014

Value-Chain and Market
Leading Indicators and Risk
Alerts

SIMMETHOD™
industry view
indicators &
alerts

SIMMETHOD™
value-chain
view, leading
performance
indicators &
alerts

SIMMETHOD™
global market
view leading
risk/
performance
indicators &
alerts database

Minimum Risk and Maximum
Visibility
WWW.SIMMETHOD.COM

14
The Leading Indicators and Risk Alerts
of the Best-In-Class
Why do you need Industry Agnostic Leading
indicators and Risk/Opportunities Alerts?
• In an interdependent Market (like the Planets
in the solar system) your current and future
risk and performance are impacted by an
ecosystem of constantly changing
competitors coming from inside
and outside your Industry.
3/3/2014

WWW.SIMMETHOD.COM

15
Your Gap to SIMMETHOD’s Best-In-Class
Determines Your Risk and Performance
Gap to B-I-C in
your industry

Your original
targets against
SIMMETHOD
Database

Your current
position against
the B-I-C and
competitors

Gap to
Competitors in
a range of
industries

Gap to B-I-C in a
range of
industries
3/3/2014

WWW.SIMMETHOD.COM

16
SIMMETHOD’s Disclaimer
• The purpose of the SIMMETHOD
Strategy/Execution Performance Predictive
Index, Reports and Risk/Opportunities Alerts
is not to make a Business right or wrong but
rather contribute towards the understanding
of management actions in comparison to
industry peers and the SIMMETHOD Best-InClass.
3/3/2014

WWW.SIMMETHOD.COM

17
SIMMETHOD’s Disclaimer
• SIMMETHOD’s Strategy/Execution
Performance Predictive indices, metrics and
risk/opportunities alerts do not seek to be
exact but rather serve as a conduit to ask
better questions and seek better answers in
the performance improvement, risk
minimization and value creation journey.

3/3/2014

WWW.SIMMETHOD.COM

18
SIMMETHOD’s Disclaimer
• Sometimes, the value of a metric in itself
does not provide the greatest of insights, but
valuable actionable knowledge is gained
from its ability to provide a trend or a
common comparison yardstick with other
Businesses across a range of industries.

3/3/2014

WWW.SIMMETHOD.COM

19
SIMMETHOD’s Disclaimer
• This report is for informational purpose only
and SIMMETHOD shall not be liable for the
contents of the report or risk/opportunities
alerts or for any damage incurred or alleged
to be incurred to any of the Businesses
included in the Report as a result of its
content

3/3/2014

WWW.SIMMETHOD.COM

20
SIMMETHOD

•

3/3/2014

Was Salesforce performance
predictable based on the
SIMMETHOD Strategy and
Execution Performance
Predictive Indices?
WWW.SIMMETHOD.COM

21
SIMMETHOD’s C-Level Indices Business
Trends 2012-2013
Salesforce and the Best-In-Class

The following C-Level indices show Salesforce
ability to:
• Strategize and execute against the
SIMMETHOD Best-In-Class
• Compete against the Best-In-Class and
current and future competitors
and are leading indicators of future
performance and business risk
3/3/2014

WWW.SIMMETHOD.COM

22
SIMMETHOD’s C-Level Indices Business
Trends 2012-2013
Salesforce and the Best-In-Class

• When the Best-In-Class and your
SIMMETHOD C-Level indices are
moving in opposite directions your
ability to compete weakens in
proportion to your widening gap to
the Best-In-Class
3/3/2014

WWW.SIMMETHOD.COM

23
25

20

15

SIMMETHOD’s C-Level Indices Business
Trends 2012-2013
Salesforce and the Best-In-Class
Although Salesforce Value Creation Index is pointing North,
its Management Controllable Resources and Business
Model Indices against the Best-In-Class are pointing South
negatively impacting the Performance Predictive Index

10

salesforce
2012
Salesforce
2013
Average
2013 BIC

5

0

-5

-10

SIMMETHOD SIMMETHOD Value SIMMETHOD
Management
Creation Index
Minimum
Controllable
Company Business
Resources index
Model index

-15

SIMMETHOD
Strategy/
Execution
Performance
Predictive index

-20

3/3/2014

WWW.SIMMETHOD.COM

24
SIMMETHOD’s Business Trends Across the
Major Indices – 2012 to 2013
15

10

Areas where competitive advantage against the
Best-In-Class is being gained or lost

salesforce
2012

5

Salesforce
2013

0

-5

-10

-15

-20

3/3/2014

WWW.SIMMETHOD.COM

25
SIMMETHOD Industry and Business Trends
Sales and Marketing contribution to Business Value
2012 to 2013
25

Salesforce Sales Index negative
score highlights a reduced
contribution to business value
creation reflected on a below
Best-In-Class score for the
Strategy/Execution
Performance Predictive Index

20

15

10

2012

2013

5

0

-5

Salesforce Strategy
/Execution
Performance
Predictive index

B-I-C Strategy
/Execution
Performance
Predictive Index

Salesforce Sales
Index

B-I-C Sales Index

-10

3/3/2014

WWW.SIMMETHOD.COM

26
SIMMETHOD Competitive Intelligence
Sales and Marketing View
25

20

Salesforce underperforms the BestIn-Class in the Sales and
Strategy/Execution Performance
Predictive Index

SIMMETHOD
Sales Index

15

10

SIMMETHOD
Strategy
/Execution
Performance
Predictive Index

5

0

Vmware

Salesforce

Intuit

2013 B-I-C

-5

3/3/2014

WWW.SIMMETHOD.COM

27
SIMMETHOD™ Industry and Business Trends
HR contribution to Business Value 2012 to 2013
25

Although improved, Salesforce HR
Index is negative and was not
sufficient to drive its
Strategy/Execution Performance
Predictive Index above
SIMMETHOD’s Best-In-Class

20

15

2012

10

2013

5

0

-5

Salesforce Strategy
/Execution
Performance
Predictive index

3/3/2014

B-I-C Strategy
/Execution
Performance
Predictive Index

Salesforce HR Index

WWW.SIMMETHOD.COM

B-I-C HR Index

28
SIMMETHOD Competitive Intelligence
HR View 2013
25

20

Salesforce HR Index is negative and
below Best-In-Class level dragging
down its Strategy/Execution
Performance Predictive Index below
the Best-In-Class

SIMMETHOD HR
Index

15

10

SIMMETHOD
Strategy
/Execution
Performance
Predictive Index

5

0

Vmware

Salesforce

Intuit

2013 B-I-C

-5

3/3/2014

WWW.SIMMETHOD.COM

29
SIMMETHOD
Risk and Opportunities Alerts
• The SIMMETHOD algorithms review business
data and stockholders valuation-decisions
across business sectors and build industryagnostic indices in order to identify, measure,
correlate and predict your strengths,
weaknesses, risks and opportunities against
your current and potential future
competitors from inside or outside your
industry.
3/3/2014

WWW.SIMMETHOD.COM

30
SIMMETHOD
2014 Industry and Business Trends
• SIMMETHOD’s Strategy & Execution
Performance Predictive Indices and trends
are not deterministic. Businesses that act on
their leading indicators and risk alerts will
improve their 2014 performance as will be
shown in the forthcoming update of the
SIMMETHOD database, performance
predictive indices and correlations.
WWW.SIMMETHOD.COM
3/3/2014

31
SIMMETHOD
Risk and Opportunities Alerts
SIMMETHOD is in the top 1% of most
viewed in Slideshare and has been
“Hot” on LinkedIn, Twitter and
Facebook 46 times.

3/3/2014

WWW.SIMMETHOD.COM

32
Jorge Oscar Tabacman
jtabacman@gmail.com
Twitter ID: SIMMETHOD
SIMMETHOD
A New Way to Measure and Predict
the Risk and Performance of Your
Business and Alert You of New
Threats and Opportunities
3/3/2014

WWW.SIMMETHOD.COM

33

Salesforce case study

  • 1.
    SIMMETHOD A new wayto measure and predict your corporate risk and performance Was Salesforce Performance Predictable? 3/3/2014 WWW.SIMMETHOD.COM 1
  • 2.
    SIMMETHOD Strategy &Execution Performance Predictive Index On February 28, Seeking Alpha Trefis Notes of the Day published the following observations: • “Steep Net Income Decline Despite Tax Benefit Underlies Salesforce's Lopsided Growth Strategy” 3/3/2014 WWW.SIMMETHOD.COM 2
  • 3.
    SIMMETHOD Strategy &Execution Performance Predictive Index • “Margins for the company continued to tread a downward trajectory as operating expense grew even faster than revenue for the third successive year. Salesforce posted an GAAP operating loss of $286 million for FY14, which translates into a staggering -7% operating profit margin”. 3/3/2014 WWW.SIMMETHOD.COM 3
  • 4.
    SIMMETHOD Strategy &Execution Performance Predictive Index • “We expect to see continued erosion in margins for Salesforce in the near term, as competition intensifies within the cloud enterprise software industry and Salesforce’s increases its investments to increase its lead over competitors”. 3/3/2014 WWW.SIMMETHOD.COM 4
  • 5.
    SIMMETHOD Strategy &Execution Performance Predictive Index • “What’s more worrying is that Salesforce’s loss before tax deductions nearly tripled, increasing from a loss of $128 million in the previous year to $358 million in fiscal 2014”. 3/3/2014 WWW.SIMMETHOD.COM 5
  • 6.
    SIMMETHOD • 3/3/2014 Was Salesforce performance predictablebased on the SIMMETHOD Strategy and Execution Performance Predictive Indices? WWW.SIMMETHOD.COM 6
  • 7.
    SIMMETHOD Risk and OpportunityAlerts 3/3/2014 WWW.SIMMETHOD.COM 7
  • 8.
    The Way WeMeasure Corporate Performance Is Broken Mervyns Circuit City Wachovia Washington Mutual Borders Blockbuster 3/3/2014 Why do Businesses fail? WWW.SIMMETHOD.COM Linen n’ Things 8
  • 9.
    The CEO Lamentin the Business Analytics Market • We did not see it coming. All my Divisions and Product’s Analytics pointed North while my Business as a whole (in comparison to new competitors and the BestIn-Class in multiple industries) went South. 3/3/2014 WWW.SIMMETHOD.COM 9
  • 10.
    Disrupting the WayWe Measure Corporate Risk and Performance There are three main problems: • The lack of a single industry-agnostic scale to measure and predict corporate strategy & execution (competitive advantage) leads to erroneous and inconsistent C-level visibility and decision-making 3/3/2014 WWW.SIMMETHOD.COM 10
  • 11.
    Disrupting the WayWe Measure Corporate Risk and Performance • Silos-analytics and leading indicators that lead to erroneous C-level decisions based on many versions of the truth unintegrated to business strategy and objectives 3/3/2014 WWW.SIMMETHOD.COM 11
  • 12.
    Disrupting the WayWe Measure Corporate Risk and Performance • C-level risk and performance metrics and ratios based on industrial-era analytics that were not designed to capture intangible values or the dynamic relationships between businesses and their value chains 3/3/2014 WWW.SIMMETHOD.COM 12
  • 13.
    Silos Analytics Leadto Many Versions of the Truth and Erroneous Decisions 3/3/2014 WWW.SIMMETHOD.COM 13
  • 14.
    Lack of Businessand Value-Chain Leading Indicators and Risk Alerts Maximum Risk, Minimum Visibility Company view InwardLooking Analytics 3/3/2014 Value-Chain and Market Leading Indicators and Risk Alerts SIMMETHOD™ industry view indicators & alerts SIMMETHOD™ value-chain view, leading performance indicators & alerts SIMMETHOD™ global market view leading risk/ performance indicators & alerts database Minimum Risk and Maximum Visibility WWW.SIMMETHOD.COM 14
  • 15.
    The Leading Indicatorsand Risk Alerts of the Best-In-Class Why do you need Industry Agnostic Leading indicators and Risk/Opportunities Alerts? • In an interdependent Market (like the Planets in the solar system) your current and future risk and performance are impacted by an ecosystem of constantly changing competitors coming from inside and outside your Industry. 3/3/2014 WWW.SIMMETHOD.COM 15
  • 16.
    Your Gap toSIMMETHOD’s Best-In-Class Determines Your Risk and Performance Gap to B-I-C in your industry Your original targets against SIMMETHOD Database Your current position against the B-I-C and competitors Gap to Competitors in a range of industries Gap to B-I-C in a range of industries 3/3/2014 WWW.SIMMETHOD.COM 16
  • 17.
    SIMMETHOD’s Disclaimer • Thepurpose of the SIMMETHOD Strategy/Execution Performance Predictive Index, Reports and Risk/Opportunities Alerts is not to make a Business right or wrong but rather contribute towards the understanding of management actions in comparison to industry peers and the SIMMETHOD Best-InClass. 3/3/2014 WWW.SIMMETHOD.COM 17
  • 18.
    SIMMETHOD’s Disclaimer • SIMMETHOD’sStrategy/Execution Performance Predictive indices, metrics and risk/opportunities alerts do not seek to be exact but rather serve as a conduit to ask better questions and seek better answers in the performance improvement, risk minimization and value creation journey. 3/3/2014 WWW.SIMMETHOD.COM 18
  • 19.
    SIMMETHOD’s Disclaimer • Sometimes,the value of a metric in itself does not provide the greatest of insights, but valuable actionable knowledge is gained from its ability to provide a trend or a common comparison yardstick with other Businesses across a range of industries. 3/3/2014 WWW.SIMMETHOD.COM 19
  • 20.
    SIMMETHOD’s Disclaimer • Thisreport is for informational purpose only and SIMMETHOD shall not be liable for the contents of the report or risk/opportunities alerts or for any damage incurred or alleged to be incurred to any of the Businesses included in the Report as a result of its content 3/3/2014 WWW.SIMMETHOD.COM 20
  • 21.
    SIMMETHOD • 3/3/2014 Was Salesforce performance predictablebased on the SIMMETHOD Strategy and Execution Performance Predictive Indices? WWW.SIMMETHOD.COM 21
  • 22.
    SIMMETHOD’s C-Level IndicesBusiness Trends 2012-2013 Salesforce and the Best-In-Class The following C-Level indices show Salesforce ability to: • Strategize and execute against the SIMMETHOD Best-In-Class • Compete against the Best-In-Class and current and future competitors and are leading indicators of future performance and business risk 3/3/2014 WWW.SIMMETHOD.COM 22
  • 23.
    SIMMETHOD’s C-Level IndicesBusiness Trends 2012-2013 Salesforce and the Best-In-Class • When the Best-In-Class and your SIMMETHOD C-Level indices are moving in opposite directions your ability to compete weakens in proportion to your widening gap to the Best-In-Class 3/3/2014 WWW.SIMMETHOD.COM 23
  • 24.
    25 20 15 SIMMETHOD’s C-Level IndicesBusiness Trends 2012-2013 Salesforce and the Best-In-Class Although Salesforce Value Creation Index is pointing North, its Management Controllable Resources and Business Model Indices against the Best-In-Class are pointing South negatively impacting the Performance Predictive Index 10 salesforce 2012 Salesforce 2013 Average 2013 BIC 5 0 -5 -10 SIMMETHOD SIMMETHOD Value SIMMETHOD Management Creation Index Minimum Controllable Company Business Resources index Model index -15 SIMMETHOD Strategy/ Execution Performance Predictive index -20 3/3/2014 WWW.SIMMETHOD.COM 24
  • 25.
    SIMMETHOD’s Business TrendsAcross the Major Indices – 2012 to 2013 15 10 Areas where competitive advantage against the Best-In-Class is being gained or lost salesforce 2012 5 Salesforce 2013 0 -5 -10 -15 -20 3/3/2014 WWW.SIMMETHOD.COM 25
  • 26.
    SIMMETHOD Industry andBusiness Trends Sales and Marketing contribution to Business Value 2012 to 2013 25 Salesforce Sales Index negative score highlights a reduced contribution to business value creation reflected on a below Best-In-Class score for the Strategy/Execution Performance Predictive Index 20 15 10 2012 2013 5 0 -5 Salesforce Strategy /Execution Performance Predictive index B-I-C Strategy /Execution Performance Predictive Index Salesforce Sales Index B-I-C Sales Index -10 3/3/2014 WWW.SIMMETHOD.COM 26
  • 27.
    SIMMETHOD Competitive Intelligence Salesand Marketing View 25 20 Salesforce underperforms the BestIn-Class in the Sales and Strategy/Execution Performance Predictive Index SIMMETHOD Sales Index 15 10 SIMMETHOD Strategy /Execution Performance Predictive Index 5 0 Vmware Salesforce Intuit 2013 B-I-C -5 3/3/2014 WWW.SIMMETHOD.COM 27
  • 28.
    SIMMETHOD™ Industry andBusiness Trends HR contribution to Business Value 2012 to 2013 25 Although improved, Salesforce HR Index is negative and was not sufficient to drive its Strategy/Execution Performance Predictive Index above SIMMETHOD’s Best-In-Class 20 15 2012 10 2013 5 0 -5 Salesforce Strategy /Execution Performance Predictive index 3/3/2014 B-I-C Strategy /Execution Performance Predictive Index Salesforce HR Index WWW.SIMMETHOD.COM B-I-C HR Index 28
  • 29.
    SIMMETHOD Competitive Intelligence HRView 2013 25 20 Salesforce HR Index is negative and below Best-In-Class level dragging down its Strategy/Execution Performance Predictive Index below the Best-In-Class SIMMETHOD HR Index 15 10 SIMMETHOD Strategy /Execution Performance Predictive Index 5 0 Vmware Salesforce Intuit 2013 B-I-C -5 3/3/2014 WWW.SIMMETHOD.COM 29
  • 30.
    SIMMETHOD Risk and OpportunitiesAlerts • The SIMMETHOD algorithms review business data and stockholders valuation-decisions across business sectors and build industryagnostic indices in order to identify, measure, correlate and predict your strengths, weaknesses, risks and opportunities against your current and potential future competitors from inside or outside your industry. 3/3/2014 WWW.SIMMETHOD.COM 30
  • 31.
    SIMMETHOD 2014 Industry andBusiness Trends • SIMMETHOD’s Strategy & Execution Performance Predictive Indices and trends are not deterministic. Businesses that act on their leading indicators and risk alerts will improve their 2014 performance as will be shown in the forthcoming update of the SIMMETHOD database, performance predictive indices and correlations. WWW.SIMMETHOD.COM 3/3/2014 31
  • 32.
    SIMMETHOD Risk and OpportunitiesAlerts SIMMETHOD is in the top 1% of most viewed in Slideshare and has been “Hot” on LinkedIn, Twitter and Facebook 46 times. 3/3/2014 WWW.SIMMETHOD.COM 32
  • 33.
    Jorge Oscar Tabacman jtabacman@gmail.com TwitterID: SIMMETHOD SIMMETHOD A New Way to Measure and Predict the Risk and Performance of Your Business and Alert You of New Threats and Opportunities 3/3/2014 WWW.SIMMETHOD.COM 33