SlideShare a Scribd company logo
1 of 64
SIMMETHOD Crowd Competitive Intelligence, C-Level Analytics and Risk Alerts 
AMAZON 
Best In Class Or Laggard? 
It all depends on the color of your metrics! 
10/28/2014 
1 
WWW.SIMMETHOD.BLOGSPOT.COM
SIMMETHOD 
C-level Risk And Opportunity Alerts 
10/28/2014 WWW.SIMMETHOD.BLOGSPOT.COM 2
The Market Has Opposing Views On Amazon 
“Investors aren’t buying the Amazon fairy-tale anymore” reported Business Insider on 10/25/2014 
“Part of Amazon.com’s core is dying” reported Paul Santos in Seeking Alpha 
10/28/2014 
WWW.SIMMETHOD.BLOGSPOT.COM 
3
The Market Has Opposing Views On Amazon 
“Amazon Fire Sale: Down 7% on Q3 Miss. Q4 View: Two Downgrades, Price Targets Slashed” reported Barron’s on October 24 
10/28/2014 
WWW.SIMMETHOD.BLOGSPOT.COM 
4
The Market Has Opposing Views On Amazon 
“No One Wants To Hear Anything Good About Amazon, But… 
“Break out Amazon’s tech revenues from merchandise sales and the stock is at industry multiples” 
“This company is still growing at 20% per year and the stock is thus dirt-cheap” wrote Dana Blankenhorn on Seeking Alpha 
10/28/2014 
WWW.SIMMETHOD.BLOGSPOT.COM 
5
2013 To 2014 Performance Trend 
•How do The Barron’s 500 (2013 to 2014) trend compare to the SIMMETHOD Strategy & Execution Performance Predictive Index trend? 
10/28/2014 
WWW.SIMMETHOD.BLOGSPOT.COM 
6
2013 To 2014 Performance Trend 
Name 
Barron’s 500 
SIMMETHOD Strategy & Execution Performance Predictive Index 
eBay 
↑ 
↑ 
Cognizant 
↓ 
↑ 
IBM 
↓ 
↓ 
Fidelity National Information 
↓ 
↓ 
Amazon 
↑ 
↓ 
Google 
↑ 
↑ 
Priceline 
↑ 
↑ 
Facebook 
↓ 
↑ 
Microsoft 
↑ 
↑ 
10/28/2014 
WWW.SIMMETHOD.BLOGSPOT.COM 
7
Barron’s 500 Ranking Algorithm 
•“Median three-year cash-flow-based ROI, 
•One-year change in that measure relative to the three-year median and 
•Adjusted sales growth in the last fiscal year” 
10/28/2014 
WWW.SIMMETHOD.BLOGSPOT.COM 
8
SIMMETHOD and The Barron’s 500 
There is a main reasons why The Barron’s 500 and the SIMMETHOD Index arrive to two different results such as in Amazon’s case: 
•SIMMETHOD is a holistic (context based) risk & performance index covering a larger number of financial and operational metrics blended with crowd-sourced analytics relative to the Best In Class in a League Table 
10/28/2014 
WWW.SIMMETHOD.BLOGSPOT.COM 
9
The Way We Measure Corporate Risk and Performance Is Broken 
Why do Businesses fail or fail to perform? 
Blockbuster 
Borders 
Circuit City 
Mervyns 
Wachovia Washington Mutual 
Linen n’ Things 
10/28/2014 
10 
WWW.SIMMETHOD.BLOGSPOT.COM
SIMMETHOD Strategy & Execution 
Performance Predictive Index 
10/28/2014 WWW.SIMMETHOD.BLOGSPOT.COM 11 
How to holistically 
measure your 
strategy & execution 
and your 
competitive 
advantage?
The SIMMETHOD Algorithms and the 7 Laws of Growth and Value Creation 
SIMMETHOD 7 Laws 
Integration/alignment 
Crowd analytics inside/outside your industry 
Growth & value creation 
Resource contribution to objectives C-level Predictive performance & risk 
Averages & positive trends 
Minimum company /business model 
10/28/2014 
WWW.SIMMETHOD.BLOGSPOT.COM 
12
SIMMETHOD 
•SIMMETHOD’s Strategy & Execution Performance Predictive Index Business League Table 
10/28/2014 
WWW.SIMMETHOD.BLOGSPOT.COM 
13
SIMMETHOD’s Technology League Table Top 25% Vs. Bottom 25% 
The top 25% of the SIMMETHOD Technology League Table on average 
Delivers 3x more profit and 
Creates 3x more value with 
30% less sales 
10/28/2014 
14 
WWW.SIMMETHOD.BLOGSPOT.COM
SIMMETHOD’s Technology League Table Top 25% Vs. Bottom 25% 
To generate $1 of profit need to sell $4 
To generate $1 of profit need to sell $19 
10/28/2014 
15 
WWW.SIMMETHOD.BLOGSPOT.COM
SIMMETHOD’s Technology League Table Top 25% Vs. Bottom 25% 
Every $1 of sales creates $5 of business value 
Every $1 of sales creates $1.2 of business value 
10/28/2014 
16 
WWW.SIMMETHOD.BLOGSPOT.COM
SIMMETHOD Strategy and Execution Performance Predictive Index 
•What is Amazon’s position within the 2014 SIMMETHOD Strategy & Execution Performance Predictive Index Business League Table? 
10/28/2014 
17 
WWW.SIMMETHOD.BLOGSPOT.COM
SIMMETHOD’s C-Level Trends 2012-2014 Amazon and the Best-In-Class 
The following C-Level indices show Amazon’s ability to: 
•Strategize and execute against the SIMMETHOD Best-In-Class, 
•Compete against the Best-In-Class, current and future competitors 
and are leading indicators of future business opportunities, risk and performance. 
10/28/2014 
18 
WWW.SIMMETHOD.BLOGSPOT.COM
SIMMETHOD Strategy & Execution Performance Predictive Index 
0 
10 
20 
30 
40 
50 
60 
70 
80 
SIMMETHOD Management Controllable Resources Index 
SIMMETHOD Strategy & Execution Performance Predictive Index 
10/28/2014 
19 
WWW.SIMMETHOD.BLOGSPOT.COM
SIMMETHOD Strategy & Execution Performance Predictive Index 
-10 
-5 
0 
5 
10 
15 
20 
25 
30 
35 
SIMMETHOD Management Controllable Resources Index 
SIMMETHOD Strategy & Execution Performance Predictive Index 
10/28/2014 
20 
WWW.SIMMETHOD.BLOGSPOT.COM
SIMMETHOD Strategy & Execution Performance Predictive Index 
-30 
-25 
-20 
-15 
-10 
-5 
0 SIMMETHOD Management Controllable Resources Index 
SIMMETHOD Strategy & Execution Performance Predictive Index 
10/28/2014 
21 
WWW.SIMMETHOD.BLOGSPOT.COM 
SIMMETHOD’s crowd-sourced analytics and algorithms have placed Amazon’s Strategy & Execution Performance Predictive Index at the top of the 3rd quartile of the SIMMETHOD Technology Business League Table
SIMMETHOD Strategy & Execution Performance Predictive Index 
-60 
-50 
-40 
-30 
-20 
-10 
0 
AT&T 
Atos 
Thomas Cook 
Adecco 
Grupo Televisa 
Fidelity National … 
Computer Sciences 
Sodexco 
Verizon comm 
American Express 
Time Warner Cable 
Compal Elecronics 
HP 
Expedia 
Capgemini 
Comcast 
Liberty interactive 
Telefonica 
Verisk Analytics 
Cablevision 
Centurylink 
Innolux 
SIMMETHOD Management Controllable Resources Index 
SIMMETHOD Strategy & Execution Performance Predictive Index 
10/28/2014 
22 
WWW.SIMMETHOD.BLOGSPOT.COM
SIMMETHOD 
•SIMMETHOD Crowd-Sourced Competitive Intelligence Analytics 
10/28/2014 
WWW.SIMMETHOD.BLOGSPOT.COM 
23
SIMMETHOD Crowd Competitive Intelligence 
It shows your strengths and weaknesses at the enterprise (rather than the product) level and Your ability to compete with existing businesses and potential new competitors with new business models, cost structures, processes, distribution channels and products. 
10/28/2014 
24 
WWW.SIMMETHOD.BLOGSPOT.COM
SIMMETHOD Competitive Intelligence Trend Vs. Peers And Best-In-Class 
10/28/2014 
25 
WWW.SIMMETHOD.BLOGSPOT.COM 
-10 
0 
10 
20 
30 
40 
50 
60 
70 
Average B-I-C SIMMETHOD Strategy & Execution Performance Predictive Index 
Apple SIMMETHOD Strategy & Execution Performance Predictive index 
Google SIMMETHOD Strategy & Execution Performance Predictive index 
Microsoft SIMMETHOD Strategy & Execution Performance Predictive index 
IBM SIMMETHOD Strategy & Execution Performance Predictive Index 
Amazon SIMMETHOD Strategy & Execution Performance Predictive index 
Yahoo SIMMETHOD Strategy & Execution Performance Predictive Index 
2014 
2013 2012 
The crowd sourced analytics trend shows Amazon’s increasing risk vs. peers & B-I-C
SIMMETHOD Competitive Intelligence Trend Vs. Peers And Best-In-Class 
10/28/2014 
WWW.SIMMETHOD.BLOGSPOT.COM 
26 
-10 
-5 
0 
5 
10 
15 
20 
25 
30 
35 
40 
45 
Avg. B-I-C SIMMETHOD Management Controllable Resources Index 
Apple SIMMETHOD Management Controllable Resources index 
Google SIMMETHOD Management Controllable Resources index 
Microsoft SIMMETHOD Management Controllable Resources index 
IBM SIMMETHOD Management Controllable Resources Index 
Amazon SIMMETHOD Management Controllable Resources Index 
Yahoo SIMMETHOD Management Controllable Resources Index 2014 
2013 
2012 SIMMETHOD’s crowd analytics shows that Amazon is not leveraging resources at B-I-C level and the trend is negative
SIMMETHOD Competitive Intelligence Trend Vs. Peers And Best-In-Class 
10/28/2014 
WWW.SIMMETHOD.BLOGSPOT.COM 
27 
-5 
0 5 
10 
15 
20 
25 
30 
Avg. B-I-C SIMMETHOD Value Creation Index 
Apple SIMMETHOD Value Creation Index 
Google SIMMETHOD Value Creation Index 
Microsoft SIMMETHOD Value Creation Index 
IBM SIMMETHOD Value Creation Index 
Amazon SIMMETHOD Value Creation Index 
Yahoo SIMMETHOD Value Creation Index 
2014 
2013 2012 SIMMETHOD’s crowd sourced analytics shows that Amazon’s Value Creation Index is not competitive vs. B-I-C
SIMMETHOD 2014 Competitive Intelligence Across Major Indices 
10/28/2014 WWW.SIMMETHOD.BLOGSPOT.COM 
28 
-20 
-10 
0 
10 
20 
30 
40 
50 
60 
70 
Apple 
Facebook 
Yahoo 
Google Amazon 
Aveg. B-I-C 
B-I-C SIMMETHOD Minimum Company Business Model Index 
B-I-C SIMMETHOD Value Creation Index 
B-I-C SIMMETHOD Management Controllable Resources Index 
B-I-C SIMMETHOD Strategy/ Execution Performance Predictive Index 
Measuring with absolute data such as “sales growth” does not always reveal the true picture
SIMMETHOD 2014 Competitive Intelligence Across Major Indices 
10/28/2014 
WWW.SIMMETHOD.BLOGSPOT.COM 
29 
-20 
-10 
0 
10 
20 
30 
40 
50 
60 
70 
Apple 
Facebook 
Yahoo 
Google 
Amazon 
Aveg. B-I-C 
B-I-C SIMMETHOD Strategy/ Execution Performance Predictive Index 
B-I-C SIMMETHOD Management Controllable Resources Index B-I-C SIMMETHOD Value Creation Index 
B-I-C SIMMETHOD Minimum Company Business Model Index 
Amazon’s competitive gap to the SIMMETHOD Best In Class
SIMMETHOD 
•Amazon’s 2012 to 2014 Trends And Competitive Advantage Across The SIMMETHOD Indices 
10/28/2014 
WWW.SIMMETHOD.BLOGSPOT.COM 
30
SIMMETHOD Strategy & Execution Performance Predictive Index 
Amazon’s 2012 to 2014 trend across the indices of the SIMMETHOD Best In Class showing: 
•Competitive strengths, 
•Competitive weaknesses, 
•Industry agnostic Risk alerts and 
•Opportunities for improvement in order to become Best In Class across a range of industries and fend off current and future competitors 
10/28/2014 
31 
WWW.SIMMETHOD.BLOGSPOT.COM
SIMMETHOD 2012 to 2014 Business and Industry Trends 
10/28/2014 
WWW.SIMMETHOD.BLOGSPOT.COM 
32 
-15 
-10 
-5 
0 
5 
10 
15 
Amazon 2012 
Amazon 2013 
Amazon 2014 Although absolute sales metrics are growing, the SIMMETHOD Sales and Strategy/Execution Indices are not
SIMMETHOD 2012 to 2014 Business and Industry Trends 
10/28/2014 
WWW.SIMMETHOD.BLOGSPOT.COM 
33 
-15 
-10 
-5 
0 
5 
10 
15 
Amazon 2012 
Amazon 2013 
Amazon 2014 
SIMMETHOD’s crowd sourced analytics shows that Amazon’s competitive advantage trend is negative vs. peers and SIMMETHOD’s Best in Class
SIMMETHOD Your trend versus the SIMMETHOD Best In Class 
Your level of risk increases if and when: 
•Your data (such as Amazon’s sales) points North and your SIMMETHOD indices point South, or 
•The gap between your indices and the SIMMETHOD Best In Class indices is widening, or 
•Your SIMMETHOD composite indices are not supported by your management controllable or operational indices. 
10/28/2014 
WWW.SIMMETHOD.BLOGSPOT.COM 
34
SIMMETHOD’s C-Level Trends 2012-2014 Amazon and the Best-In-Class 
•When the Best-In-Class and your SIMMETHOD C-Level indices are moving in opposite directions, your ability to compete weakens in proportion to your widening gap to the Best-In-Class. 
10/28/2014 
WWW.SIMMETHOD.BLOGSPOT.COM 
35
SIMMETHOD Trends against the SIMMETHOD Best In Class 
10/28/2014 
WWW.SIMMETHOD.BLOGSPOT.COM 
36 
-10 
-5 
0 
5 
10 
15 
20 
25 
30 
35 
2012 
2013 
2014 
Average B-I-C SIMMETHOD Strategy/ Execution Performance Predictive Index 
Amazon SIMMETHOD Strategy/ Execution Performance Predictive index Is there a measurable & predictive trend developing?
SIMMETHOD Trends against the SIMMETHOD Best In Class 
10/28/2014 
WWW.SIMMETHOD.BLOGSPOT.COM 
37 
-2 
0 
2 
4 
6 
8 
10 
12 
14 
16 
2012 
2013 
2014 
Avg. B-I-C SIMMETHOD Management Controllable Resources Index Amazon SIMMETHOD Management Controllable Resources Index 
SIMMETHOD found a correlation between the resource management index and value creation
SIMMETHOD Trends against the SIMMETHOD Best In Class 
10/28/2014 
WWW.SIMMETHOD.BLOGSPOT.COM 
38 
-5 
0 
5 
10 
15 
20 
2012 
2013 
2014 
Avg. B-I-C SIMMETHOD Value Creation Index Amazon SIMMETHOD Value Creation Index
SIMMETHOD Trends against the SIMMETHOD Best In Class 
10/28/2014 
WWW.SIMMETHOD.BLOGSPOT.COM 
39 0 1 
2 
3 
4 
5 
6 
7 
2012 
2013 
2014 
Avg. B-I-C SIMMETHOD Cash/Debt Index 
Amazon SIMMETHOD Cash/ Debt Index
SIMMETHOD Trends against the SIMMETHOD Best In Class 
10/28/2014 
WWW.SIMMETHOD.BLOGSPOT.COM 
40 
0 
0.5 
1 
1.5 
2 2.5 
2012 
2013 
2014 
Avg. B-I-C SIMMETHOD Sales Index 
Amazon SIMMETHOD Sales Index
SIMMETHOD Trends against the SIMMETHOD Best In Class 
10/28/2014 
WWW.SIMMETHOD.BLOGSPOT.COM 
41 
-5 
-4 
-3 
-2 
-1 
0 
1 2 
3 
2012 
2013 
2014 
Avg. B-I-C Overheads Index 
Amazon SIMMETHOD Overheads Index
SIMMETHOD Trends against the SIMMETHOD Best In Class 
10/28/2014 
WWW.SIMMETHOD.BLOGSPOT.COM 
42 
0 
1 
2 
3 
4 
5 
6 
2012 2013 
2014 
Avg. B-I-C SIMMETHOD HR Index 
Amazon SIMMETHOD HR Index
SIMMETHOD Trends against the SIMMETHOD Best In Class 
•In summary, most SIMMETHOD indices show a widening negative gap vs. the SIMMETHOD Best In Class average highlighting Amazon’s increased competitive risk vs. peers and the Best In Class in the Technology League Table 
10/28/2014 
WWW.SIMMETHOD.BLOGSPOT.COM 
43
SIMMETHOD Best In Class and Risk Profiles 
•SIMMETHOD Best In Class analytical profiles and risk alerts provide you and your C-level with a large number of levers to improve your performance and reduce your risk 
10/28/2014 
WWW.SIMMETHOD.BLOGSPOT.COM 
44
Amazon 2013-2014 Gap to the SIMMETHOD Best In Class Profiles 
•Are Amazon’s gaps to the SIMMETHOD Best In Class and risk profiles narrowing or widening and are they aligned to their indices? 
10/28/2014 
WWW.SIMMETHOD.BLOGSPOT.COM 
45
Is there a disconnect between your SIMMETHOD indices and your gap to the Best In Class profile? 
•When your SIMMETHOD indices are trending up and your gap to the SIMMETHOD Best In Class and risk profile is negatively widening, your C- Level sensors are presenting you with specific risk and opportunity alerts. Why? 
10/28/2014 
WWW.SIMMETHOD.BLOGSPOT.COM 
46
Is there a disconnect between your SIMMETHOD indices and your gap to the Best In Class profile? 
Unlike your SIMMETHOD indices that holistically measure your strategy/execution or competitive position within a business league table, your gap to the Best In Class profiles provides: A specific C-Level ratio by ratio path to a moving Best In Class performance and risk management profile database or your pre-established targets Risk and opportunities alerts that can be acted upon to reduce the gap to the Best In Class, improve your performance , competitive advantage and reduce your risk level 
10/28/2014 
WWW.SIMMETHOD.BLOGSPOT.COM 
47
Amazon and the SIMMETHOD 2014 Best In Class Profile SIMMETHOD’s 2014 B-I-C average profit per employee is 52x higher than Amazon 
10/28/2014 
WWW.SIMMETHOD.BLOGSPOT.COM 
48
Amazon and the SIMMETHOD 2013 Best In Class Profile SIMMETHOD’s 2013 B-I-C average value per employee is 1.8x higher than Amazon 
10/28/2014 
WWW.SIMMETHOD.BLOGSPOT.COM 
49
Amazon and the SIMMETHOD 2014 Best In Class Profile SIMMETHOD’s 2014 B-I-C average value per employee is 2.8x higher than Amazon 10/28/2014 
WWW.SIMMETHOD.BLOGSPOT.COM 
50
Amazon and the SIMMETHOD 2013 Best In Class Profile 
SIMMETHOD’s 2013 B-I-C average sales per employee are 1.5x higher than Amazon 
10/28/2014 
WWW.SIMMETHOD.BLOGSPOT.COM 
51
Amazon and the SIMMETHOD 2014 Best In Class Profile 
Amazon’s sales per employee are 1.2x higher than the SIMMETHOD’s 2014 B-I-C average 
10/28/2014 
WWW.SIMMETHOD.BLOGSPOT.COM 
52
Amazon and the SIMMETHOD 2013 Best In Class Profile 
Amazon’s needs $1.1x more cash than the SIMMETHOD 2013 B-I-C to generate $1/value 
10/28/2014 WWW.SIMMETHOD.BLOGSPOT.COM 
53
Amazon and the SIMMETHOD 2014 Best In Class Profile 
Amazon needs 2x more cash than the SIMMETHOD 2014 B-I-C to create $1/value 
10/28/2014 
WWW.SIMMETHOD.BLOGSPOT.COM 
54
Your gap to the SIMMETHOD Best In Class profiles determines your results 
According to the SIMMETHOD crowd sourced analytics and in comparison to the SIMMETHOD Best In Class profiles: 
Amazon’s 2014 sales per employee are above B-I-C levels, Profit and value per employee are decreasing and 
To generate $1 of business value, Amazon requires double the cash of the Best In Class 
10/28/2014 
WWW.SIMMETHOD.BLOGSPOT.COM 
55
Your gap to the SIMMETHOD Best In Class profiles determines your results Amazon’s risk level is increasing for the following reasons: 
There is a disconnect between the Management Controllable Resources Index that represents the levers of value creation under management control and Amazon value creation index 
Most of Amazon’s SIMMETHOD indices are trending down and the gap to the Best In Class is widening 
The SIMMETHOD Best In Class are improving at a faster rate than Amazon. 
10/28/2014 
WWW.SIMMETHOD.BLOGSPOT.COM 
56
Amazon 2014 SIMMETHOD Risk and Performance Summary 
Index 
Value 
Index trend 
Index trend 
vs. B-I-C 
Gap to B-I-C & risk profile ratios 
7 Laws compliance 
Sales 
+ 
= 
- 
+ 
- 
Overheads 
- 
- 
- 
- 
HR 
+ 
- 
- 
- 
- 
Cash/Debt 
+ 
- 
- 
- 
- 
Management Controllable Resources 
- 
- 
- 
- 
Minimum Company Business Model 
- 
- 
- 
- 
Value Creation 
- 
- 
- 
- 
- 
Strategy/execution Performance Predictive 
- 
- 
- 
- 
10/28/2014 
WWW.SIMMETHOD.BLOGSPOT.COM 
57
SIMMETHOD’s Disclaimer 
•The purpose of the SIMMETHOD Strategy & Execution Performance Predictive Index and risk and opportunities alerts is not to make a business right or wrong but rather contribute towards the understanding of management actions in comparison to industry’s peers and the SIMMETHOD Best In Class. 
10/28/2014 
WWW.SIMMETHOD.BLOGSPOT.COM 
58
SIMMETHOD’s Disclaimer 
•SIMMETHOD’s Strategy & Execution Performance Predictive Index and risk and opportunities alerts do not seek to be exact but rather serve as a conduit to ask better questions and seek better answers in the performance improvement, risk minimization and value creation journey. 
10/28/2014 
WWW.SIMMETHOD.BLOGSPOT.COM 
59
SIMMETHOD’s Disclaimer 
•Sometimes, the value of a metric in itself does not provide the greatest of insights, but valuable actionable knowledge is gained from its ability to provide a trend or a common comparison yardstick with other businesses across a range of industries. 
10/28/2014 
WWW.SIMMETHOD.BLOGSPOT.COM 
60
SIMMETHOD’s Disclaimer 
•This Presentation is for informational purpose only and SIMMETHOD shall not be liable for the contents of the Presentation or for any damage incurred or alleged to be incurred to any of the businesses included in the Presentation as a result of its content. 
10/28/2014 
WWW.SIMMETHOD.BLOGSPOT.COM 
61
SIMMETHOD Strategy & Execution Performance Predictive Index 
In summary, are the: 
•Strategy & Execution Performance Predictive Indices, 
•Best In Class profiles, 
•Risk and opportunity alerts and 
•7 Laws of Growth and Value Creation good leading indicators of Amazon’s threats, opportunities, risk and performance? 
10/28/2014 
WWW.SIMMETHOD.BLOGSPOT.COM 
62
SIMMETHOD Risk and Opportunities Alerts 
SIMMETHOD is in the top 1% of most viewed on Slideshare and has been “Hot” on LinkedIn, Twitter and Facebook 50 times. 
10/28/2014 
WWW.SIMMETHOD.BLOGSPOT.COM 
63
Jorge Oscar Tabacman jtabacman@gmail.com Twitter ID: SIMMETHOD 
SIMMETHOD A new way to measure and predict the risk and performance of your business and alert you of new threats and opportunities 10/28/2014 64 
WWW.SIMMETHOD.BLOGSPOT.COM

More Related Content

Similar to The crowd sourced analytics of the technology best in class

Similar to The crowd sourced analytics of the technology best in class (20)

VMware and Cisco 2014, crowd competitive intelligence, clevel analytics and r...
VMware and Cisco 2014, crowd competitive intelligence, clevel analytics and r...VMware and Cisco 2014, crowd competitive intelligence, clevel analytics and r...
VMware and Cisco 2014, crowd competitive intelligence, clevel analytics and r...
 
Sap 2014, crowd competitive intelligence, clevel analytics and risk alerts
Sap 2014, crowd competitive intelligence, clevel analytics and risk alertsSap 2014, crowd competitive intelligence, clevel analytics and risk alerts
Sap 2014, crowd competitive intelligence, clevel analytics and risk alerts
 
LinkedIn Challenges and Road-Map to 2014 Best In Class Performance
LinkedIn Challenges and Road-Map to 2014 Best In Class PerformanceLinkedIn Challenges and Road-Map to 2014 Best In Class Performance
LinkedIn Challenges and Road-Map to 2014 Best In Class Performance
 
Simmethod measuring and predicting alibaba, amazon and e bay risk and perform...
Simmethod measuring and predicting alibaba, amazon and e bay risk and perform...Simmethod measuring and predicting alibaba, amazon and e bay risk and perform...
Simmethod measuring and predicting alibaba, amazon and e bay risk and perform...
 
Oracle 2014 Case Study: From real time analytics to self correcting business ...
Oracle 2014 Case Study: From real time analytics to self correcting business ...Oracle 2014 Case Study: From real time analytics to self correcting business ...
Oracle 2014 Case Study: From real time analytics to self correcting business ...
 
Yahoo, crowd competitive intelligence, clevel analytics and risk alerts, 2015
Yahoo, crowd competitive intelligence, clevel analytics and risk alerts, 2015Yahoo, crowd competitive intelligence, clevel analytics and risk alerts, 2015
Yahoo, crowd competitive intelligence, clevel analytics and risk alerts, 2015
 
Amazon versus walMart and the simmethod best in class
Amazon versus walMart and the simmethod best in classAmazon versus walMart and the simmethod best in class
Amazon versus walMart and the simmethod best in class
 
Simmethod From Software As A Service To Outcomes As A Service, Twitter and Ya...
Simmethod From Software As A Service To Outcomes As A Service, Twitter and Ya...Simmethod From Software As A Service To Outcomes As A Service, Twitter and Ya...
Simmethod From Software As A Service To Outcomes As A Service, Twitter and Ya...
 
Simmethod, ibm and teradata predictive risk and performance research
Simmethod, ibm and teradata predictive risk and performance researchSimmethod, ibm and teradata predictive risk and performance research
Simmethod, ibm and teradata predictive risk and performance research
 
Teradata 2014, from predictive analytics to best in class self correcting cro...
Teradata 2014, from predictive analytics to best in class self correcting cro...Teradata 2014, from predictive analytics to best in class self correcting cro...
Teradata 2014, from predictive analytics to best in class self correcting cro...
 
Salesforce case study
Salesforce case studySalesforce case study
Salesforce case study
 
Strategy and execution performance predictive index
Strategy and execution performance predictive indexStrategy and execution performance predictive index
Strategy and execution performance predictive index
 
Simmethod measuring and predicting sap, oracle and salesforce risk and perfor...
Simmethod measuring and predicting sap, oracle and salesforce risk and perfor...Simmethod measuring and predicting sap, oracle and salesforce risk and perfor...
Simmethod measuring and predicting sap, oracle and salesforce risk and perfor...
 
Simmethod from software as a service to outcomes as a service, oracle, sap an...
Simmethod from software as a service to outcomes as a service, oracle, sap an...Simmethod from software as a service to outcomes as a service, oracle, sap an...
Simmethod from software as a service to outcomes as a service, oracle, sap an...
 
Simmethod 2015 social media twitter case study
Simmethod 2015 social media twitter case studySimmethod 2015 social media twitter case study
Simmethod 2015 social media twitter case study
 
Simmethod measuring and predicting apple risk and performance
Simmethod measuring and predicting apple risk and performanceSimmethod measuring and predicting apple risk and performance
Simmethod measuring and predicting apple risk and performance
 
Simmethod why and benefits, vmware and cisco case studies
Simmethod why and benefits, vmware and cisco case studiesSimmethod why and benefits, vmware and cisco case studies
Simmethod why and benefits, vmware and cisco case studies
 
The way we measure corporate risk and performance is broken
The way we measure corporate risk and performance is brokenThe way we measure corporate risk and performance is broken
The way we measure corporate risk and performance is broken
 
IBM 2014, C-level Risk And Opportunity Alerts
IBM 2014, C-level Risk And Opportunity AlertsIBM 2014, C-level Risk And Opportunity Alerts
IBM 2014, C-level Risk And Opportunity Alerts
 
Simmethod predictive capabilities, converting your data into a predictive too...
Simmethod predictive capabilities, converting your data into a predictive too...Simmethod predictive capabilities, converting your data into a predictive too...
Simmethod predictive capabilities, converting your data into a predictive too...
 

More from SIMMETHOD: Converting Information Into Assets (7)

Simmethod and the 2016 silicon valley 150 index
Simmethod and the 2016 silicon valley 150 indexSimmethod and the 2016 silicon valley 150 index
Simmethod and the 2016 silicon valley 150 index
 
Simmethod growth and value creation sales index
Simmethod growth and value creation sales indexSimmethod growth and value creation sales index
Simmethod growth and value creation sales index
 
Simmethod risk index
Simmethod risk indexSimmethod risk index
Simmethod risk index
 
How to improve your 2015 predictions
How to improve your 2015 predictionsHow to improve your 2015 predictions
How to improve your 2015 predictions
 
The rise of the industry agnostic enterprise
The rise of the industry agnostic enterpriseThe rise of the industry agnostic enterprise
The rise of the industry agnostic enterprise
 
Teradata case study
Teradata case studyTeradata case study
Teradata case study
 
Unlocking the 2014 value of your human capital
Unlocking the 2014 value of your human capitalUnlocking the 2014 value of your human capital
Unlocking the 2014 value of your human capital
 

Recently uploaded

Beautiful Sapna Vip Call Girls Hauz Khas 9711199012 Call /Whatsapps
Beautiful Sapna Vip  Call Girls Hauz Khas 9711199012 Call /WhatsappsBeautiful Sapna Vip  Call Girls Hauz Khas 9711199012 Call /Whatsapps
Beautiful Sapna Vip Call Girls Hauz Khas 9711199012 Call /Whatsappssapnasaifi408
 
Call Girls In Dwarka 9654467111 Escorts Service
Call Girls In Dwarka 9654467111 Escorts ServiceCall Girls In Dwarka 9654467111 Escorts Service
Call Girls In Dwarka 9654467111 Escorts ServiceSapana Sha
 
ASML's Taxonomy Adventure by Daniel Canter
ASML's Taxonomy Adventure by Daniel CanterASML's Taxonomy Adventure by Daniel Canter
ASML's Taxonomy Adventure by Daniel Cantervoginip
 
Building on a FAIRly Strong Foundation to Connect Academic Research to Transl...
Building on a FAIRly Strong Foundation to Connect Academic Research to Transl...Building on a FAIRly Strong Foundation to Connect Academic Research to Transl...
Building on a FAIRly Strong Foundation to Connect Academic Research to Transl...Jack DiGiovanna
 
Call Us ➥97111√47426🤳Call Girls in Aerocity (Delhi NCR)
Call Us ➥97111√47426🤳Call Girls in Aerocity (Delhi NCR)Call Us ➥97111√47426🤳Call Girls in Aerocity (Delhi NCR)
Call Us ➥97111√47426🤳Call Girls in Aerocity (Delhi NCR)jennyeacort
 
RABBIT: A CLI tool for identifying bots based on their GitHub events.
RABBIT: A CLI tool for identifying bots based on their GitHub events.RABBIT: A CLI tool for identifying bots based on their GitHub events.
RABBIT: A CLI tool for identifying bots based on their GitHub events.natarajan8993
 
Multiple time frame trading analysis -brianshannon.pdf
Multiple time frame trading analysis -brianshannon.pdfMultiple time frame trading analysis -brianshannon.pdf
Multiple time frame trading analysis -brianshannon.pdfchwongval
 
1:1定制(UQ毕业证)昆士兰大学毕业证成绩单修改留信学历认证原版一模一样
1:1定制(UQ毕业证)昆士兰大学毕业证成绩单修改留信学历认证原版一模一样1:1定制(UQ毕业证)昆士兰大学毕业证成绩单修改留信学历认证原版一模一样
1:1定制(UQ毕业证)昆士兰大学毕业证成绩单修改留信学历认证原版一模一样vhwb25kk
 
Defining Constituents, Data Vizzes and Telling a Data Story
Defining Constituents, Data Vizzes and Telling a Data StoryDefining Constituents, Data Vizzes and Telling a Data Story
Defining Constituents, Data Vizzes and Telling a Data StoryJeremy Anderson
 
Advanced Machine Learning for Business Professionals
Advanced Machine Learning for Business ProfessionalsAdvanced Machine Learning for Business Professionals
Advanced Machine Learning for Business ProfessionalsVICTOR MAESTRE RAMIREZ
 
IMA MSN - Medical Students Network (2).pptx
IMA MSN - Medical Students Network (2).pptxIMA MSN - Medical Students Network (2).pptx
IMA MSN - Medical Students Network (2).pptxdolaknnilon
 
Predicting Salary Using Data Science: A Comprehensive Analysis.pdf
Predicting Salary Using Data Science: A Comprehensive Analysis.pdfPredicting Salary Using Data Science: A Comprehensive Analysis.pdf
Predicting Salary Using Data Science: A Comprehensive Analysis.pdfBoston Institute of Analytics
 
INTERNSHIP ON PURBASHA COMPOSITE TEX LTD
INTERNSHIP ON PURBASHA COMPOSITE TEX LTDINTERNSHIP ON PURBASHA COMPOSITE TEX LTD
INTERNSHIP ON PURBASHA COMPOSITE TEX LTDRafezzaman
 
Call Girls in Defence Colony Delhi 💯Call Us 🔝8264348440🔝
Call Girls in Defence Colony Delhi 💯Call Us 🔝8264348440🔝Call Girls in Defence Colony Delhi 💯Call Us 🔝8264348440🔝
Call Girls in Defence Colony Delhi 💯Call Us 🔝8264348440🔝soniya singh
 
RadioAdProWritingCinderellabyButleri.pdf
RadioAdProWritingCinderellabyButleri.pdfRadioAdProWritingCinderellabyButleri.pdf
RadioAdProWritingCinderellabyButleri.pdfgstagge
 
毕业文凭制作#回国入职#diploma#degree澳洲中央昆士兰大学毕业证成绩单pdf电子版制作修改#毕业文凭制作#回国入职#diploma#degree
毕业文凭制作#回国入职#diploma#degree澳洲中央昆士兰大学毕业证成绩单pdf电子版制作修改#毕业文凭制作#回国入职#diploma#degree毕业文凭制作#回国入职#diploma#degree澳洲中央昆士兰大学毕业证成绩单pdf电子版制作修改#毕业文凭制作#回国入职#diploma#degree
毕业文凭制作#回国入职#diploma#degree澳洲中央昆士兰大学毕业证成绩单pdf电子版制作修改#毕业文凭制作#回国入职#diploma#degreeyuu sss
 
NLP Data Science Project Presentation:Predicting Heart Disease with NLP Data ...
NLP Data Science Project Presentation:Predicting Heart Disease with NLP Data ...NLP Data Science Project Presentation:Predicting Heart Disease with NLP Data ...
NLP Data Science Project Presentation:Predicting Heart Disease with NLP Data ...Boston Institute of Analytics
 
EMERCE - 2024 - AMSTERDAM - CROSS-PLATFORM TRACKING WITH GOOGLE ANALYTICS.pptx
EMERCE - 2024 - AMSTERDAM - CROSS-PLATFORM  TRACKING WITH GOOGLE ANALYTICS.pptxEMERCE - 2024 - AMSTERDAM - CROSS-PLATFORM  TRACKING WITH GOOGLE ANALYTICS.pptx
EMERCE - 2024 - AMSTERDAM - CROSS-PLATFORM TRACKING WITH GOOGLE ANALYTICS.pptxthyngster
 
9654467111 Call Girls In Munirka Hotel And Home Service
9654467111 Call Girls In Munirka Hotel And Home Service9654467111 Call Girls In Munirka Hotel And Home Service
9654467111 Call Girls In Munirka Hotel And Home ServiceSapana Sha
 

Recently uploaded (20)

Beautiful Sapna Vip Call Girls Hauz Khas 9711199012 Call /Whatsapps
Beautiful Sapna Vip  Call Girls Hauz Khas 9711199012 Call /WhatsappsBeautiful Sapna Vip  Call Girls Hauz Khas 9711199012 Call /Whatsapps
Beautiful Sapna Vip Call Girls Hauz Khas 9711199012 Call /Whatsapps
 
Call Girls In Dwarka 9654467111 Escorts Service
Call Girls In Dwarka 9654467111 Escorts ServiceCall Girls In Dwarka 9654467111 Escorts Service
Call Girls In Dwarka 9654467111 Escorts Service
 
ASML's Taxonomy Adventure by Daniel Canter
ASML's Taxonomy Adventure by Daniel CanterASML's Taxonomy Adventure by Daniel Canter
ASML's Taxonomy Adventure by Daniel Canter
 
Building on a FAIRly Strong Foundation to Connect Academic Research to Transl...
Building on a FAIRly Strong Foundation to Connect Academic Research to Transl...Building on a FAIRly Strong Foundation to Connect Academic Research to Transl...
Building on a FAIRly Strong Foundation to Connect Academic Research to Transl...
 
Call Us ➥97111√47426🤳Call Girls in Aerocity (Delhi NCR)
Call Us ➥97111√47426🤳Call Girls in Aerocity (Delhi NCR)Call Us ➥97111√47426🤳Call Girls in Aerocity (Delhi NCR)
Call Us ➥97111√47426🤳Call Girls in Aerocity (Delhi NCR)
 
RABBIT: A CLI tool for identifying bots based on their GitHub events.
RABBIT: A CLI tool for identifying bots based on their GitHub events.RABBIT: A CLI tool for identifying bots based on their GitHub events.
RABBIT: A CLI tool for identifying bots based on their GitHub events.
 
Multiple time frame trading analysis -brianshannon.pdf
Multiple time frame trading analysis -brianshannon.pdfMultiple time frame trading analysis -brianshannon.pdf
Multiple time frame trading analysis -brianshannon.pdf
 
1:1定制(UQ毕业证)昆士兰大学毕业证成绩单修改留信学历认证原版一模一样
1:1定制(UQ毕业证)昆士兰大学毕业证成绩单修改留信学历认证原版一模一样1:1定制(UQ毕业证)昆士兰大学毕业证成绩单修改留信学历认证原版一模一样
1:1定制(UQ毕业证)昆士兰大学毕业证成绩单修改留信学历认证原版一模一样
 
Defining Constituents, Data Vizzes and Telling a Data Story
Defining Constituents, Data Vizzes and Telling a Data StoryDefining Constituents, Data Vizzes and Telling a Data Story
Defining Constituents, Data Vizzes and Telling a Data Story
 
Advanced Machine Learning for Business Professionals
Advanced Machine Learning for Business ProfessionalsAdvanced Machine Learning for Business Professionals
Advanced Machine Learning for Business Professionals
 
IMA MSN - Medical Students Network (2).pptx
IMA MSN - Medical Students Network (2).pptxIMA MSN - Medical Students Network (2).pptx
IMA MSN - Medical Students Network (2).pptx
 
Predicting Salary Using Data Science: A Comprehensive Analysis.pdf
Predicting Salary Using Data Science: A Comprehensive Analysis.pdfPredicting Salary Using Data Science: A Comprehensive Analysis.pdf
Predicting Salary Using Data Science: A Comprehensive Analysis.pdf
 
Deep Generative Learning for All - The Gen AI Hype (Spring 2024)
Deep Generative Learning for All - The Gen AI Hype (Spring 2024)Deep Generative Learning for All - The Gen AI Hype (Spring 2024)
Deep Generative Learning for All - The Gen AI Hype (Spring 2024)
 
INTERNSHIP ON PURBASHA COMPOSITE TEX LTD
INTERNSHIP ON PURBASHA COMPOSITE TEX LTDINTERNSHIP ON PURBASHA COMPOSITE TEX LTD
INTERNSHIP ON PURBASHA COMPOSITE TEX LTD
 
Call Girls in Defence Colony Delhi 💯Call Us 🔝8264348440🔝
Call Girls in Defence Colony Delhi 💯Call Us 🔝8264348440🔝Call Girls in Defence Colony Delhi 💯Call Us 🔝8264348440🔝
Call Girls in Defence Colony Delhi 💯Call Us 🔝8264348440🔝
 
RadioAdProWritingCinderellabyButleri.pdf
RadioAdProWritingCinderellabyButleri.pdfRadioAdProWritingCinderellabyButleri.pdf
RadioAdProWritingCinderellabyButleri.pdf
 
毕业文凭制作#回国入职#diploma#degree澳洲中央昆士兰大学毕业证成绩单pdf电子版制作修改#毕业文凭制作#回国入职#diploma#degree
毕业文凭制作#回国入职#diploma#degree澳洲中央昆士兰大学毕业证成绩单pdf电子版制作修改#毕业文凭制作#回国入职#diploma#degree毕业文凭制作#回国入职#diploma#degree澳洲中央昆士兰大学毕业证成绩单pdf电子版制作修改#毕业文凭制作#回国入职#diploma#degree
毕业文凭制作#回国入职#diploma#degree澳洲中央昆士兰大学毕业证成绩单pdf电子版制作修改#毕业文凭制作#回国入职#diploma#degree
 
NLP Data Science Project Presentation:Predicting Heart Disease with NLP Data ...
NLP Data Science Project Presentation:Predicting Heart Disease with NLP Data ...NLP Data Science Project Presentation:Predicting Heart Disease with NLP Data ...
NLP Data Science Project Presentation:Predicting Heart Disease with NLP Data ...
 
EMERCE - 2024 - AMSTERDAM - CROSS-PLATFORM TRACKING WITH GOOGLE ANALYTICS.pptx
EMERCE - 2024 - AMSTERDAM - CROSS-PLATFORM  TRACKING WITH GOOGLE ANALYTICS.pptxEMERCE - 2024 - AMSTERDAM - CROSS-PLATFORM  TRACKING WITH GOOGLE ANALYTICS.pptx
EMERCE - 2024 - AMSTERDAM - CROSS-PLATFORM TRACKING WITH GOOGLE ANALYTICS.pptx
 
9654467111 Call Girls In Munirka Hotel And Home Service
9654467111 Call Girls In Munirka Hotel And Home Service9654467111 Call Girls In Munirka Hotel And Home Service
9654467111 Call Girls In Munirka Hotel And Home Service
 

The crowd sourced analytics of the technology best in class

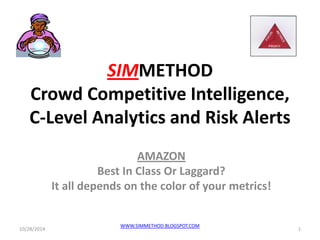
  • 1. SIMMETHOD Crowd Competitive Intelligence, C-Level Analytics and Risk Alerts AMAZON Best In Class Or Laggard? It all depends on the color of your metrics! 10/28/2014 1 WWW.SIMMETHOD.BLOGSPOT.COM
  • 2. SIMMETHOD C-level Risk And Opportunity Alerts 10/28/2014 WWW.SIMMETHOD.BLOGSPOT.COM 2
  • 3. The Market Has Opposing Views On Amazon “Investors aren’t buying the Amazon fairy-tale anymore” reported Business Insider on 10/25/2014 “Part of Amazon.com’s core is dying” reported Paul Santos in Seeking Alpha 10/28/2014 WWW.SIMMETHOD.BLOGSPOT.COM 3
  • 4. The Market Has Opposing Views On Amazon “Amazon Fire Sale: Down 7% on Q3 Miss. Q4 View: Two Downgrades, Price Targets Slashed” reported Barron’s on October 24 10/28/2014 WWW.SIMMETHOD.BLOGSPOT.COM 4
  • 5. The Market Has Opposing Views On Amazon “No One Wants To Hear Anything Good About Amazon, But… “Break out Amazon’s tech revenues from merchandise sales and the stock is at industry multiples” “This company is still growing at 20% per year and the stock is thus dirt-cheap” wrote Dana Blankenhorn on Seeking Alpha 10/28/2014 WWW.SIMMETHOD.BLOGSPOT.COM 5
  • 6. 2013 To 2014 Performance Trend •How do The Barron’s 500 (2013 to 2014) trend compare to the SIMMETHOD Strategy & Execution Performance Predictive Index trend? 10/28/2014 WWW.SIMMETHOD.BLOGSPOT.COM 6
  • 7. 2013 To 2014 Performance Trend Name Barron’s 500 SIMMETHOD Strategy & Execution Performance Predictive Index eBay ↑ ↑ Cognizant ↓ ↑ IBM ↓ ↓ Fidelity National Information ↓ ↓ Amazon ↑ ↓ Google ↑ ↑ Priceline ↑ ↑ Facebook ↓ ↑ Microsoft ↑ ↑ 10/28/2014 WWW.SIMMETHOD.BLOGSPOT.COM 7
  • 8. Barron’s 500 Ranking Algorithm •“Median three-year cash-flow-based ROI, •One-year change in that measure relative to the three-year median and •Adjusted sales growth in the last fiscal year” 10/28/2014 WWW.SIMMETHOD.BLOGSPOT.COM 8
  • 9. SIMMETHOD and The Barron’s 500 There is a main reasons why The Barron’s 500 and the SIMMETHOD Index arrive to two different results such as in Amazon’s case: •SIMMETHOD is a holistic (context based) risk & performance index covering a larger number of financial and operational metrics blended with crowd-sourced analytics relative to the Best In Class in a League Table 10/28/2014 WWW.SIMMETHOD.BLOGSPOT.COM 9
  • 10. The Way We Measure Corporate Risk and Performance Is Broken Why do Businesses fail or fail to perform? Blockbuster Borders Circuit City Mervyns Wachovia Washington Mutual Linen n’ Things 10/28/2014 10 WWW.SIMMETHOD.BLOGSPOT.COM
  • 11. SIMMETHOD Strategy & Execution Performance Predictive Index 10/28/2014 WWW.SIMMETHOD.BLOGSPOT.COM 11 How to holistically measure your strategy & execution and your competitive advantage?
  • 12. The SIMMETHOD Algorithms and the 7 Laws of Growth and Value Creation SIMMETHOD 7 Laws Integration/alignment Crowd analytics inside/outside your industry Growth & value creation Resource contribution to objectives C-level Predictive performance & risk Averages & positive trends Minimum company /business model 10/28/2014 WWW.SIMMETHOD.BLOGSPOT.COM 12
  • 13. SIMMETHOD •SIMMETHOD’s Strategy & Execution Performance Predictive Index Business League Table 10/28/2014 WWW.SIMMETHOD.BLOGSPOT.COM 13
  • 14. SIMMETHOD’s Technology League Table Top 25% Vs. Bottom 25% The top 25% of the SIMMETHOD Technology League Table on average Delivers 3x more profit and Creates 3x more value with 30% less sales 10/28/2014 14 WWW.SIMMETHOD.BLOGSPOT.COM
  • 15. SIMMETHOD’s Technology League Table Top 25% Vs. Bottom 25% To generate $1 of profit need to sell $4 To generate $1 of profit need to sell $19 10/28/2014 15 WWW.SIMMETHOD.BLOGSPOT.COM
  • 16. SIMMETHOD’s Technology League Table Top 25% Vs. Bottom 25% Every $1 of sales creates $5 of business value Every $1 of sales creates $1.2 of business value 10/28/2014 16 WWW.SIMMETHOD.BLOGSPOT.COM
  • 17. SIMMETHOD Strategy and Execution Performance Predictive Index •What is Amazon’s position within the 2014 SIMMETHOD Strategy & Execution Performance Predictive Index Business League Table? 10/28/2014 17 WWW.SIMMETHOD.BLOGSPOT.COM
  • 18. SIMMETHOD’s C-Level Trends 2012-2014 Amazon and the Best-In-Class The following C-Level indices show Amazon’s ability to: •Strategize and execute against the SIMMETHOD Best-In-Class, •Compete against the Best-In-Class, current and future competitors and are leading indicators of future business opportunities, risk and performance. 10/28/2014 18 WWW.SIMMETHOD.BLOGSPOT.COM
  • 19. SIMMETHOD Strategy & Execution Performance Predictive Index 0 10 20 30 40 50 60 70 80 SIMMETHOD Management Controllable Resources Index SIMMETHOD Strategy & Execution Performance Predictive Index 10/28/2014 19 WWW.SIMMETHOD.BLOGSPOT.COM
  • 20. SIMMETHOD Strategy & Execution Performance Predictive Index -10 -5 0 5 10 15 20 25 30 35 SIMMETHOD Management Controllable Resources Index SIMMETHOD Strategy & Execution Performance Predictive Index 10/28/2014 20 WWW.SIMMETHOD.BLOGSPOT.COM
  • 21. SIMMETHOD Strategy & Execution Performance Predictive Index -30 -25 -20 -15 -10 -5 0 SIMMETHOD Management Controllable Resources Index SIMMETHOD Strategy & Execution Performance Predictive Index 10/28/2014 21 WWW.SIMMETHOD.BLOGSPOT.COM SIMMETHOD’s crowd-sourced analytics and algorithms have placed Amazon’s Strategy & Execution Performance Predictive Index at the top of the 3rd quartile of the SIMMETHOD Technology Business League Table
  • 22. SIMMETHOD Strategy & Execution Performance Predictive Index -60 -50 -40 -30 -20 -10 0 AT&T Atos Thomas Cook Adecco Grupo Televisa Fidelity National … Computer Sciences Sodexco Verizon comm American Express Time Warner Cable Compal Elecronics HP Expedia Capgemini Comcast Liberty interactive Telefonica Verisk Analytics Cablevision Centurylink Innolux SIMMETHOD Management Controllable Resources Index SIMMETHOD Strategy & Execution Performance Predictive Index 10/28/2014 22 WWW.SIMMETHOD.BLOGSPOT.COM
  • 23. SIMMETHOD •SIMMETHOD Crowd-Sourced Competitive Intelligence Analytics 10/28/2014 WWW.SIMMETHOD.BLOGSPOT.COM 23
  • 24. SIMMETHOD Crowd Competitive Intelligence It shows your strengths and weaknesses at the enterprise (rather than the product) level and Your ability to compete with existing businesses and potential new competitors with new business models, cost structures, processes, distribution channels and products. 10/28/2014 24 WWW.SIMMETHOD.BLOGSPOT.COM
  • 25. SIMMETHOD Competitive Intelligence Trend Vs. Peers And Best-In-Class 10/28/2014 25 WWW.SIMMETHOD.BLOGSPOT.COM -10 0 10 20 30 40 50 60 70 Average B-I-C SIMMETHOD Strategy & Execution Performance Predictive Index Apple SIMMETHOD Strategy & Execution Performance Predictive index Google SIMMETHOD Strategy & Execution Performance Predictive index Microsoft SIMMETHOD Strategy & Execution Performance Predictive index IBM SIMMETHOD Strategy & Execution Performance Predictive Index Amazon SIMMETHOD Strategy & Execution Performance Predictive index Yahoo SIMMETHOD Strategy & Execution Performance Predictive Index 2014 2013 2012 The crowd sourced analytics trend shows Amazon’s increasing risk vs. peers & B-I-C
  • 26. SIMMETHOD Competitive Intelligence Trend Vs. Peers And Best-In-Class 10/28/2014 WWW.SIMMETHOD.BLOGSPOT.COM 26 -10 -5 0 5 10 15 20 25 30 35 40 45 Avg. B-I-C SIMMETHOD Management Controllable Resources Index Apple SIMMETHOD Management Controllable Resources index Google SIMMETHOD Management Controllable Resources index Microsoft SIMMETHOD Management Controllable Resources index IBM SIMMETHOD Management Controllable Resources Index Amazon SIMMETHOD Management Controllable Resources Index Yahoo SIMMETHOD Management Controllable Resources Index 2014 2013 2012 SIMMETHOD’s crowd analytics shows that Amazon is not leveraging resources at B-I-C level and the trend is negative
  • 27. SIMMETHOD Competitive Intelligence Trend Vs. Peers And Best-In-Class 10/28/2014 WWW.SIMMETHOD.BLOGSPOT.COM 27 -5 0 5 10 15 20 25 30 Avg. B-I-C SIMMETHOD Value Creation Index Apple SIMMETHOD Value Creation Index Google SIMMETHOD Value Creation Index Microsoft SIMMETHOD Value Creation Index IBM SIMMETHOD Value Creation Index Amazon SIMMETHOD Value Creation Index Yahoo SIMMETHOD Value Creation Index 2014 2013 2012 SIMMETHOD’s crowd sourced analytics shows that Amazon’s Value Creation Index is not competitive vs. B-I-C
  • 28. SIMMETHOD 2014 Competitive Intelligence Across Major Indices 10/28/2014 WWW.SIMMETHOD.BLOGSPOT.COM 28 -20 -10 0 10 20 30 40 50 60 70 Apple Facebook Yahoo Google Amazon Aveg. B-I-C B-I-C SIMMETHOD Minimum Company Business Model Index B-I-C SIMMETHOD Value Creation Index B-I-C SIMMETHOD Management Controllable Resources Index B-I-C SIMMETHOD Strategy/ Execution Performance Predictive Index Measuring with absolute data such as “sales growth” does not always reveal the true picture
  • 29. SIMMETHOD 2014 Competitive Intelligence Across Major Indices 10/28/2014 WWW.SIMMETHOD.BLOGSPOT.COM 29 -20 -10 0 10 20 30 40 50 60 70 Apple Facebook Yahoo Google Amazon Aveg. B-I-C B-I-C SIMMETHOD Strategy/ Execution Performance Predictive Index B-I-C SIMMETHOD Management Controllable Resources Index B-I-C SIMMETHOD Value Creation Index B-I-C SIMMETHOD Minimum Company Business Model Index Amazon’s competitive gap to the SIMMETHOD Best In Class
  • 30. SIMMETHOD •Amazon’s 2012 to 2014 Trends And Competitive Advantage Across The SIMMETHOD Indices 10/28/2014 WWW.SIMMETHOD.BLOGSPOT.COM 30
  • 31. SIMMETHOD Strategy & Execution Performance Predictive Index Amazon’s 2012 to 2014 trend across the indices of the SIMMETHOD Best In Class showing: •Competitive strengths, •Competitive weaknesses, •Industry agnostic Risk alerts and •Opportunities for improvement in order to become Best In Class across a range of industries and fend off current and future competitors 10/28/2014 31 WWW.SIMMETHOD.BLOGSPOT.COM
  • 32. SIMMETHOD 2012 to 2014 Business and Industry Trends 10/28/2014 WWW.SIMMETHOD.BLOGSPOT.COM 32 -15 -10 -5 0 5 10 15 Amazon 2012 Amazon 2013 Amazon 2014 Although absolute sales metrics are growing, the SIMMETHOD Sales and Strategy/Execution Indices are not
  • 33. SIMMETHOD 2012 to 2014 Business and Industry Trends 10/28/2014 WWW.SIMMETHOD.BLOGSPOT.COM 33 -15 -10 -5 0 5 10 15 Amazon 2012 Amazon 2013 Amazon 2014 SIMMETHOD’s crowd sourced analytics shows that Amazon’s competitive advantage trend is negative vs. peers and SIMMETHOD’s Best in Class
  • 34. SIMMETHOD Your trend versus the SIMMETHOD Best In Class Your level of risk increases if and when: •Your data (such as Amazon’s sales) points North and your SIMMETHOD indices point South, or •The gap between your indices and the SIMMETHOD Best In Class indices is widening, or •Your SIMMETHOD composite indices are not supported by your management controllable or operational indices. 10/28/2014 WWW.SIMMETHOD.BLOGSPOT.COM 34
  • 35. SIMMETHOD’s C-Level Trends 2012-2014 Amazon and the Best-In-Class •When the Best-In-Class and your SIMMETHOD C-Level indices are moving in opposite directions, your ability to compete weakens in proportion to your widening gap to the Best-In-Class. 10/28/2014 WWW.SIMMETHOD.BLOGSPOT.COM 35
  • 36. SIMMETHOD Trends against the SIMMETHOD Best In Class 10/28/2014 WWW.SIMMETHOD.BLOGSPOT.COM 36 -10 -5 0 5 10 15 20 25 30 35 2012 2013 2014 Average B-I-C SIMMETHOD Strategy/ Execution Performance Predictive Index Amazon SIMMETHOD Strategy/ Execution Performance Predictive index Is there a measurable & predictive trend developing?
  • 37. SIMMETHOD Trends against the SIMMETHOD Best In Class 10/28/2014 WWW.SIMMETHOD.BLOGSPOT.COM 37 -2 0 2 4 6 8 10 12 14 16 2012 2013 2014 Avg. B-I-C SIMMETHOD Management Controllable Resources Index Amazon SIMMETHOD Management Controllable Resources Index SIMMETHOD found a correlation between the resource management index and value creation
  • 38. SIMMETHOD Trends against the SIMMETHOD Best In Class 10/28/2014 WWW.SIMMETHOD.BLOGSPOT.COM 38 -5 0 5 10 15 20 2012 2013 2014 Avg. B-I-C SIMMETHOD Value Creation Index Amazon SIMMETHOD Value Creation Index
  • 39. SIMMETHOD Trends against the SIMMETHOD Best In Class 10/28/2014 WWW.SIMMETHOD.BLOGSPOT.COM 39 0 1 2 3 4 5 6 7 2012 2013 2014 Avg. B-I-C SIMMETHOD Cash/Debt Index Amazon SIMMETHOD Cash/ Debt Index
  • 40. SIMMETHOD Trends against the SIMMETHOD Best In Class 10/28/2014 WWW.SIMMETHOD.BLOGSPOT.COM 40 0 0.5 1 1.5 2 2.5 2012 2013 2014 Avg. B-I-C SIMMETHOD Sales Index Amazon SIMMETHOD Sales Index
  • 41. SIMMETHOD Trends against the SIMMETHOD Best In Class 10/28/2014 WWW.SIMMETHOD.BLOGSPOT.COM 41 -5 -4 -3 -2 -1 0 1 2 3 2012 2013 2014 Avg. B-I-C Overheads Index Amazon SIMMETHOD Overheads Index
  • 42. SIMMETHOD Trends against the SIMMETHOD Best In Class 10/28/2014 WWW.SIMMETHOD.BLOGSPOT.COM 42 0 1 2 3 4 5 6 2012 2013 2014 Avg. B-I-C SIMMETHOD HR Index Amazon SIMMETHOD HR Index
  • 43. SIMMETHOD Trends against the SIMMETHOD Best In Class •In summary, most SIMMETHOD indices show a widening negative gap vs. the SIMMETHOD Best In Class average highlighting Amazon’s increased competitive risk vs. peers and the Best In Class in the Technology League Table 10/28/2014 WWW.SIMMETHOD.BLOGSPOT.COM 43
  • 44. SIMMETHOD Best In Class and Risk Profiles •SIMMETHOD Best In Class analytical profiles and risk alerts provide you and your C-level with a large number of levers to improve your performance and reduce your risk 10/28/2014 WWW.SIMMETHOD.BLOGSPOT.COM 44
  • 45. Amazon 2013-2014 Gap to the SIMMETHOD Best In Class Profiles •Are Amazon’s gaps to the SIMMETHOD Best In Class and risk profiles narrowing or widening and are they aligned to their indices? 10/28/2014 WWW.SIMMETHOD.BLOGSPOT.COM 45
  • 46. Is there a disconnect between your SIMMETHOD indices and your gap to the Best In Class profile? •When your SIMMETHOD indices are trending up and your gap to the SIMMETHOD Best In Class and risk profile is negatively widening, your C- Level sensors are presenting you with specific risk and opportunity alerts. Why? 10/28/2014 WWW.SIMMETHOD.BLOGSPOT.COM 46
  • 47. Is there a disconnect between your SIMMETHOD indices and your gap to the Best In Class profile? Unlike your SIMMETHOD indices that holistically measure your strategy/execution or competitive position within a business league table, your gap to the Best In Class profiles provides: A specific C-Level ratio by ratio path to a moving Best In Class performance and risk management profile database or your pre-established targets Risk and opportunities alerts that can be acted upon to reduce the gap to the Best In Class, improve your performance , competitive advantage and reduce your risk level 10/28/2014 WWW.SIMMETHOD.BLOGSPOT.COM 47
  • 48. Amazon and the SIMMETHOD 2014 Best In Class Profile SIMMETHOD’s 2014 B-I-C average profit per employee is 52x higher than Amazon 10/28/2014 WWW.SIMMETHOD.BLOGSPOT.COM 48
  • 49. Amazon and the SIMMETHOD 2013 Best In Class Profile SIMMETHOD’s 2013 B-I-C average value per employee is 1.8x higher than Amazon 10/28/2014 WWW.SIMMETHOD.BLOGSPOT.COM 49
  • 50. Amazon and the SIMMETHOD 2014 Best In Class Profile SIMMETHOD’s 2014 B-I-C average value per employee is 2.8x higher than Amazon 10/28/2014 WWW.SIMMETHOD.BLOGSPOT.COM 50
  • 51. Amazon and the SIMMETHOD 2013 Best In Class Profile SIMMETHOD’s 2013 B-I-C average sales per employee are 1.5x higher than Amazon 10/28/2014 WWW.SIMMETHOD.BLOGSPOT.COM 51
  • 52. Amazon and the SIMMETHOD 2014 Best In Class Profile Amazon’s sales per employee are 1.2x higher than the SIMMETHOD’s 2014 B-I-C average 10/28/2014 WWW.SIMMETHOD.BLOGSPOT.COM 52
  • 53. Amazon and the SIMMETHOD 2013 Best In Class Profile Amazon’s needs $1.1x more cash than the SIMMETHOD 2013 B-I-C to generate $1/value 10/28/2014 WWW.SIMMETHOD.BLOGSPOT.COM 53
  • 54. Amazon and the SIMMETHOD 2014 Best In Class Profile Amazon needs 2x more cash than the SIMMETHOD 2014 B-I-C to create $1/value 10/28/2014 WWW.SIMMETHOD.BLOGSPOT.COM 54
  • 55. Your gap to the SIMMETHOD Best In Class profiles determines your results According to the SIMMETHOD crowd sourced analytics and in comparison to the SIMMETHOD Best In Class profiles: Amazon’s 2014 sales per employee are above B-I-C levels, Profit and value per employee are decreasing and To generate $1 of business value, Amazon requires double the cash of the Best In Class 10/28/2014 WWW.SIMMETHOD.BLOGSPOT.COM 55
  • 56. Your gap to the SIMMETHOD Best In Class profiles determines your results Amazon’s risk level is increasing for the following reasons: There is a disconnect between the Management Controllable Resources Index that represents the levers of value creation under management control and Amazon value creation index Most of Amazon’s SIMMETHOD indices are trending down and the gap to the Best In Class is widening The SIMMETHOD Best In Class are improving at a faster rate than Amazon. 10/28/2014 WWW.SIMMETHOD.BLOGSPOT.COM 56
  • 57. Amazon 2014 SIMMETHOD Risk and Performance Summary Index Value Index trend Index trend vs. B-I-C Gap to B-I-C & risk profile ratios 7 Laws compliance Sales + = - + - Overheads - - - - HR + - - - - Cash/Debt + - - - - Management Controllable Resources - - - - Minimum Company Business Model - - - - Value Creation - - - - - Strategy/execution Performance Predictive - - - - 10/28/2014 WWW.SIMMETHOD.BLOGSPOT.COM 57
  • 58. SIMMETHOD’s Disclaimer •The purpose of the SIMMETHOD Strategy & Execution Performance Predictive Index and risk and opportunities alerts is not to make a business right or wrong but rather contribute towards the understanding of management actions in comparison to industry’s peers and the SIMMETHOD Best In Class. 10/28/2014 WWW.SIMMETHOD.BLOGSPOT.COM 58
  • 59. SIMMETHOD’s Disclaimer •SIMMETHOD’s Strategy & Execution Performance Predictive Index and risk and opportunities alerts do not seek to be exact but rather serve as a conduit to ask better questions and seek better answers in the performance improvement, risk minimization and value creation journey. 10/28/2014 WWW.SIMMETHOD.BLOGSPOT.COM 59
  • 60. SIMMETHOD’s Disclaimer •Sometimes, the value of a metric in itself does not provide the greatest of insights, but valuable actionable knowledge is gained from its ability to provide a trend or a common comparison yardstick with other businesses across a range of industries. 10/28/2014 WWW.SIMMETHOD.BLOGSPOT.COM 60
  • 61. SIMMETHOD’s Disclaimer •This Presentation is for informational purpose only and SIMMETHOD shall not be liable for the contents of the Presentation or for any damage incurred or alleged to be incurred to any of the businesses included in the Presentation as a result of its content. 10/28/2014 WWW.SIMMETHOD.BLOGSPOT.COM 61
  • 62. SIMMETHOD Strategy & Execution Performance Predictive Index In summary, are the: •Strategy & Execution Performance Predictive Indices, •Best In Class profiles, •Risk and opportunity alerts and •7 Laws of Growth and Value Creation good leading indicators of Amazon’s threats, opportunities, risk and performance? 10/28/2014 WWW.SIMMETHOD.BLOGSPOT.COM 62
  • 63. SIMMETHOD Risk and Opportunities Alerts SIMMETHOD is in the top 1% of most viewed on Slideshare and has been “Hot” on LinkedIn, Twitter and Facebook 50 times. 10/28/2014 WWW.SIMMETHOD.BLOGSPOT.COM 63
  • 64. Jorge Oscar Tabacman jtabacman@gmail.com Twitter ID: SIMMETHOD SIMMETHOD A new way to measure and predict the risk and performance of your business and alert you of new threats and opportunities 10/28/2014 64 WWW.SIMMETHOD.BLOGSPOT.COM