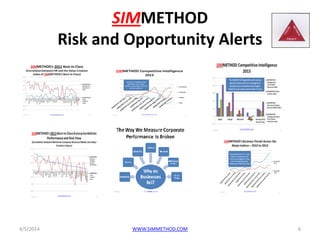
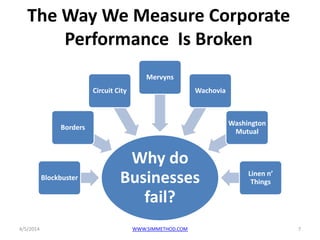
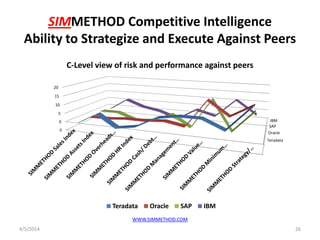
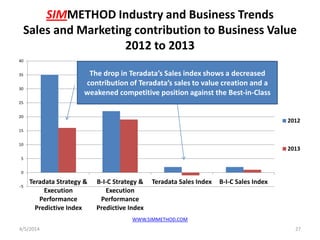
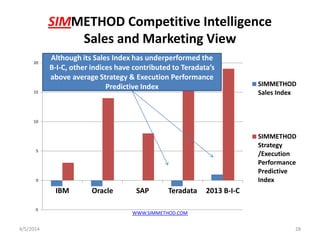
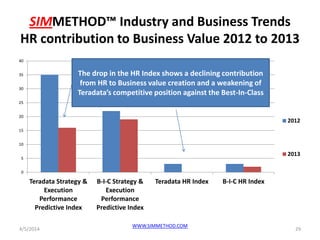
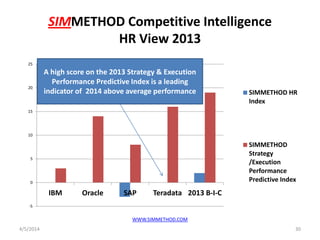
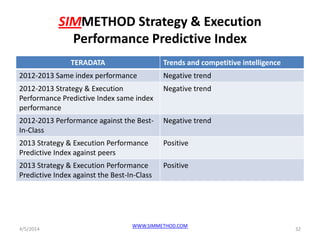
SIMMETHOD
A new way to measure and predict
your corporate risk and
performance
Is the SIMMETHOD Strategy & Execution
Performance Predictive Index a strong
leading indicator of Teradata’s future risk
and performance?
4/5/2014 1
WWW.SIMMETHOD.COM
SIMMETHOD Strategy & Execution
Performance Predictive Index
On April 2, Tiernan Ray wrote on Barron’s
Tech Trader Daily:
• “A bit of debate is underway about what
to expect from enterprise Big Data
technology provider Teradata amidst
rising competition from open-source
software Hadoop”
4/5/2014 2
WWW.SIMMETHOD.COM
SIMMETHOD Strategy & Execution
Performance Predictive Index
• “Summit Research’s Srini Nandury
reiterates a Buy rating, and a $58 price
target, writing that the main issue for
the company has been a slowdown in IT
spending, not Hadoop, and that things
are about to turn around for the
company”
4/5/2014
WWW.SIMMETHOD.COM
3
SIMMETHOD Strategy & Execution
Performance Predictive Index
• Cowen & Co’s Peter Goldmacher
reiterates an underperform rating on
Teradata shares, writing that Q1 results
on May 1st may best street expectations,
but that the rest of the year may
disappoint”
4/5/2014
WWW.SIMMETHOD.COM
4
SIMMETHOD
• Is Teradata performance
predictable based on the
SIMMETHOD Strategy and
Execution Performance
Predictive Indices?
4/5/2014 5WWW.SIMMETHOD.COM
SIMMETHOD
Risk and Opportunity Alerts
4/5/2014 WWW.SIMMETHOD.COM 6
The Way We Measure Corporate
Performance Is Broken
Why do
Businesses
fail?
Blockbuster
Borders
Circuit City
Mervyns
Wachovia
Washington
Mutual
Linen n’
Things
4/5/2014 7WWW.SIMMETHOD.COM
The CEO Lament in the Business
Analytics Market
• We did not see it coming. All my
Divisions and Product’s Analytics
pointed North while my Business
as a whole (in comparison to
new competitors and the Best-
In-Class in multiple industries)
went South.
4/5/2014 8WWW.SIMMETHOD.COM
Disrupting the Way We Measure
Corporate Risk and Performance
There are three main problems:
• The lack of a single industry-agnostic
scale to measure and predict corporate
strategy & execution (competitive
advantage) leads to erroneous and
inconsistent C-level visibility and
decision-making
4/5/2014 9WWW.SIMMETHOD.COM
Disrupting the Way We Measure
Corporate Risk and Performance
• Silos-analytics and leading indicators
that lead to erroneous C-level decisions
based on many versions of the truth
unintegrated to business strategy and
objectives
4/5/2014 10WWW.SIMMETHOD.COM
Disrupting the Way We Measure
Corporate Risk and Performance
• C-level risk and performance metrics
and ratios based on industrial-era
analytics that were not designed to
capture intangible values or the
dynamic relationships between
businesses and their value chains
4/5/2014 11WWW.SIMMETHOD.COM
Silos Analytics Lead to Many Versions
of the Truth and Erroneous Decisions
4/5/2014 12
WWW.SIMMETHOD.COM
4/5/2014
WWW.SIMMETHOD.COM
13
Lack of Business and Value-Chain
Leading Indicators and Risk Alerts
Company
view
SIMMETHOD™
industry view
indicators &
alerts
SIMMETHOD™
value-chain
view, leading
performance
indicators &
alerts
SIMMETHOD™
global market
view leading
risk/
performance
indicators &
alerts database
Inward-
Looking
Analytics
Maximum
Risk,
Minimum
Visibility
Value-Chain and Market
Leading Indicators and Risk
Alerts
Minimum Risk and Maximum
Visibility
The Leading Indicators and Risk Alerts
of the Best-In-Class
Why do you need Industry Agnostic Leading
indicators and Risk/Opportunities Alerts?
• In an interdependent Market (like the Planets
in the solar system) your current and future
risk and performance are impacted by an
ecosystem of constantly changing
competitors coming from inside
and outside your Industry.
4/5/2014
WWW.SIMMETHOD.COM
14
Your Gap to SIMMETHOD’s Best-In-Class
Determines Your Risk and Performance
Your current
position against
the B-I-C and
competitors
Gap to B-I-C in
your industry
Gap to
Competitors in
a range of
industries
Gap to B-I-C in a
range of
industries
Your original
targets against
SIMMETHOD
Database
4/5/2014 15
WWW.SIMMETHOD.COM
SIMMETHOD’s Disclaimer
• The purpose of the SIMMETHOD
Strategy/Execution Performance Predictive
Index, Reports and Risk/Opportunities Alerts
is not to make a Business right or wrong but
rather contribute towards the understanding
of management actions in comparison to
industry peers and the SIMMETHOD Best-In-
Class.
4/5/2014 WWW.SIMMETHOD.COM 16
SIMMETHOD’s Disclaimer
• SIMMETHOD’s Strategy/Execution
Performance Predictive indices, metrics and
risk/opportunities alerts do not seek to be
exact but rather serve as a conduit to ask
better questions and seek better answers in
the performance improvement, risk
minimization and value creation journey.
4/5/2014 WWW.SIMMETHOD.COM 17
SIMMETHOD’s Disclaimer
• Sometimes, the value of a metric in itself
does not provide the greatest of insights, but
valuable actionable knowledge is gained
from its ability to provide a trend or a
common comparison yardstick with other
Businesses across a range of industries.
4/5/2014 WWW.SIMMETHOD.COM 18
SIMMETHOD’s Disclaimer
• This report is for informational purpose only
and SIMMETHOD shall not be liable for the
contents of the report or risk/opportunities
alerts or for any damage incurred or alleged
to be incurred to any of the Businesses
included in the Report as a result of its
content
4/5/2014 WWW.SIMMETHOD.COM 19
SIMMETHOD
• Is Teradata performance
predictable based on the
SIMMETHOD Strategy and
Execution Performance
Predictive Indices?
4/5/2014 20WWW.SIMMETHOD.COM
SIMMETHOD’s C-Level Indices Business
Trends 2012-2013
Teradata and the Best-In-Class
The following C-Level indices show Teradata’s
ability to:
• Strategize and execute against the
SIMMETHOD Best-In-Class
• Compete against the Best-In-Class and
current and future competitors
and are leading indicators of future business
opportunities, risk and performance
4/5/2014 21
WWW.SIMMETHOD.COM
SIMMETHOD’s C-Level Indices Business
Trends 2012-2013
Teradata and the Best-In-Class
• When the Best-In-Class and your
SIMMETHOD C-Level indices are
moving in opposite directions your
ability to compete weakens in
proportion to your widening gap to
the Best-In-Class
4/5/2014
WWW.SIMMETHOD.COM
22
SIMMETHOD’s C-Level Indices
Business Trends 2012-2013
Teradata and the Best-In-Class
4/5/2014
WWW.SIMMETHOD.COM
23
0
5
10
15
20
25
30
35
40
SIMMETHOD
Management
Controllable
Resources index
SIMMETHOD
Value Creation
Index
SIMMETHOD
Minimum
Company
Business Model
index
SIMMETHOD
Strategy &
Execution
Performance
Predictive Index
Teradata 2012
Teradata 2013
Average 2013
Best-In-Class
Although still positive and above average, every
C-level index is pointing south from an historical
trend and against the Best-In-Class point of
views. Will the trend be reversed in 2014?
SIMMETHOD’s C-Level Indices Business Trends
2012-2013
Teradata and the Best-In-Class
• What are Teradata’s strengths and
weaknesses in relation to its peers and
the SIMMETHOD Best-In-Class and what
are the areas that need to be improved
to narrow the gap to 2014 Best-in-Class
performance?
4/5/2014
WWW.SIMMETHOD.COM
24
SIMMETHOD’s Business Trends Across the
Major Indices – 2012 to 2013
4/5/2014
WWW.SIMMETHOD.COM
25
-5
0
5
10
15
20
25
30
35
40
Teradata
2012
Teradata
2013
Negative trends in the Sales, Overheads, HR
and Cash/debt indices have contributed to
a lost of competitive advantage against
peers and the Best-In-Class
SIMMETHOD Competitive Intelligence
Ability to Strategize and Execute Against Peers
4/5/2014
WWW.SIMMETHOD.COM
26
Teradata
Oracle
SAP
IBM
-5
0
5
10
15
20
C-Level view of risk and performance against peers
Teradata Oracle SAP IBM
SIMMETHOD Industry and Business Trends
Sales and Marketing contribution to Business Value
2012 to 2013
4/5/2014
WWW.SIMMETHOD.COM
27
-5
0
5
10
15
20
25
30
35
40
Teradata Strategy &
Execution
Performance
Predictive Index
B-I-C Strategy &
Execution
Performance
Predictive Index
Teradata Sales Index B-I-C Sales Index
2012
2013
The drop in Teradata’s Sales index shows a decreased
contribution of Teradata’s sales to value creation and a
weakened competitive position against the Best-in-Class
SIMMETHOD Competitive Intelligence
Sales and Marketing View
4/5/2014
WWW.SIMMETHOD.COM
28
-5
0
5
10
15
20
IBM Oracle SAP Teradata 2013 B-I-C
SIMMETHOD
Sales Index
SIMMETHOD
Strategy
/Execution
Performance
Predictive
Index
Although its Sales Index has underperformed the
B-I-C, other indices have contributed to Teradata’s
above average Strategy & Execution Performance
Predictive Index
SIMMETHOD™ Industry and Business Trends
HR contribution to Business Value 2012 to 2013
4/5/2014
WWW.SIMMETHOD.COM
29
0
5
10
15
20
25
30
35
40
Teradata Strategy &
Execution
Performance
Predictive Index
B-I-C Strategy &
Execution
Performance
Predictive Index
Teradata HR Index B-I-C HR Index
2012
2013
The drop in the HR Index shows a declining contribution
from HR to Business value creation and a weakening of
Teradata’s competitive position against the Best-In-Class
SIMMETHOD Competitive Intelligence
HR View 2013
4/5/2014
WWW.SIMMETHOD.COM
30
-5
0
5
10
15
20
25
IBM Oracle SAP Teradata 2013 B-I-C
SIMMETHOD HR
Index
SIMMETHOD
Strategy
/Execution
Performance
Predictive Index
A high score on the 2013 Strategy & Execution
Performance Predictive Index is a leading
indicator of 2014 above average performance
SIMMETHOD Strategy & Execution
Performance Predictive Index
In summary, is the Strategy & Execution
Performance Predictive Index a good
leading indicator of Teradata’s 2014
threats, opportunities, risk and
performance?
4/5/2014
WWW.SIMMETHOD.COM
31
SIMMETHOD Strategy & Execution
Performance Predictive Index
TERADATA Trends and competitive intelligence
2012-2013 Same index performance Negative trend
2012-2013 Strategy & Execution
Performance Predictive Index same index
performance
Negative trend
2012-2013 Performance against the Best-
In-Class
Negative trend
2013 Strategy & Execution Performance
Predictive Index against peers
Positive
2013 Strategy & Execution Performance
Predictive Index against the Best-In-Class
Positive
4/5/2014
WWW.SIMMETHOD.COM
32
SIMMETHOD
Risk and Opportunities Alerts
• The SIMMETHOD algorithms review business
data and stockholders valuation-decisions
across business sectors and build industry-
agnostic indices in order to identify, measure,
correlate and predict your strengths,
weaknesses, risks and opportunities against
your current and potential future
competitors from inside or outside your
industry.
4/5/2014 33
WWW.SIMMETHOD.COM
SIMMETHOD
2014 Industry and Business Trends
• SIMMETHOD’s Strategy & Execution
Performance Predictive Indices and trends
are not deterministic. Businesses that act on
their leading indicators and risk alerts will
improve their 2014 performance as will be
shown in the forthcoming update of the
SIMMETHOD database, performance
predictive indices and correlations.
4/5/2014
WWW.SIMMETHOD.COM
34
SIMMETHOD
Risk and Opportunities Alerts
SIMMETHOD is in the top 1% of most
viewed in Slideshare and has been
“Hot” on LinkedIn, Twitter and
Facebook 47 times.
4/5/2014 WWW.SIMMETHOD.COM 35
Jorge Oscar Tabacman
jtabacman@gmail.com
Twitter ID: SIMMETHOD
SIMMETHOD
A New Way to Measure and Predict
the Risk and Performance of Your
Business and Alert You of New
Threats and Opportunities
4/5/2014 36WWW.SIMMETHOD.COM

Teradata case study

  • 1.
    SIMMETHOD A new wayto measure and predict your corporate risk and performance Is the SIMMETHOD Strategy & Execution Performance Predictive Index a strong leading indicator of Teradata’s future risk and performance? 4/5/2014 1 WWW.SIMMETHOD.COM
  • 2.
    SIMMETHOD Strategy &Execution Performance Predictive Index On April 2, Tiernan Ray wrote on Barron’s Tech Trader Daily: • “A bit of debate is underway about what to expect from enterprise Big Data technology provider Teradata amidst rising competition from open-source software Hadoop” 4/5/2014 2 WWW.SIMMETHOD.COM
  • 3.
    SIMMETHOD Strategy &Execution Performance Predictive Index • “Summit Research’s Srini Nandury reiterates a Buy rating, and a $58 price target, writing that the main issue for the company has been a slowdown in IT spending, not Hadoop, and that things are about to turn around for the company” 4/5/2014 WWW.SIMMETHOD.COM 3
  • 4.
    SIMMETHOD Strategy &Execution Performance Predictive Index • Cowen & Co’s Peter Goldmacher reiterates an underperform rating on Teradata shares, writing that Q1 results on May 1st may best street expectations, but that the rest of the year may disappoint” 4/5/2014 WWW.SIMMETHOD.COM 4
  • 5.
    SIMMETHOD • Is Teradataperformance predictable based on the SIMMETHOD Strategy and Execution Performance Predictive Indices? 4/5/2014 5WWW.SIMMETHOD.COM
  • 6.
    SIMMETHOD Risk and OpportunityAlerts 4/5/2014 WWW.SIMMETHOD.COM 6
  • 7.
    The Way WeMeasure Corporate Performance Is Broken Why do Businesses fail? Blockbuster Borders Circuit City Mervyns Wachovia Washington Mutual Linen n’ Things 4/5/2014 7WWW.SIMMETHOD.COM
  • 8.
    The CEO Lamentin the Business Analytics Market • We did not see it coming. All my Divisions and Product’s Analytics pointed North while my Business as a whole (in comparison to new competitors and the Best- In-Class in multiple industries) went South. 4/5/2014 8WWW.SIMMETHOD.COM
  • 9.
    Disrupting the WayWe Measure Corporate Risk and Performance There are three main problems: • The lack of a single industry-agnostic scale to measure and predict corporate strategy & execution (competitive advantage) leads to erroneous and inconsistent C-level visibility and decision-making 4/5/2014 9WWW.SIMMETHOD.COM
  • 10.
    Disrupting the WayWe Measure Corporate Risk and Performance • Silos-analytics and leading indicators that lead to erroneous C-level decisions based on many versions of the truth unintegrated to business strategy and objectives 4/5/2014 10WWW.SIMMETHOD.COM
  • 11.
    Disrupting the WayWe Measure Corporate Risk and Performance • C-level risk and performance metrics and ratios based on industrial-era analytics that were not designed to capture intangible values or the dynamic relationships between businesses and their value chains 4/5/2014 11WWW.SIMMETHOD.COM
  • 12.
    Silos Analytics Leadto Many Versions of the Truth and Erroneous Decisions 4/5/2014 12 WWW.SIMMETHOD.COM
  • 13.
    4/5/2014 WWW.SIMMETHOD.COM 13 Lack of Businessand Value-Chain Leading Indicators and Risk Alerts Company view SIMMETHOD™ industry view indicators & alerts SIMMETHOD™ value-chain view, leading performance indicators & alerts SIMMETHOD™ global market view leading risk/ performance indicators & alerts database Inward- Looking Analytics Maximum Risk, Minimum Visibility Value-Chain and Market Leading Indicators and Risk Alerts Minimum Risk and Maximum Visibility
  • 14.
    The Leading Indicatorsand Risk Alerts of the Best-In-Class Why do you need Industry Agnostic Leading indicators and Risk/Opportunities Alerts? • In an interdependent Market (like the Planets in the solar system) your current and future risk and performance are impacted by an ecosystem of constantly changing competitors coming from inside and outside your Industry. 4/5/2014 WWW.SIMMETHOD.COM 14
  • 15.
    Your Gap toSIMMETHOD’s Best-In-Class Determines Your Risk and Performance Your current position against the B-I-C and competitors Gap to B-I-C in your industry Gap to Competitors in a range of industries Gap to B-I-C in a range of industries Your original targets against SIMMETHOD Database 4/5/2014 15 WWW.SIMMETHOD.COM
  • 16.
    SIMMETHOD’s Disclaimer • Thepurpose of the SIMMETHOD Strategy/Execution Performance Predictive Index, Reports and Risk/Opportunities Alerts is not to make a Business right or wrong but rather contribute towards the understanding of management actions in comparison to industry peers and the SIMMETHOD Best-In- Class. 4/5/2014 WWW.SIMMETHOD.COM 16
  • 17.
    SIMMETHOD’s Disclaimer • SIMMETHOD’sStrategy/Execution Performance Predictive indices, metrics and risk/opportunities alerts do not seek to be exact but rather serve as a conduit to ask better questions and seek better answers in the performance improvement, risk minimization and value creation journey. 4/5/2014 WWW.SIMMETHOD.COM 17
  • 18.
    SIMMETHOD’s Disclaimer • Sometimes,the value of a metric in itself does not provide the greatest of insights, but valuable actionable knowledge is gained from its ability to provide a trend or a common comparison yardstick with other Businesses across a range of industries. 4/5/2014 WWW.SIMMETHOD.COM 18
  • 19.
    SIMMETHOD’s Disclaimer • Thisreport is for informational purpose only and SIMMETHOD shall not be liable for the contents of the report or risk/opportunities alerts or for any damage incurred or alleged to be incurred to any of the Businesses included in the Report as a result of its content 4/5/2014 WWW.SIMMETHOD.COM 19
  • 20.
    SIMMETHOD • Is Teradataperformance predictable based on the SIMMETHOD Strategy and Execution Performance Predictive Indices? 4/5/2014 20WWW.SIMMETHOD.COM
  • 21.
    SIMMETHOD’s C-Level IndicesBusiness Trends 2012-2013 Teradata and the Best-In-Class The following C-Level indices show Teradata’s ability to: • Strategize and execute against the SIMMETHOD Best-In-Class • Compete against the Best-In-Class and current and future competitors and are leading indicators of future business opportunities, risk and performance 4/5/2014 21 WWW.SIMMETHOD.COM
  • 22.
    SIMMETHOD’s C-Level IndicesBusiness Trends 2012-2013 Teradata and the Best-In-Class • When the Best-In-Class and your SIMMETHOD C-Level indices are moving in opposite directions your ability to compete weakens in proportion to your widening gap to the Best-In-Class 4/5/2014 WWW.SIMMETHOD.COM 22
  • 23.
    SIMMETHOD’s C-Level Indices BusinessTrends 2012-2013 Teradata and the Best-In-Class 4/5/2014 WWW.SIMMETHOD.COM 23 0 5 10 15 20 25 30 35 40 SIMMETHOD Management Controllable Resources index SIMMETHOD Value Creation Index SIMMETHOD Minimum Company Business Model index SIMMETHOD Strategy & Execution Performance Predictive Index Teradata 2012 Teradata 2013 Average 2013 Best-In-Class Although still positive and above average, every C-level index is pointing south from an historical trend and against the Best-In-Class point of views. Will the trend be reversed in 2014?
  • 24.
    SIMMETHOD’s C-Level IndicesBusiness Trends 2012-2013 Teradata and the Best-In-Class • What are Teradata’s strengths and weaknesses in relation to its peers and the SIMMETHOD Best-In-Class and what are the areas that need to be improved to narrow the gap to 2014 Best-in-Class performance? 4/5/2014 WWW.SIMMETHOD.COM 24
  • 25.
    SIMMETHOD’s Business TrendsAcross the Major Indices – 2012 to 2013 4/5/2014 WWW.SIMMETHOD.COM 25 -5 0 5 10 15 20 25 30 35 40 Teradata 2012 Teradata 2013 Negative trends in the Sales, Overheads, HR and Cash/debt indices have contributed to a lost of competitive advantage against peers and the Best-In-Class
  • 26.
    SIMMETHOD Competitive Intelligence Abilityto Strategize and Execute Against Peers 4/5/2014 WWW.SIMMETHOD.COM 26 Teradata Oracle SAP IBM -5 0 5 10 15 20 C-Level view of risk and performance against peers Teradata Oracle SAP IBM
  • 27.
    SIMMETHOD Industry andBusiness Trends Sales and Marketing contribution to Business Value 2012 to 2013 4/5/2014 WWW.SIMMETHOD.COM 27 -5 0 5 10 15 20 25 30 35 40 Teradata Strategy & Execution Performance Predictive Index B-I-C Strategy & Execution Performance Predictive Index Teradata Sales Index B-I-C Sales Index 2012 2013 The drop in Teradata’s Sales index shows a decreased contribution of Teradata’s sales to value creation and a weakened competitive position against the Best-in-Class
  • 28.
    SIMMETHOD Competitive Intelligence Salesand Marketing View 4/5/2014 WWW.SIMMETHOD.COM 28 -5 0 5 10 15 20 IBM Oracle SAP Teradata 2013 B-I-C SIMMETHOD Sales Index SIMMETHOD Strategy /Execution Performance Predictive Index Although its Sales Index has underperformed the B-I-C, other indices have contributed to Teradata’s above average Strategy & Execution Performance Predictive Index
  • 29.
    SIMMETHOD™ Industry andBusiness Trends HR contribution to Business Value 2012 to 2013 4/5/2014 WWW.SIMMETHOD.COM 29 0 5 10 15 20 25 30 35 40 Teradata Strategy & Execution Performance Predictive Index B-I-C Strategy & Execution Performance Predictive Index Teradata HR Index B-I-C HR Index 2012 2013 The drop in the HR Index shows a declining contribution from HR to Business value creation and a weakening of Teradata’s competitive position against the Best-In-Class
  • 30.
    SIMMETHOD Competitive Intelligence HRView 2013 4/5/2014 WWW.SIMMETHOD.COM 30 -5 0 5 10 15 20 25 IBM Oracle SAP Teradata 2013 B-I-C SIMMETHOD HR Index SIMMETHOD Strategy /Execution Performance Predictive Index A high score on the 2013 Strategy & Execution Performance Predictive Index is a leading indicator of 2014 above average performance
  • 31.
    SIMMETHOD Strategy &Execution Performance Predictive Index In summary, is the Strategy & Execution Performance Predictive Index a good leading indicator of Teradata’s 2014 threats, opportunities, risk and performance? 4/5/2014 WWW.SIMMETHOD.COM 31
  • 32.
    SIMMETHOD Strategy &Execution Performance Predictive Index TERADATA Trends and competitive intelligence 2012-2013 Same index performance Negative trend 2012-2013 Strategy & Execution Performance Predictive Index same index performance Negative trend 2012-2013 Performance against the Best- In-Class Negative trend 2013 Strategy & Execution Performance Predictive Index against peers Positive 2013 Strategy & Execution Performance Predictive Index against the Best-In-Class Positive 4/5/2014 WWW.SIMMETHOD.COM 32
  • 33.
    SIMMETHOD Risk and OpportunitiesAlerts • The SIMMETHOD algorithms review business data and stockholders valuation-decisions across business sectors and build industry- agnostic indices in order to identify, measure, correlate and predict your strengths, weaknesses, risks and opportunities against your current and potential future competitors from inside or outside your industry. 4/5/2014 33 WWW.SIMMETHOD.COM
  • 34.
    SIMMETHOD 2014 Industry andBusiness Trends • SIMMETHOD’s Strategy & Execution Performance Predictive Indices and trends are not deterministic. Businesses that act on their leading indicators and risk alerts will improve their 2014 performance as will be shown in the forthcoming update of the SIMMETHOD database, performance predictive indices and correlations. 4/5/2014 WWW.SIMMETHOD.COM 34
  • 35.
    SIMMETHOD Risk and OpportunitiesAlerts SIMMETHOD is in the top 1% of most viewed in Slideshare and has been “Hot” on LinkedIn, Twitter and Facebook 47 times. 4/5/2014 WWW.SIMMETHOD.COM 35
  • 36.
    Jorge Oscar Tabacman jtabacman@gmail.com TwitterID: SIMMETHOD SIMMETHOD A New Way to Measure and Predict the Risk and Performance of Your Business and Alert You of New Threats and Opportunities 4/5/2014 36WWW.SIMMETHOD.COM