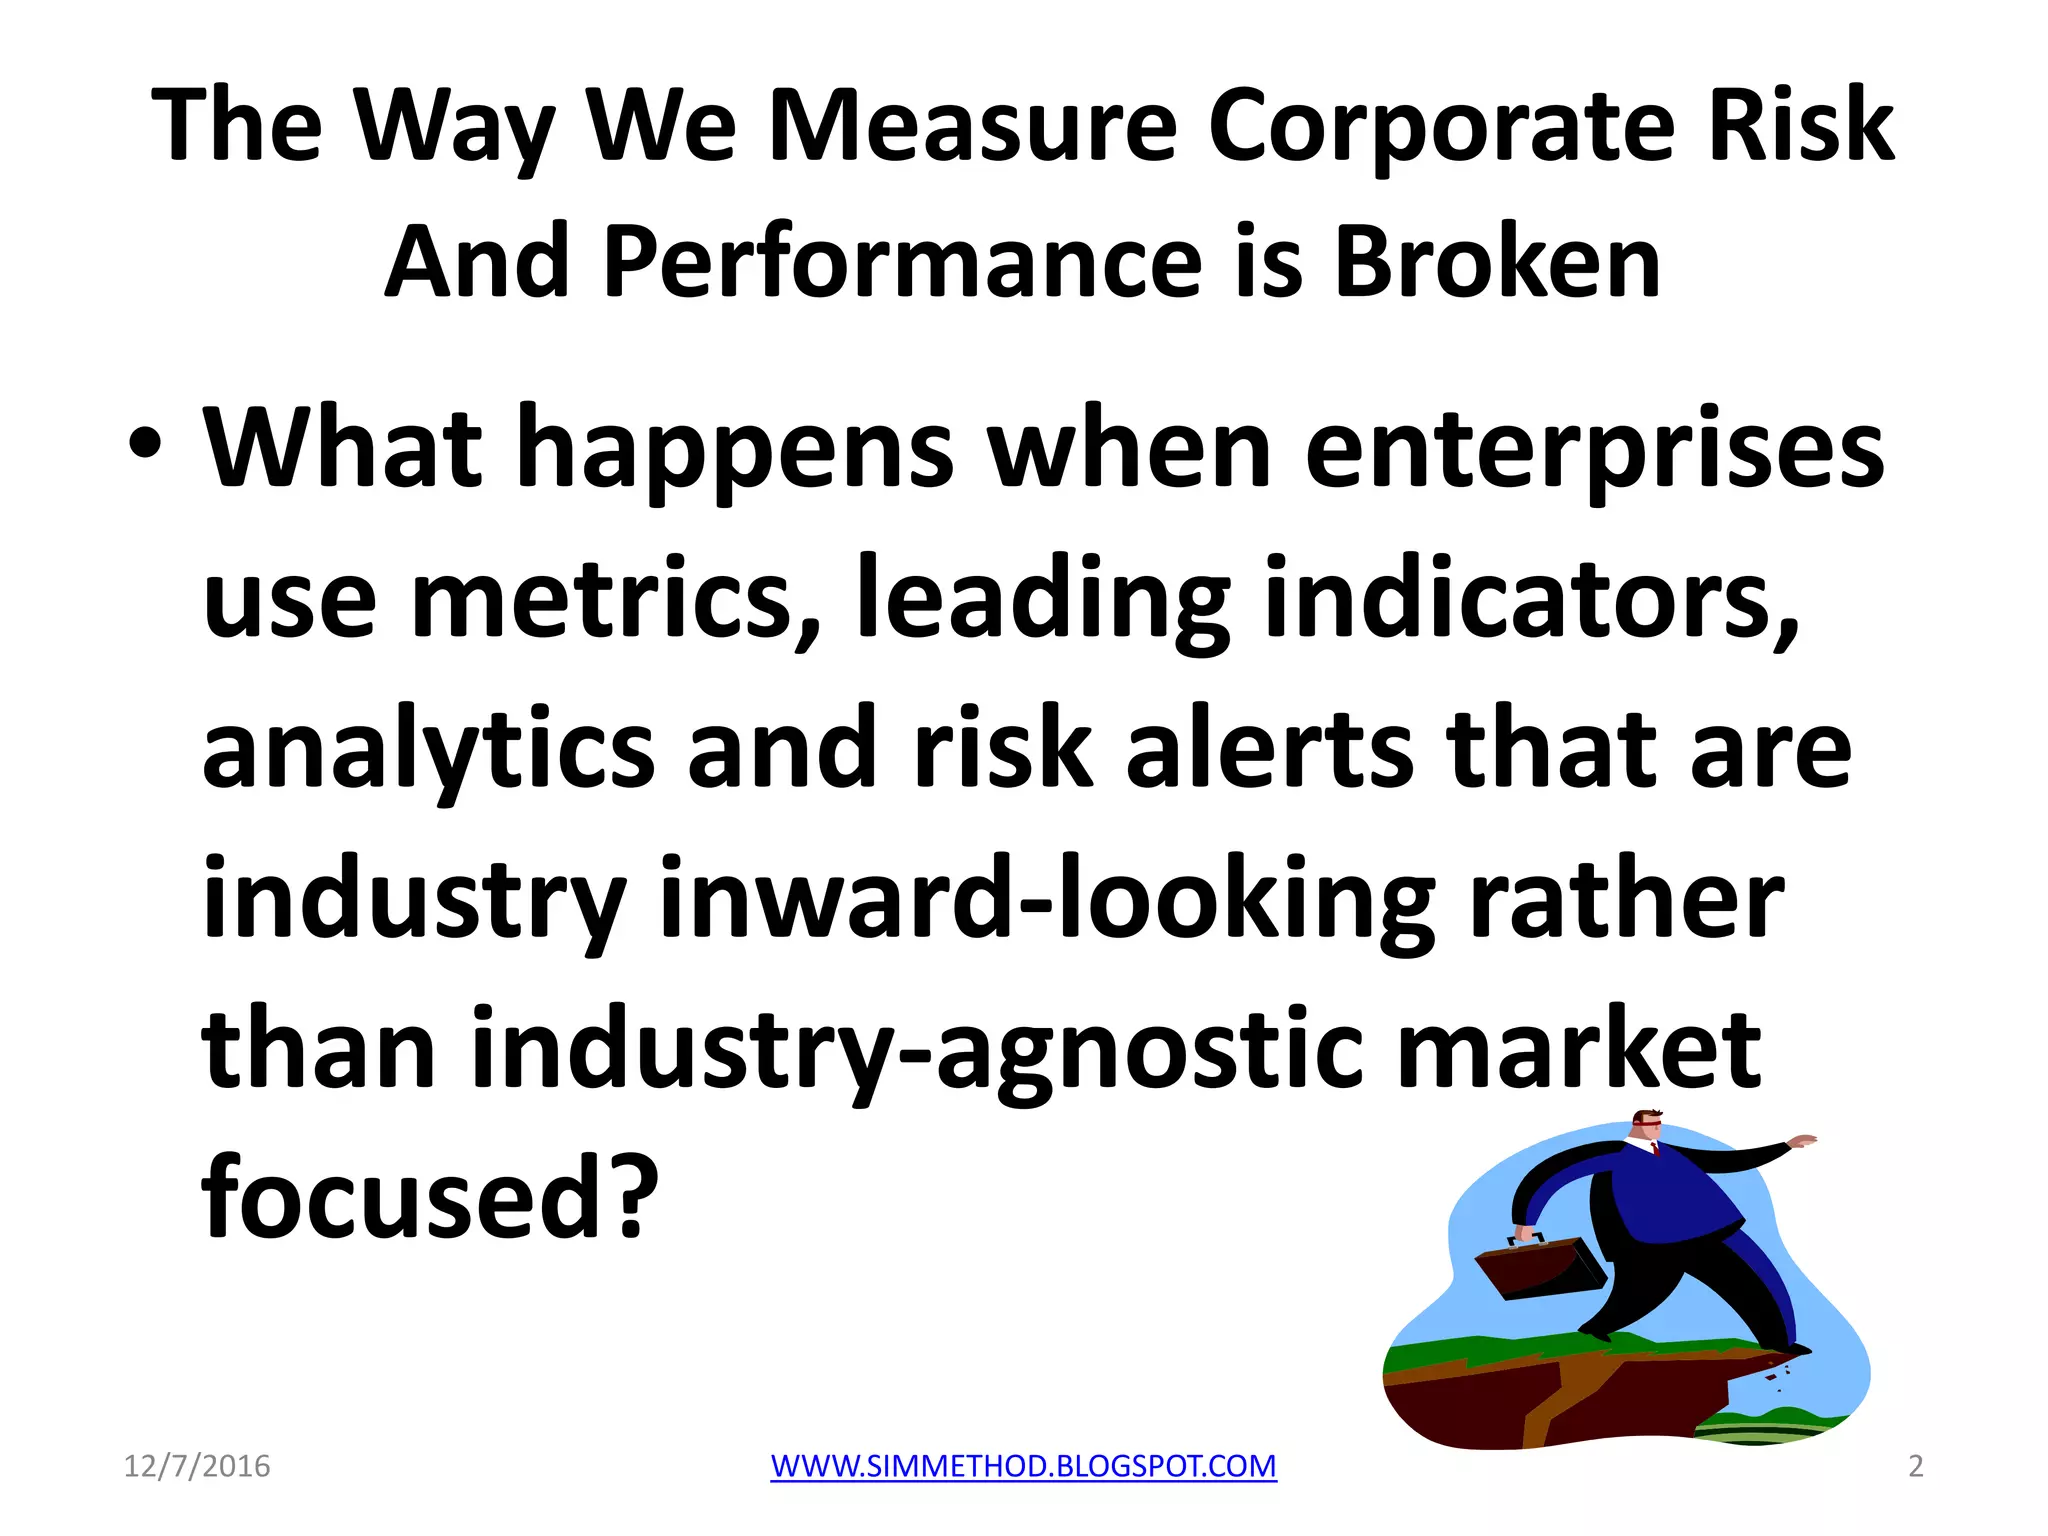
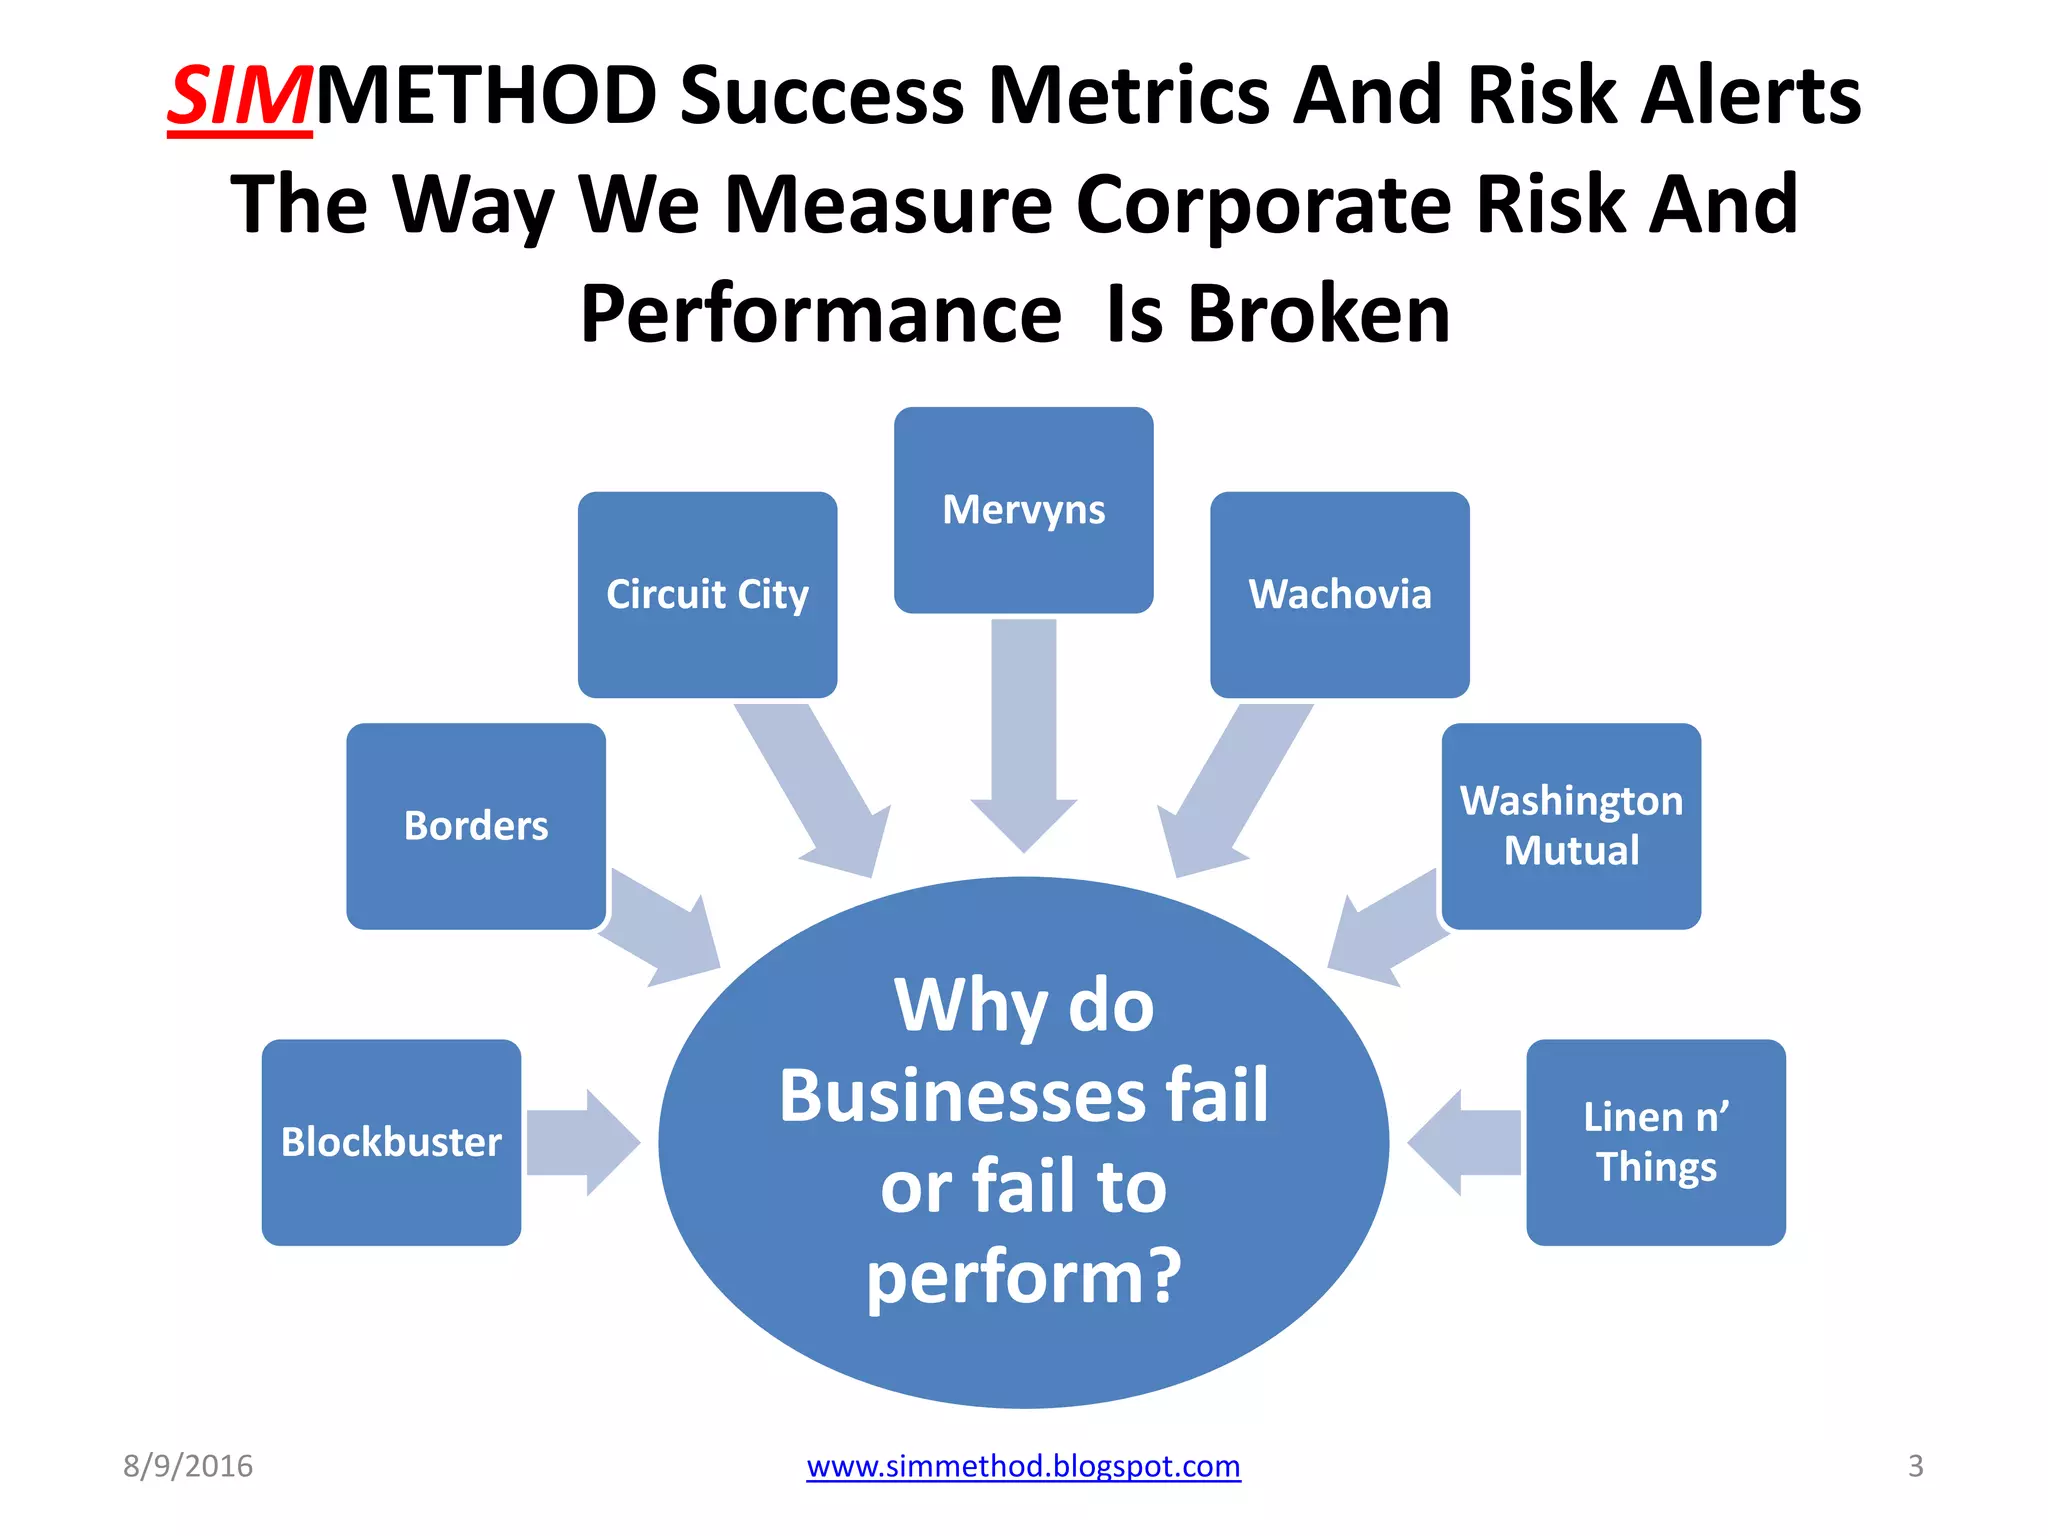
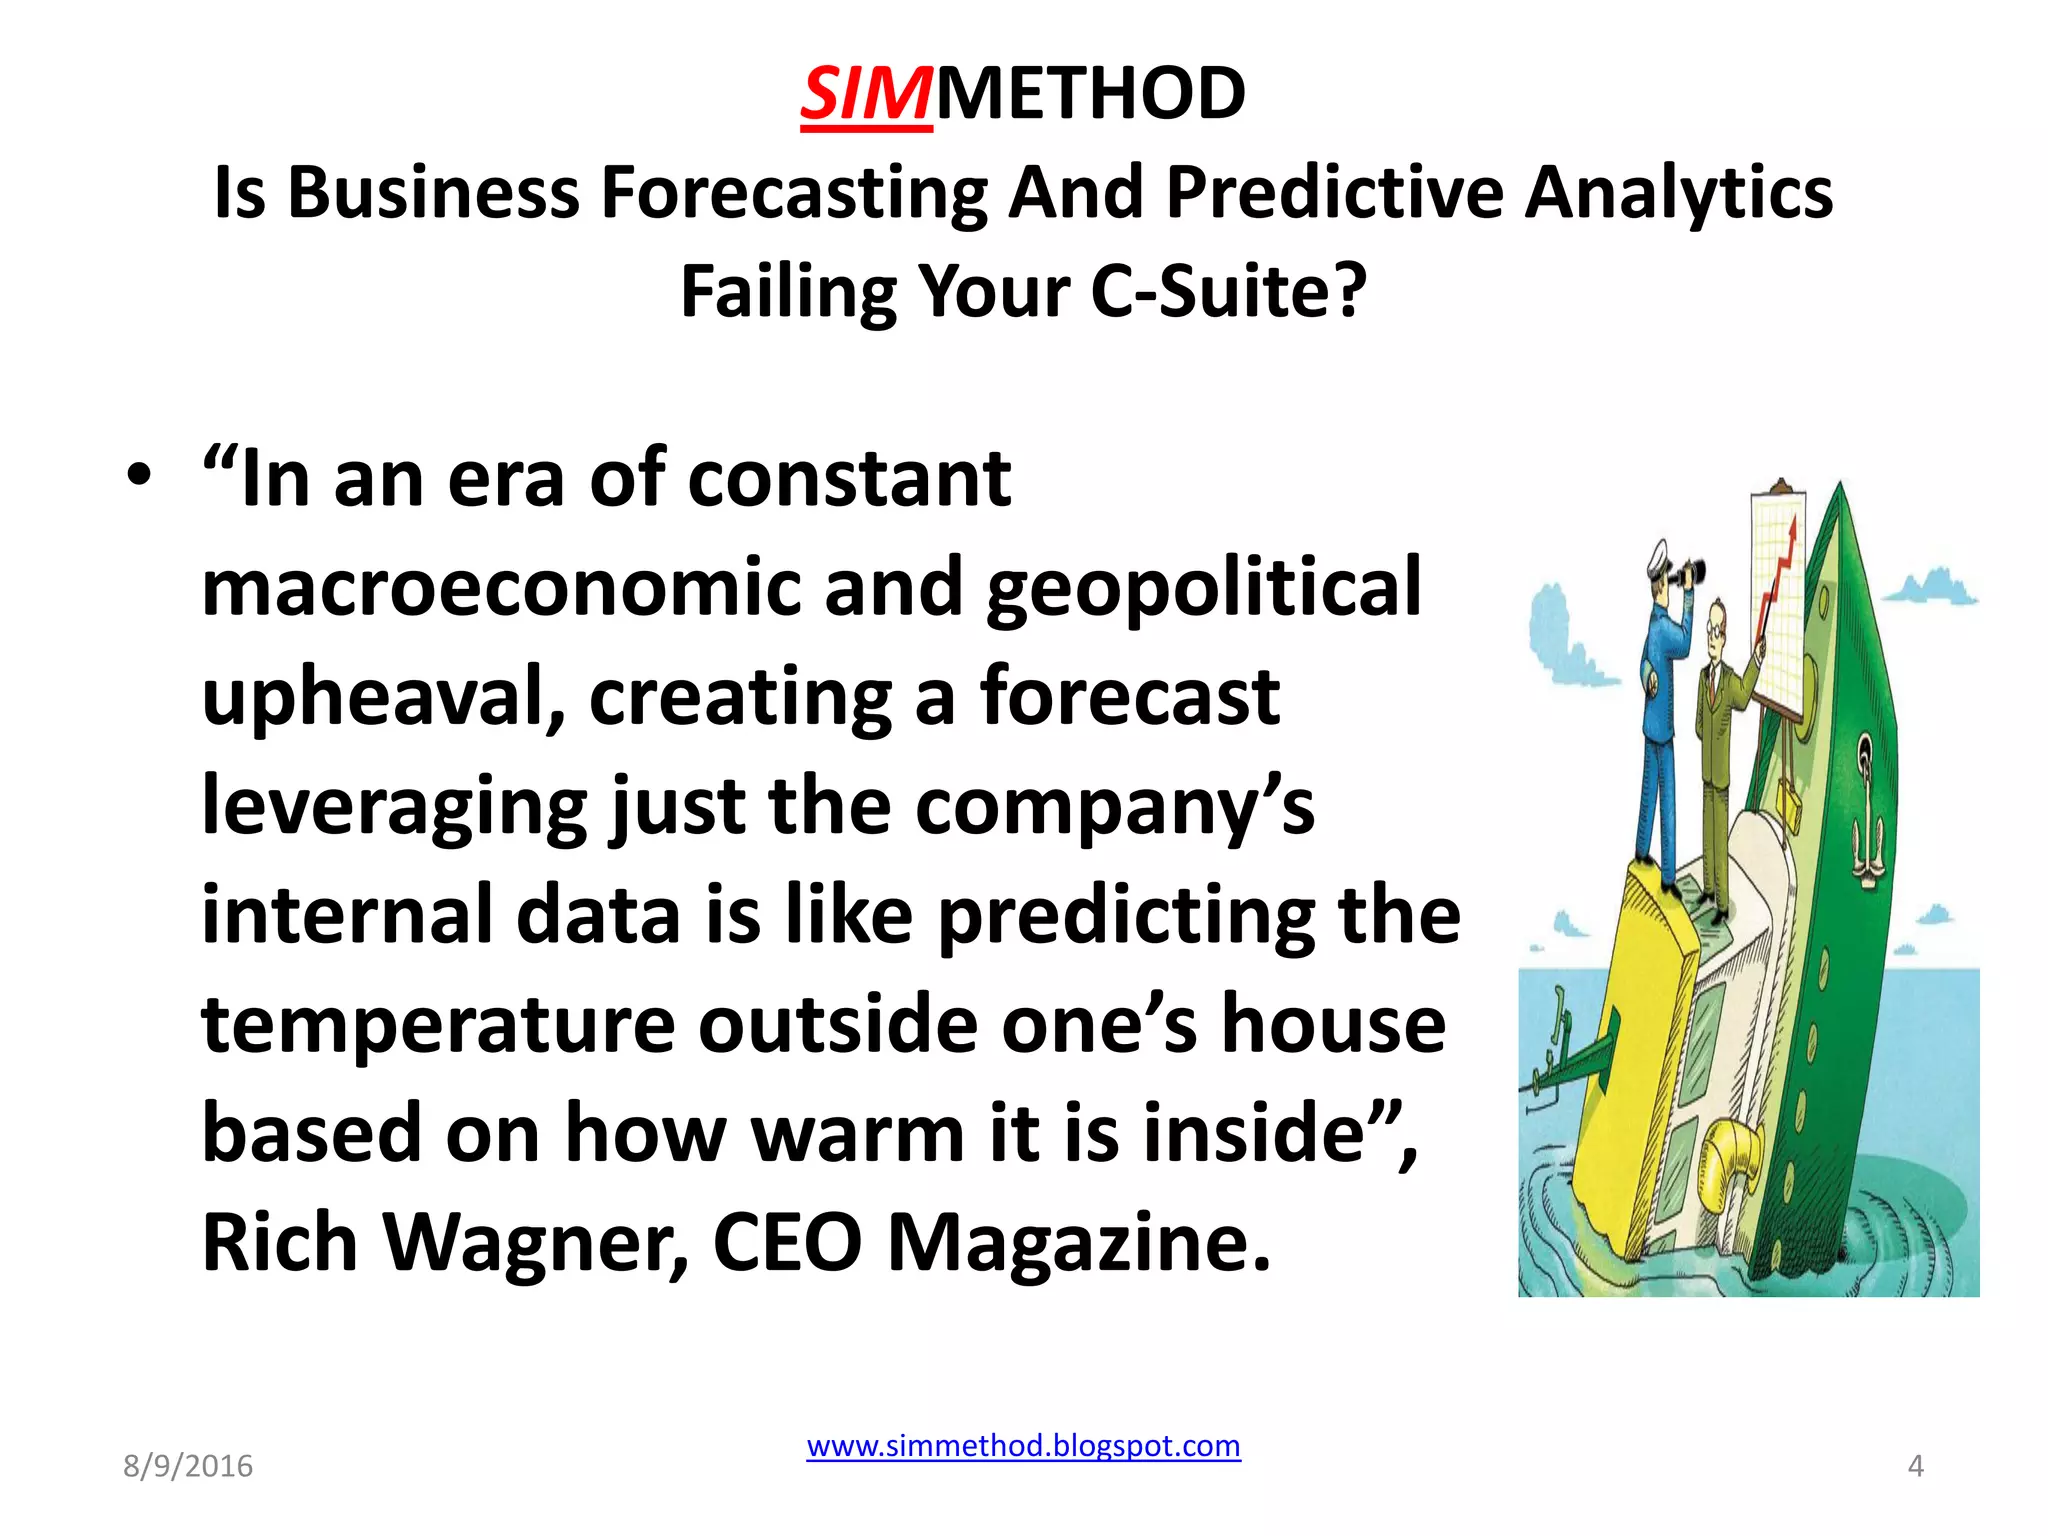
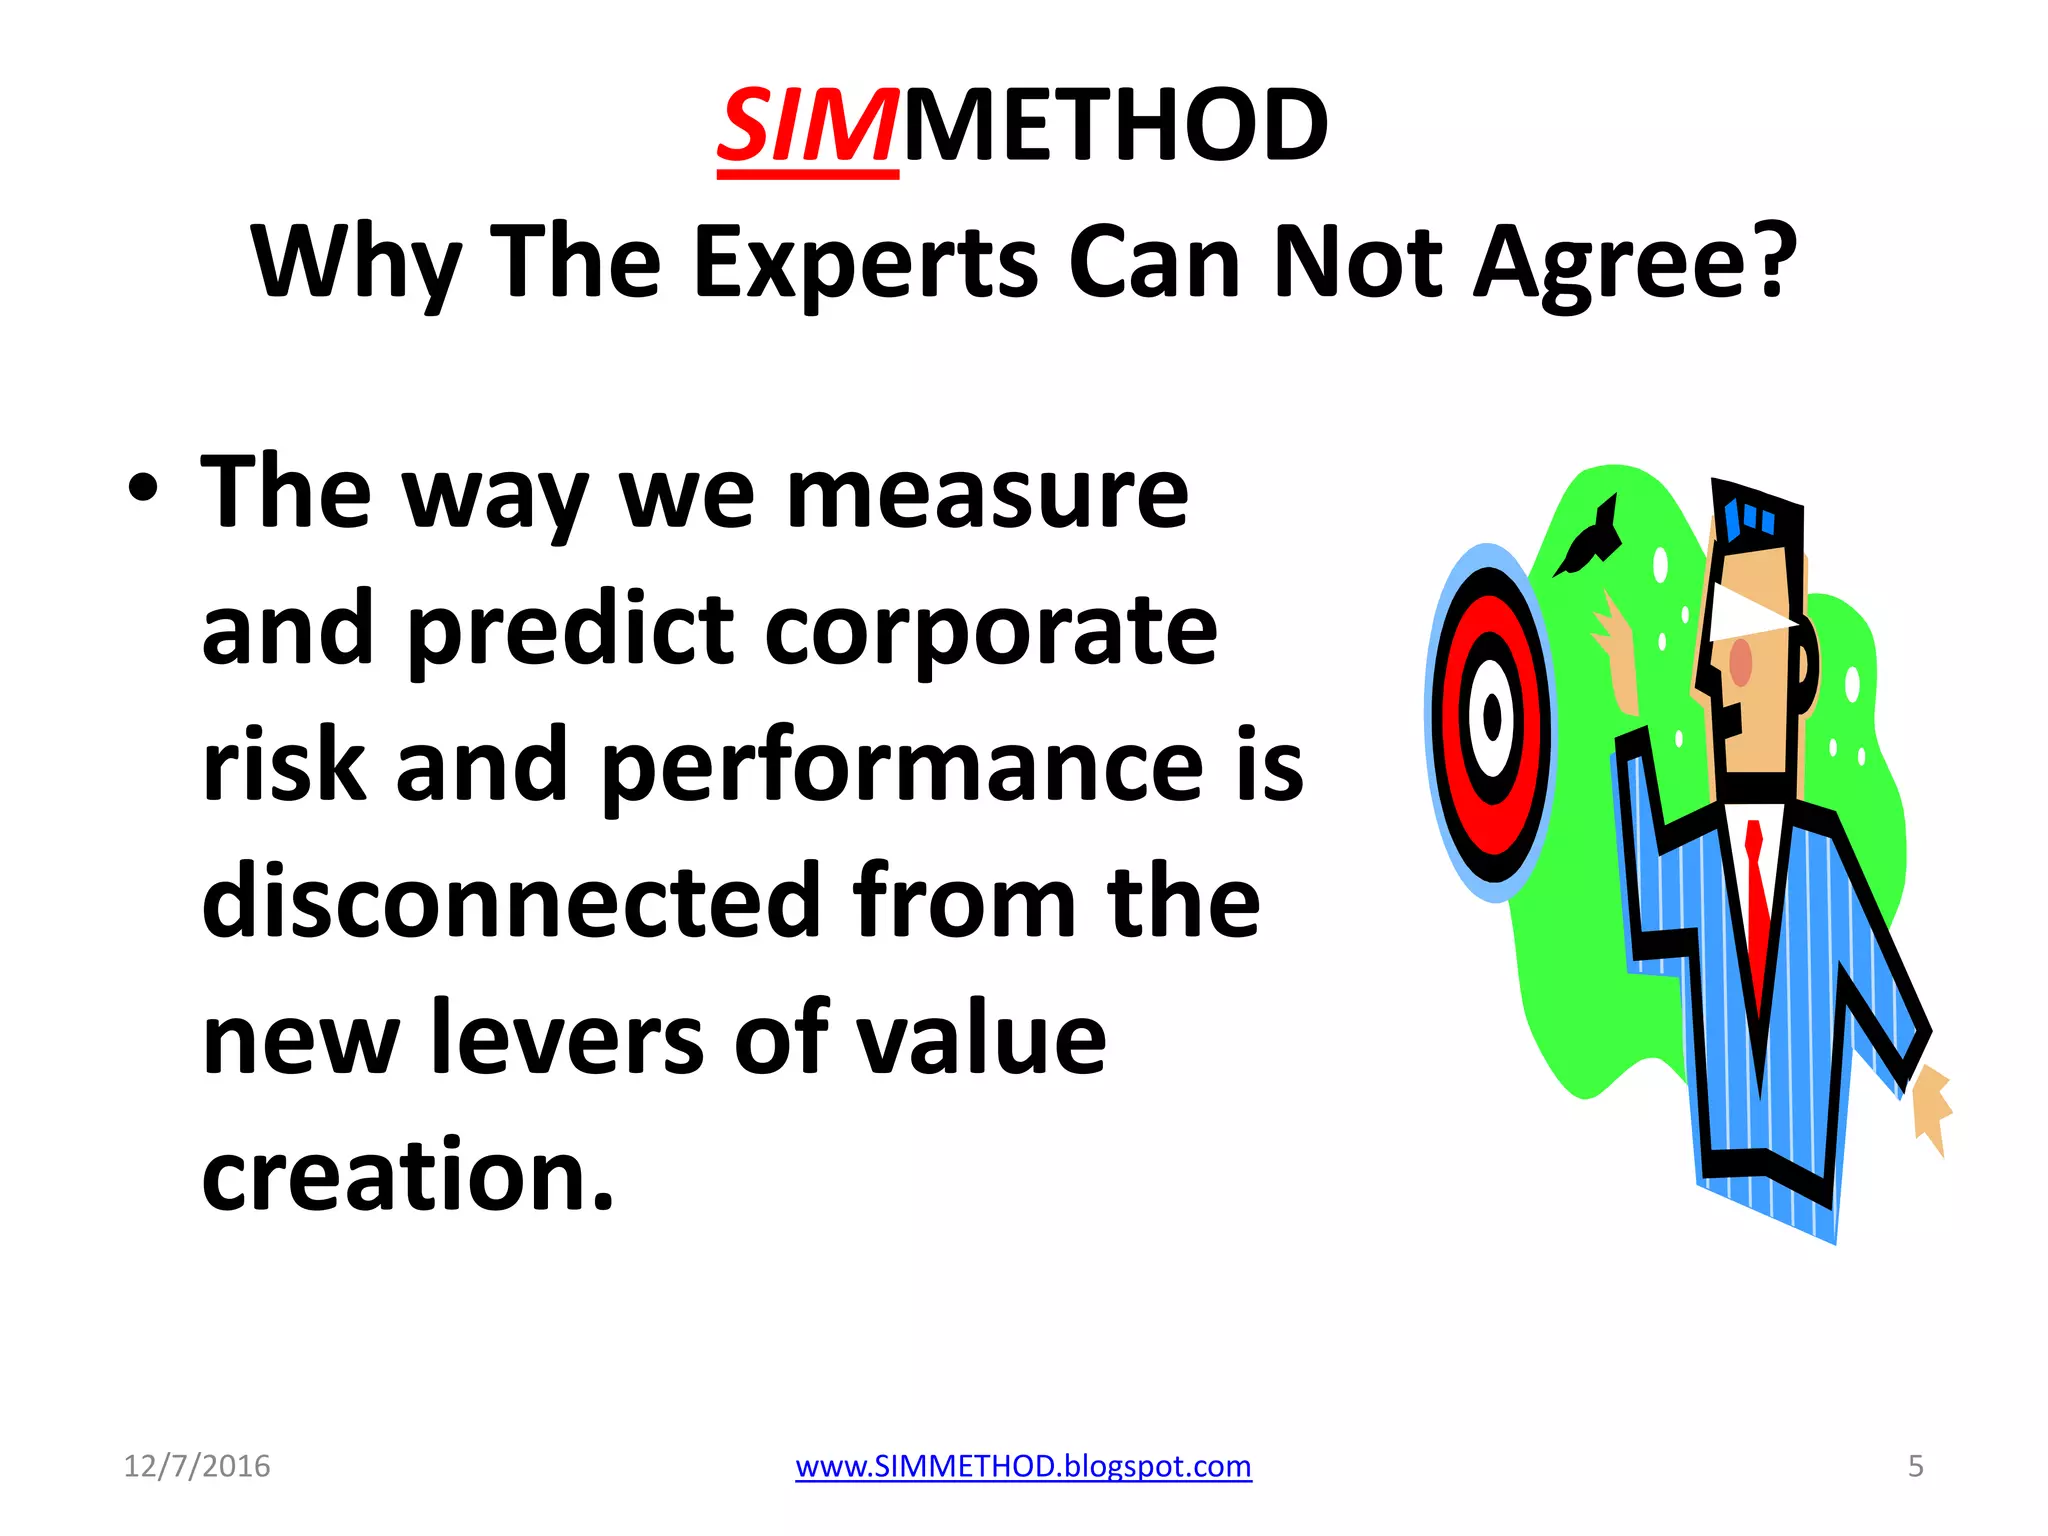
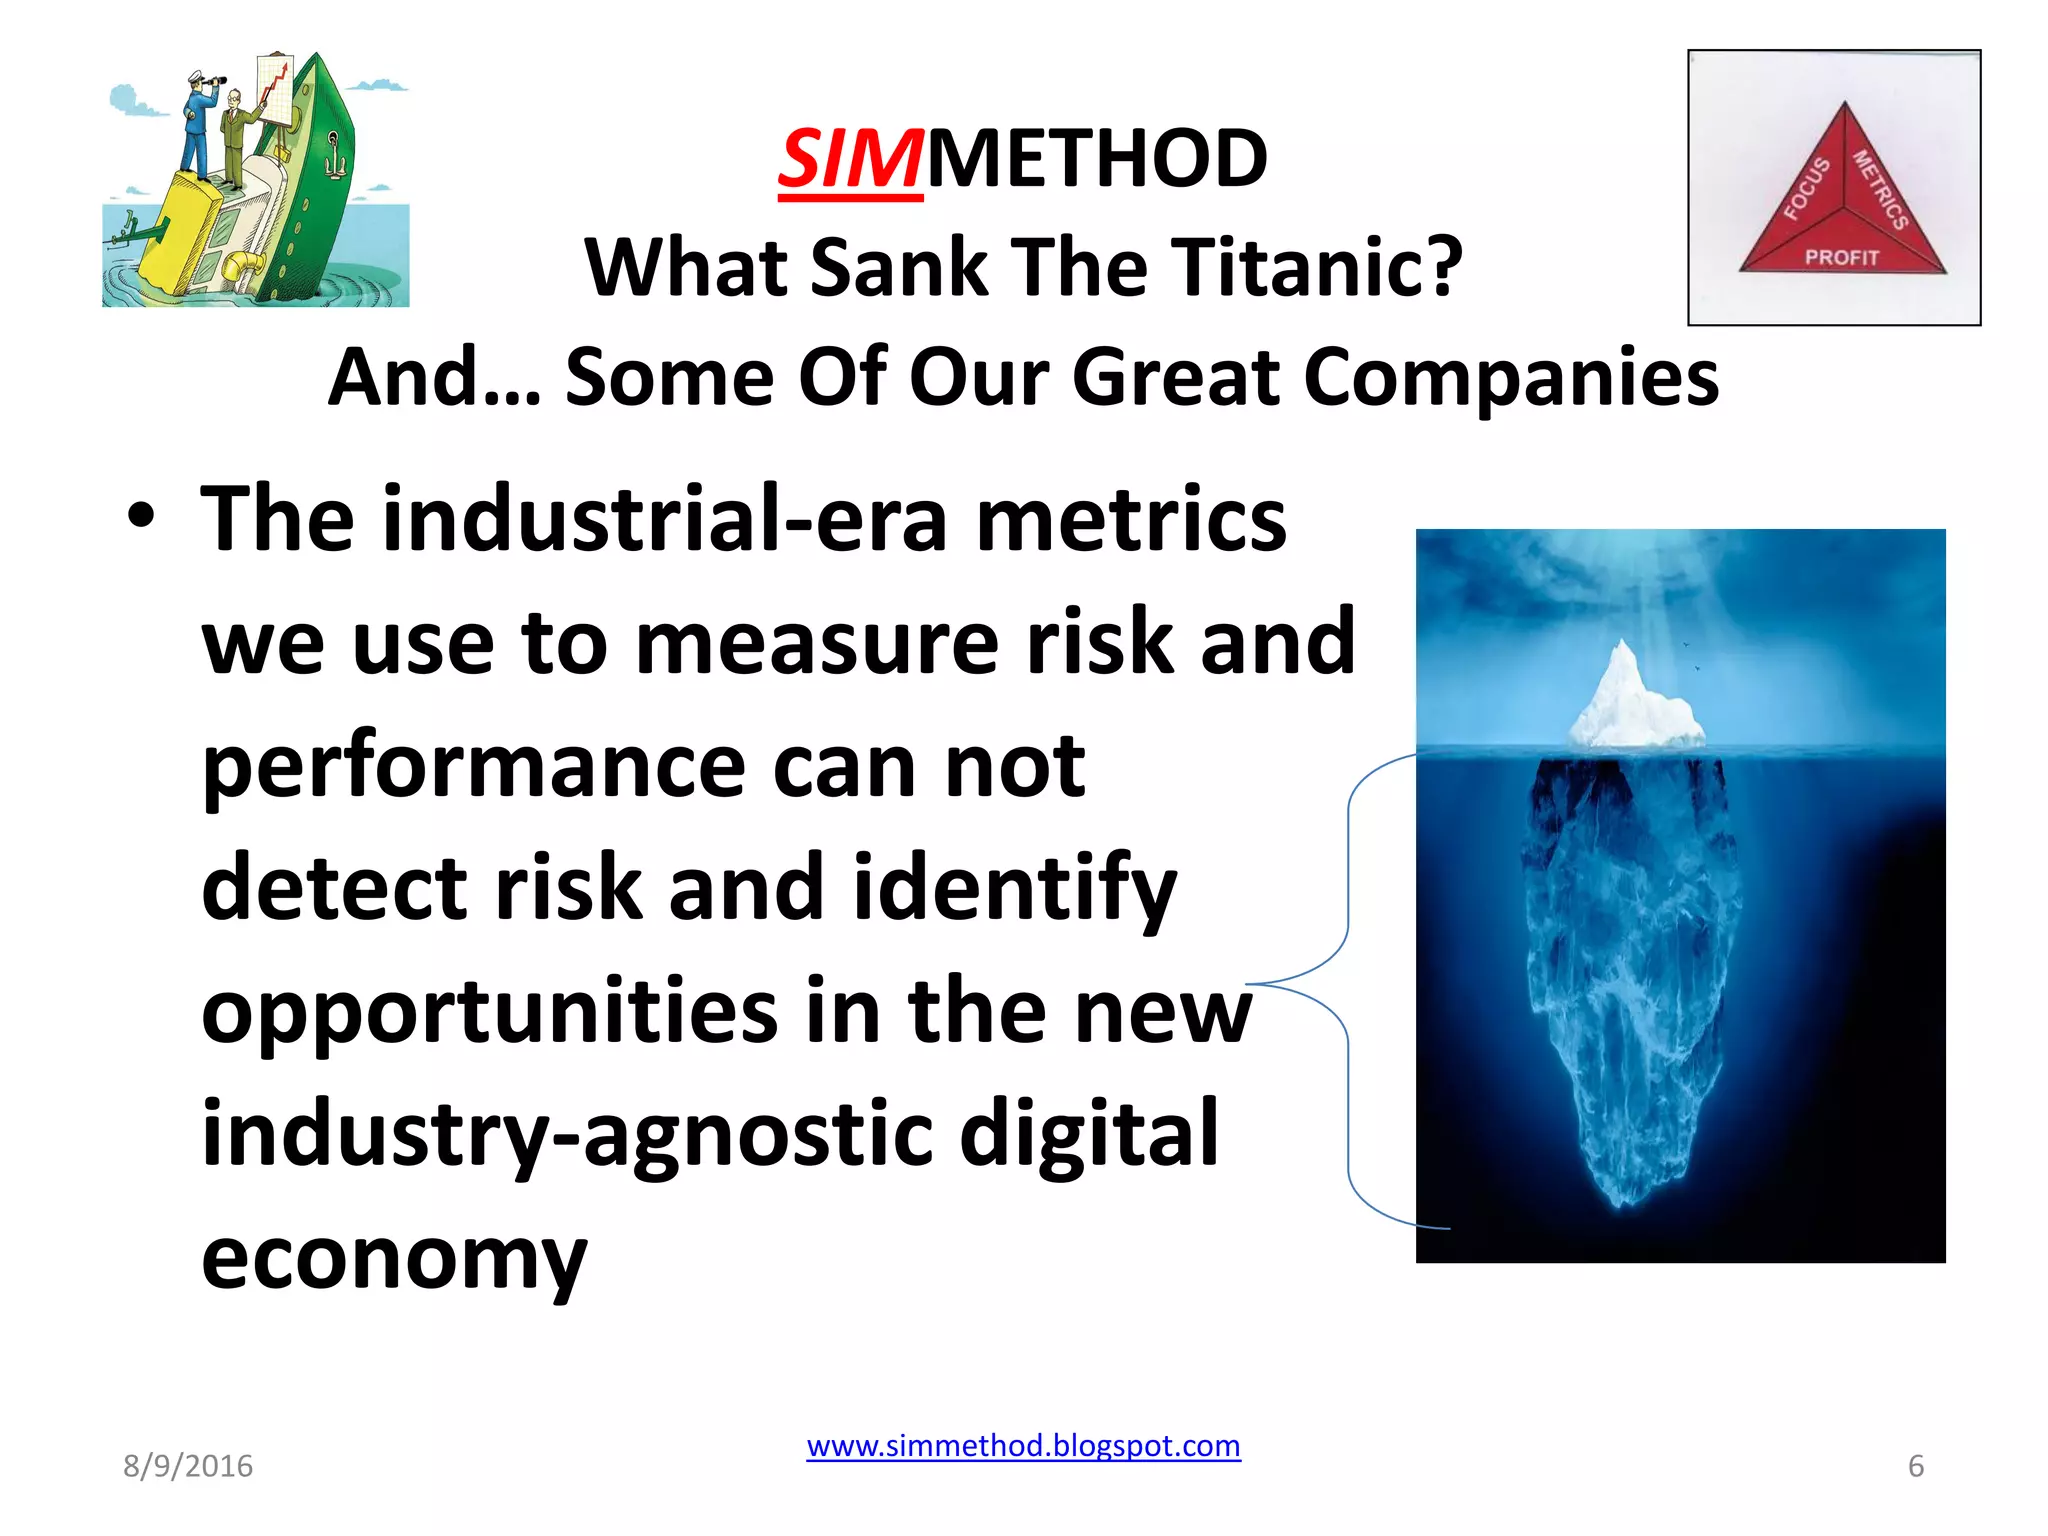
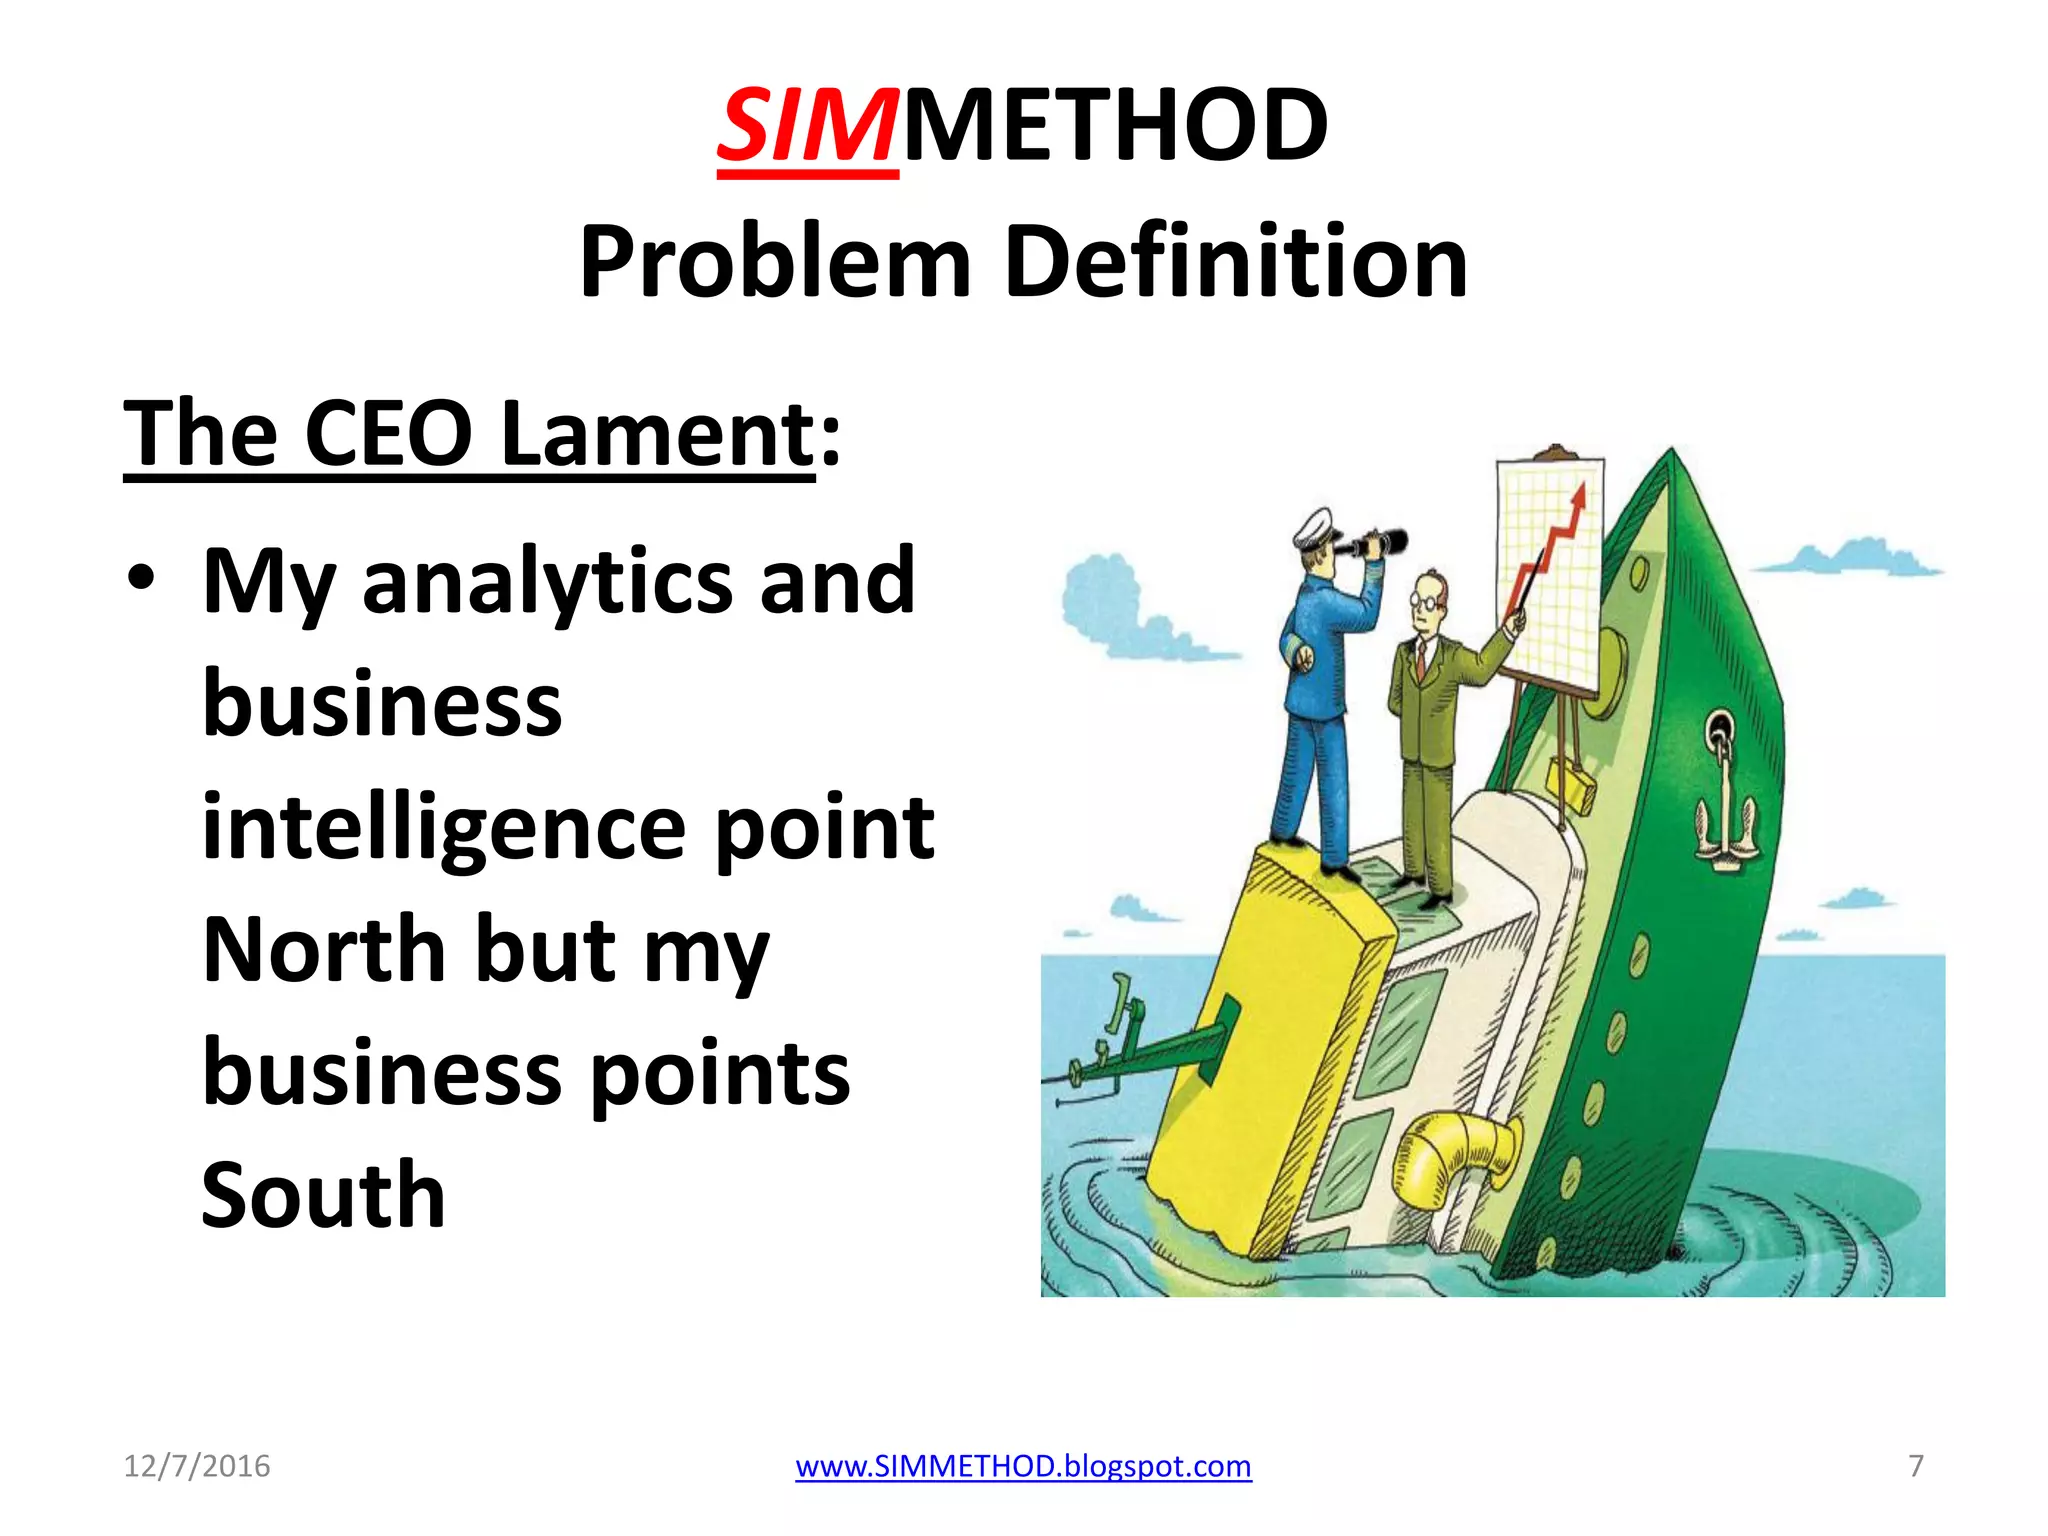
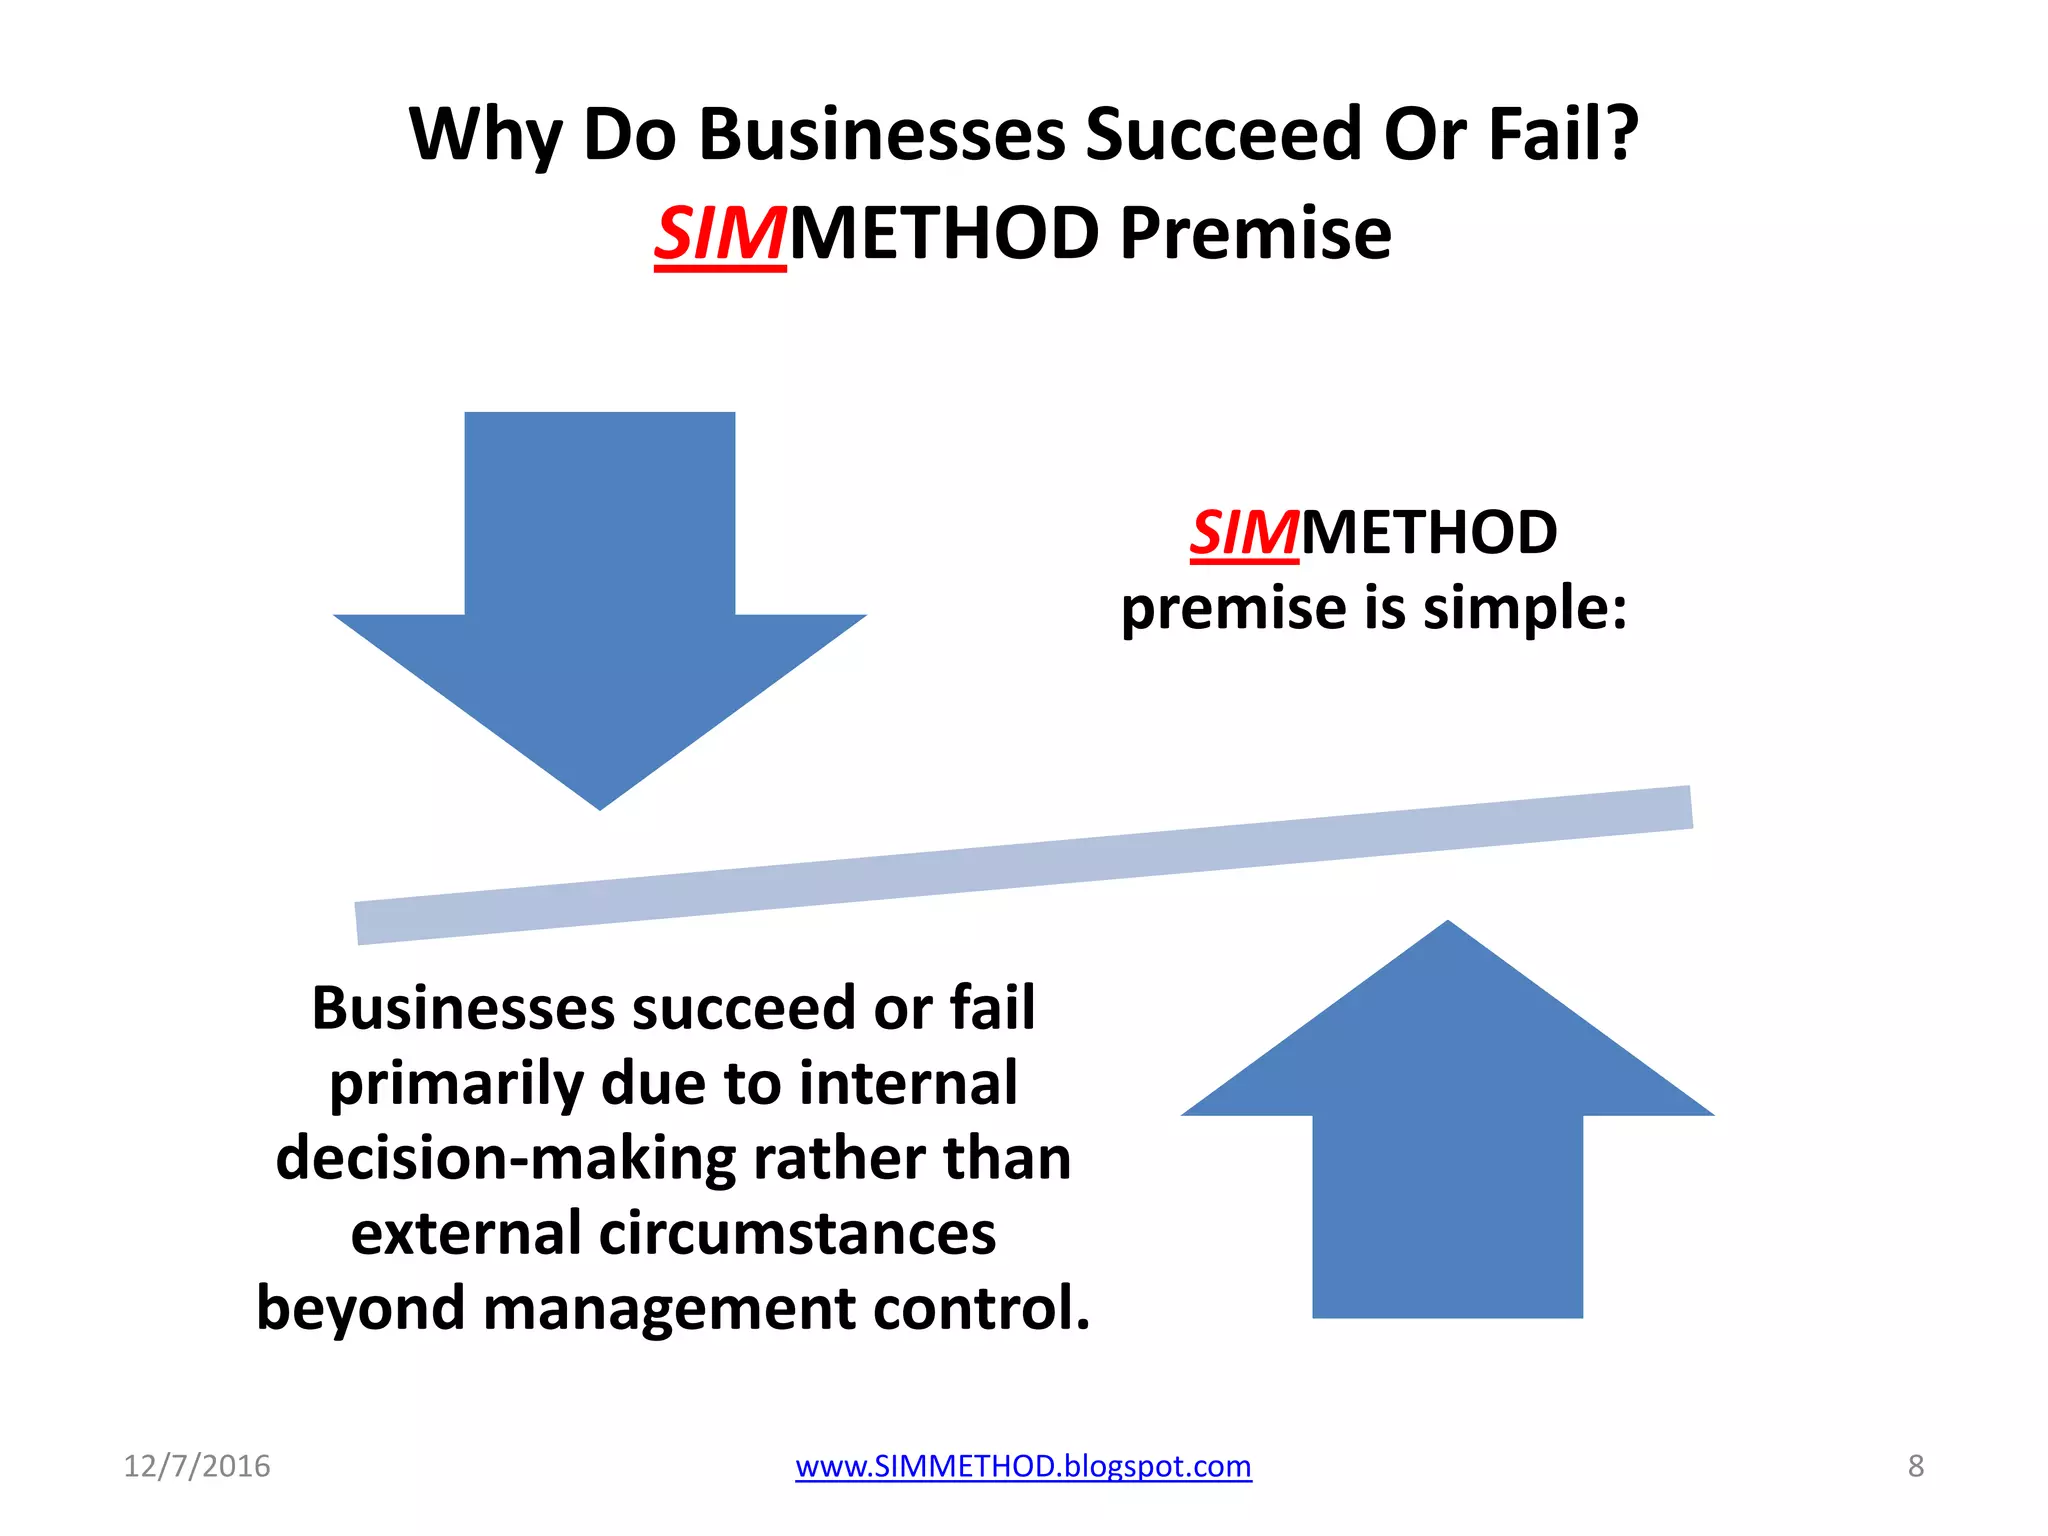
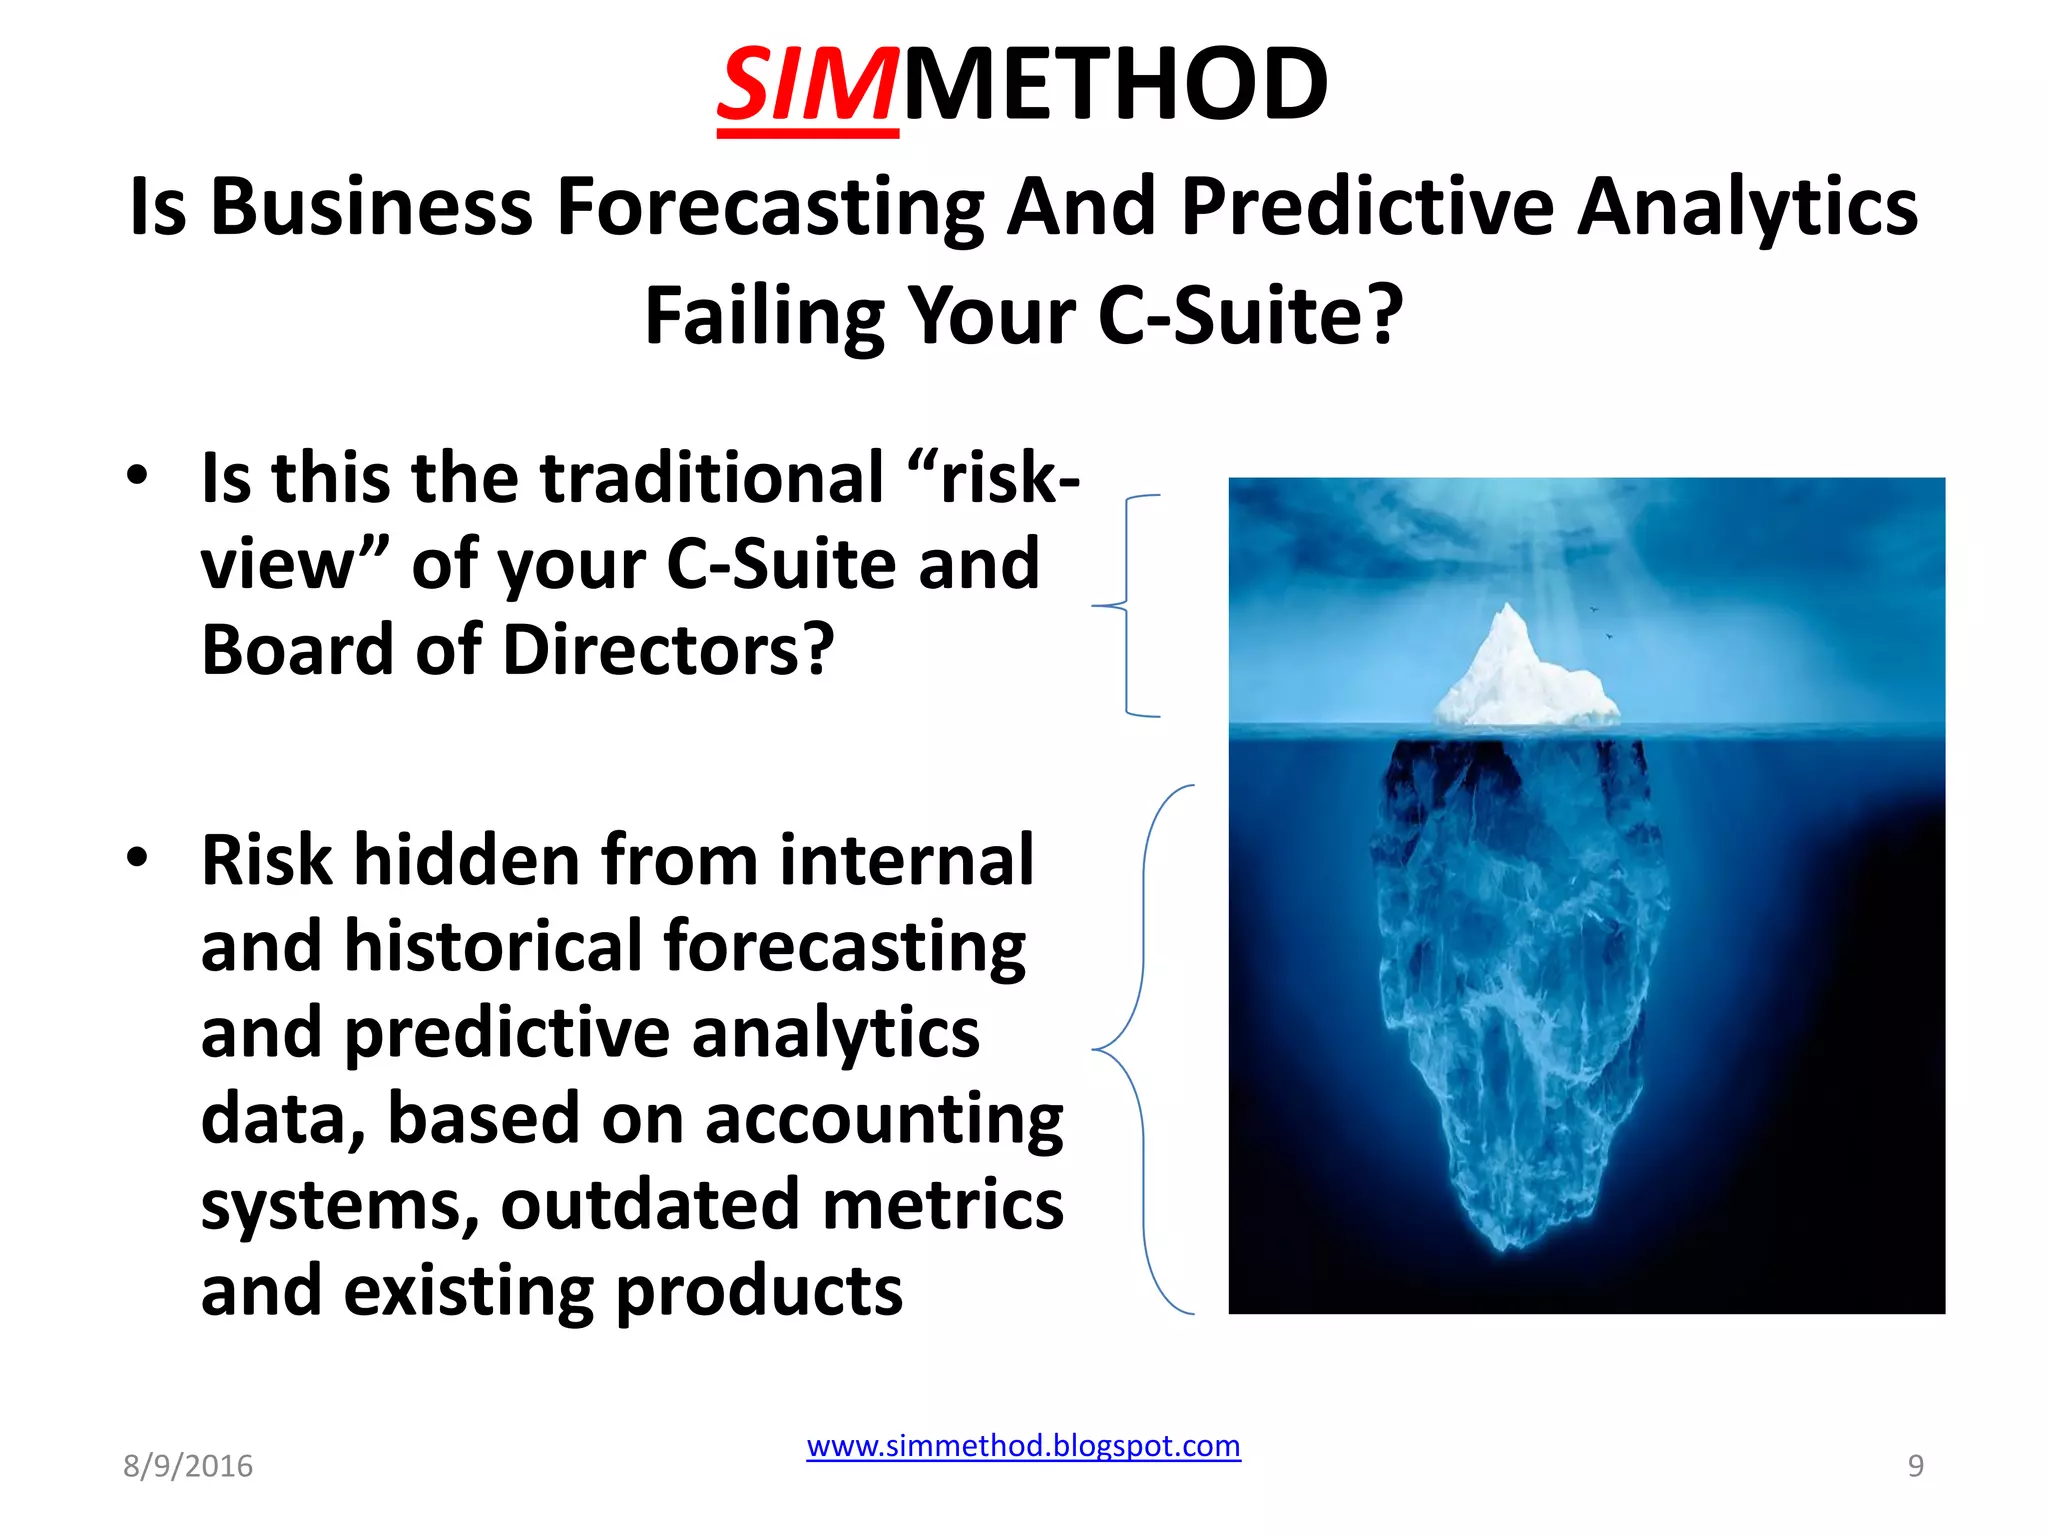
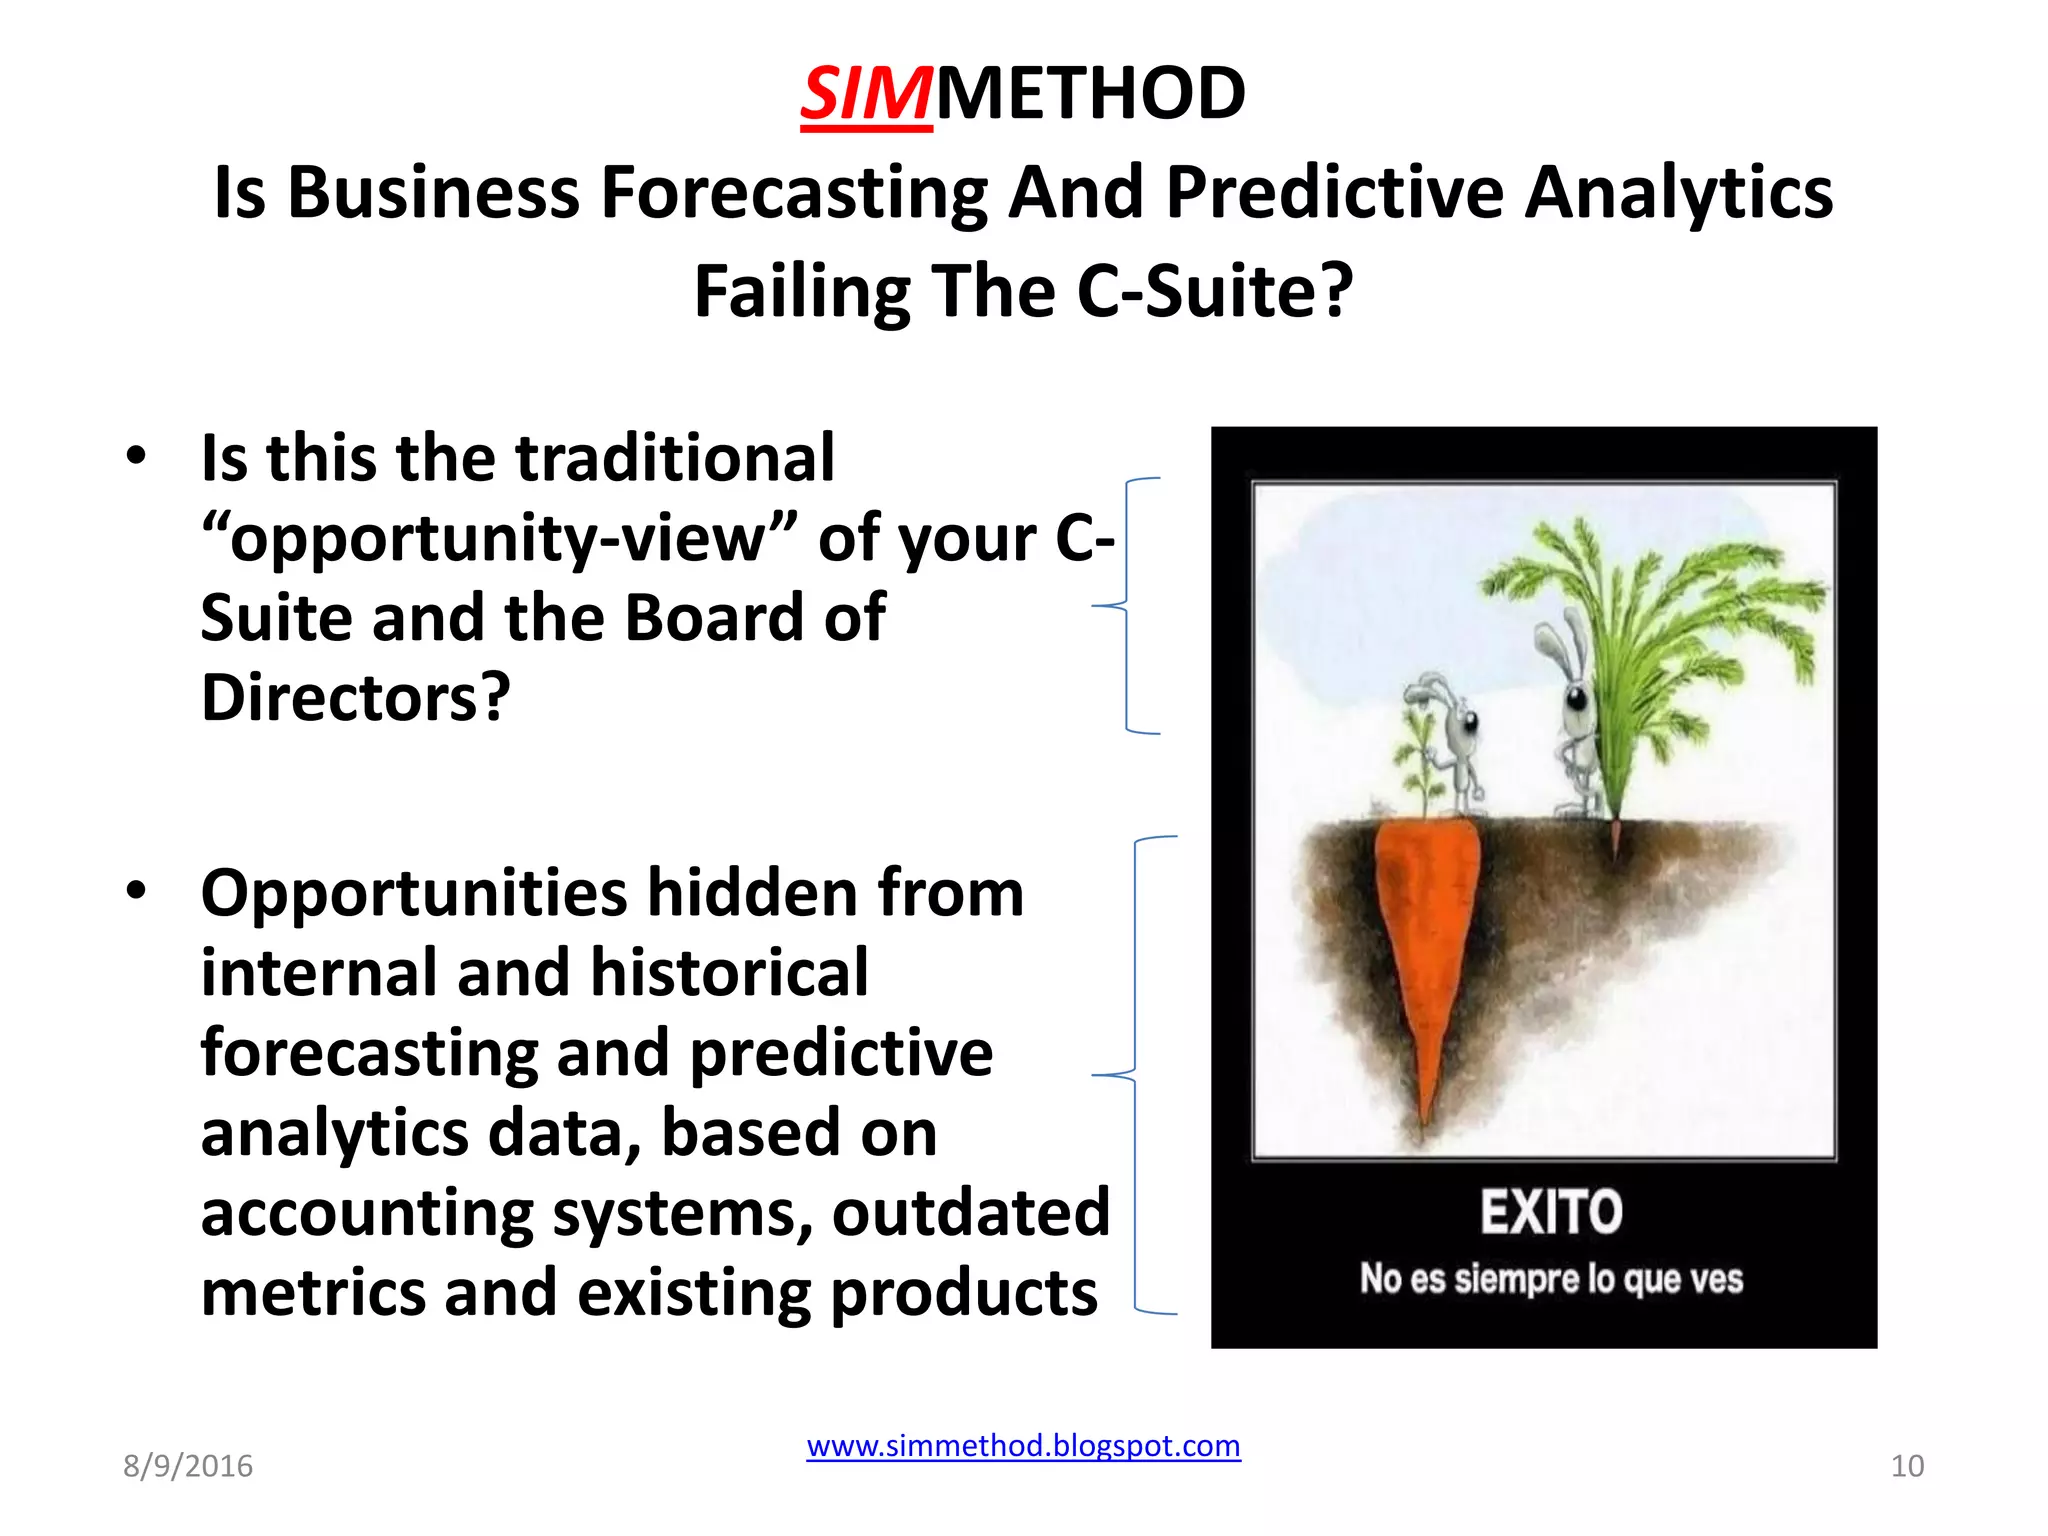
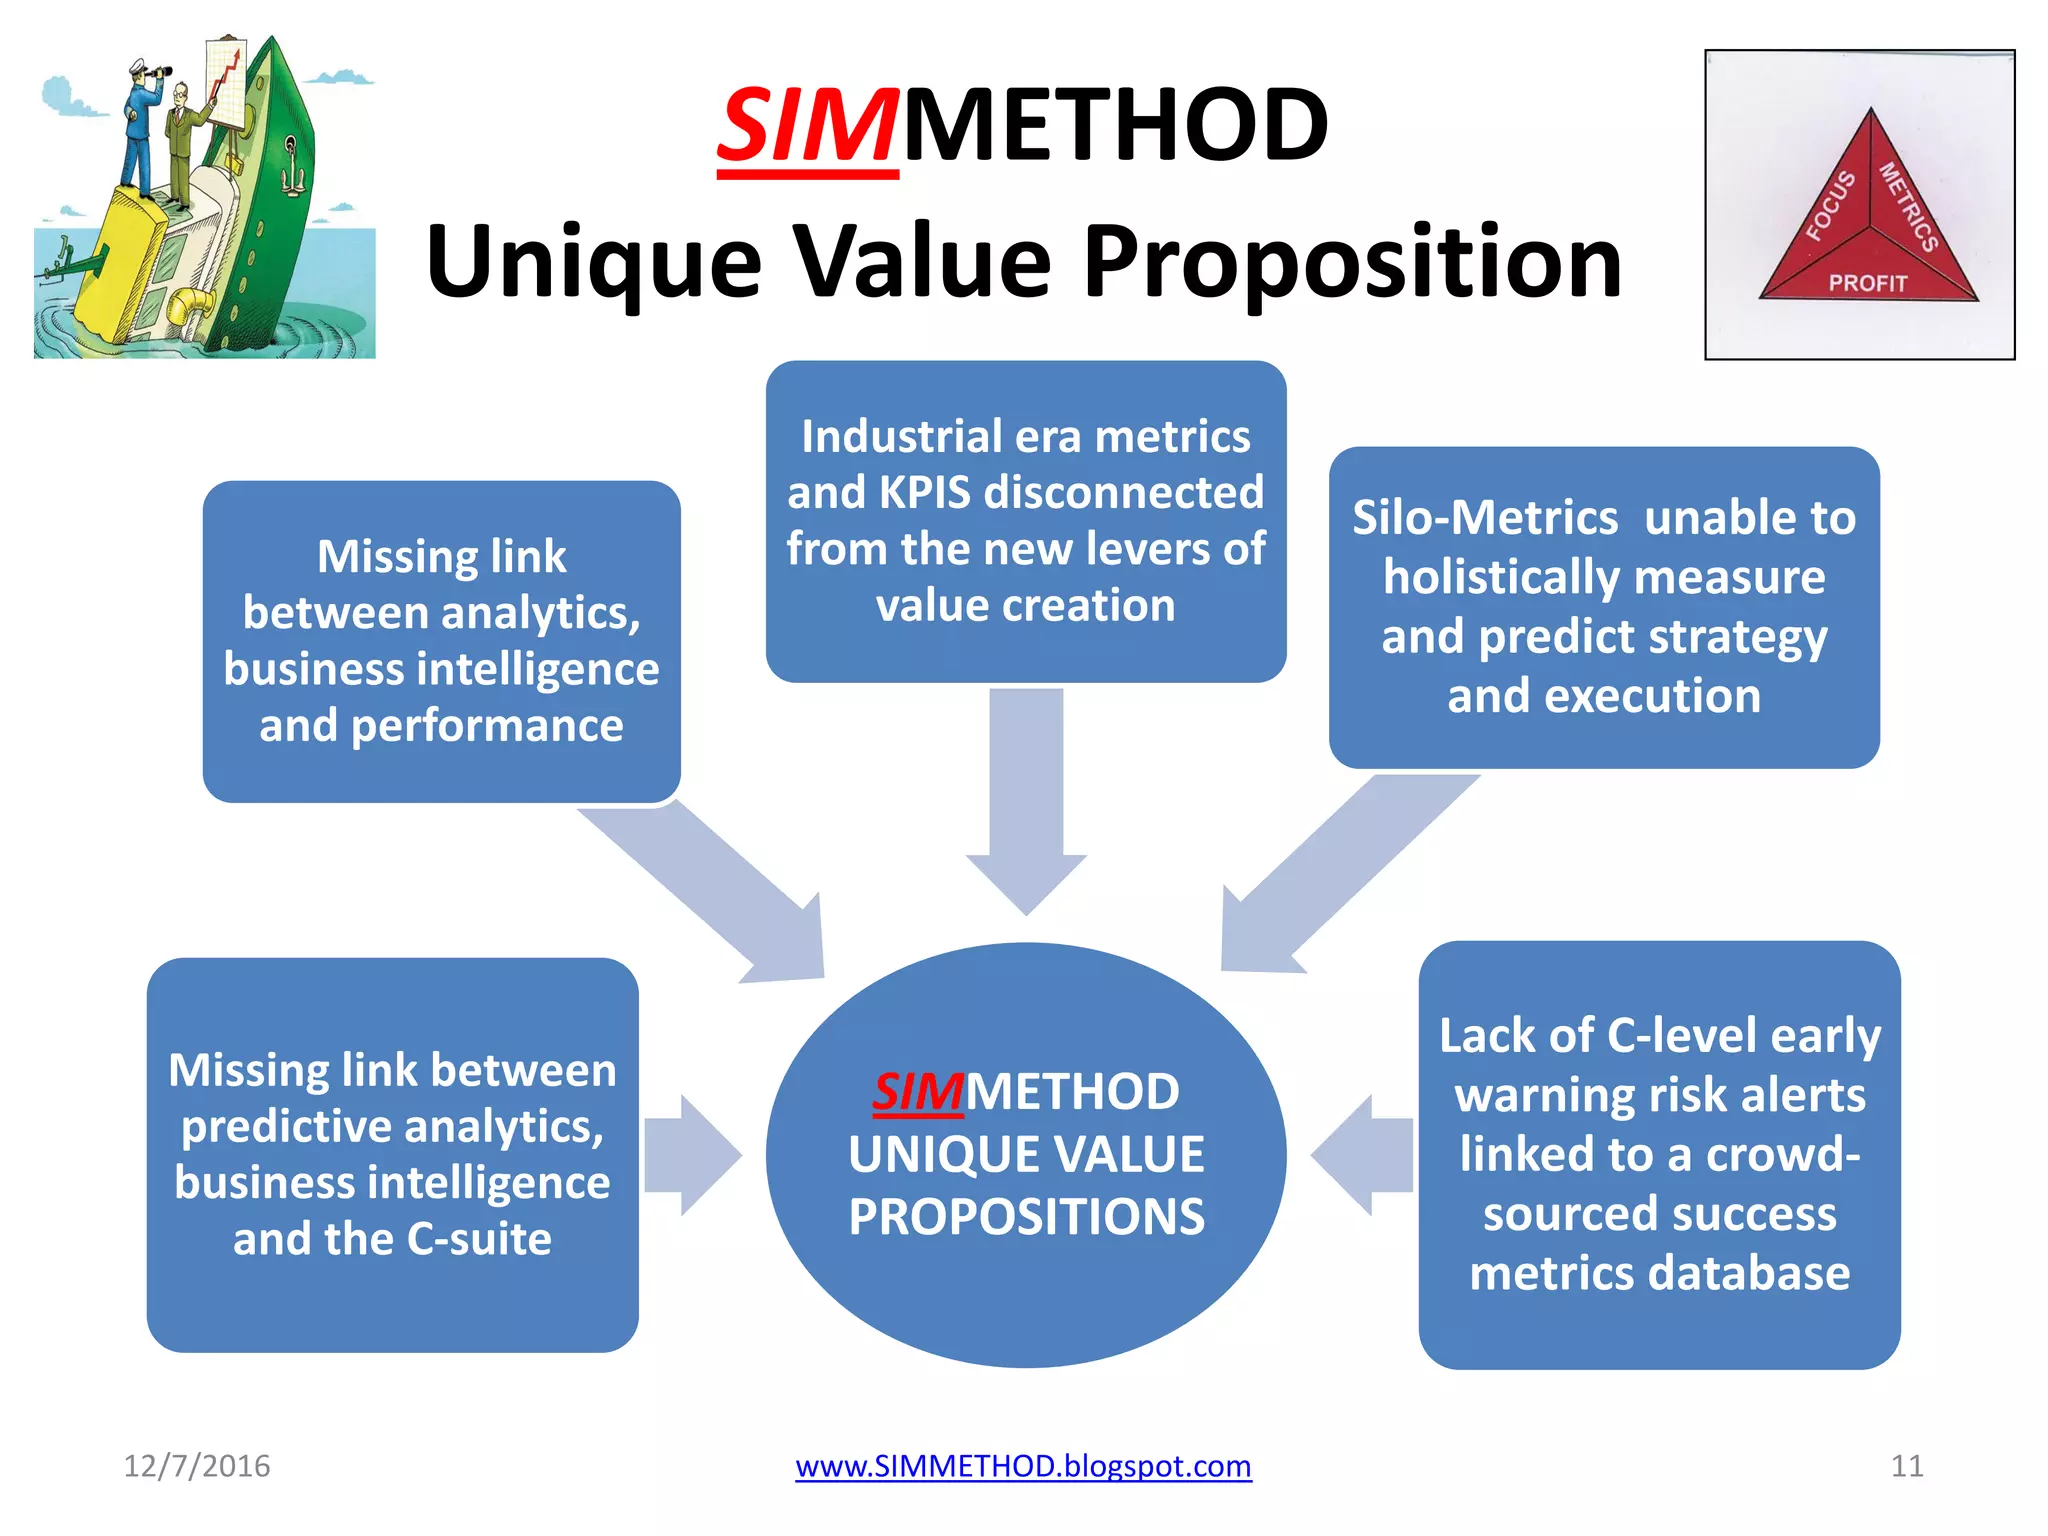
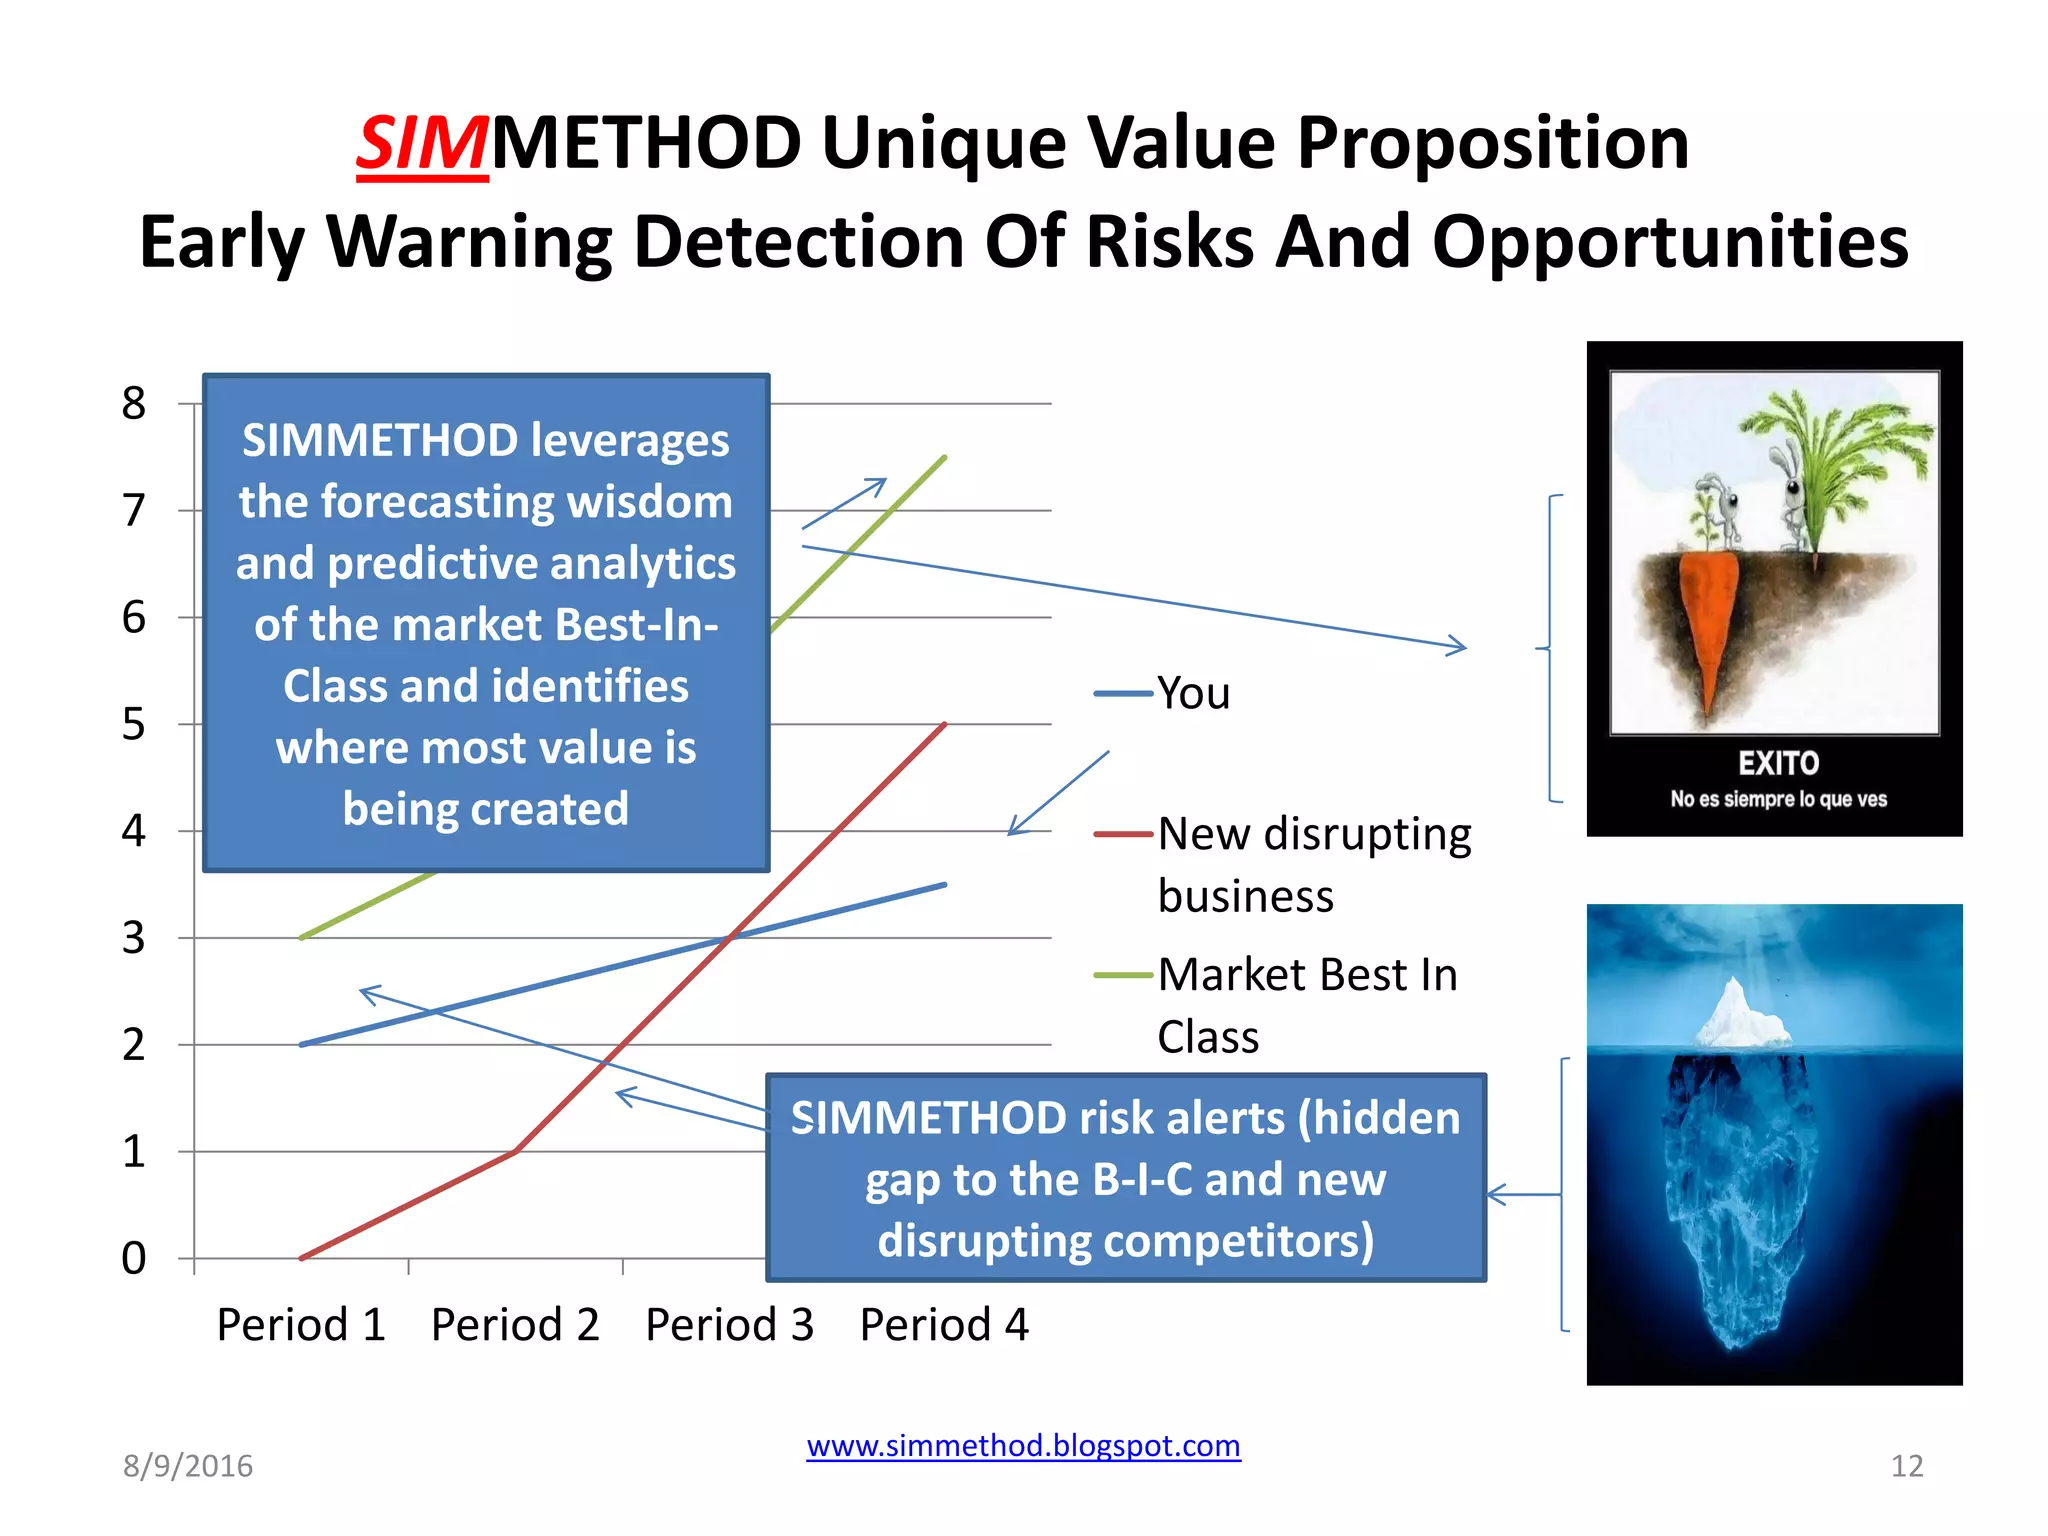
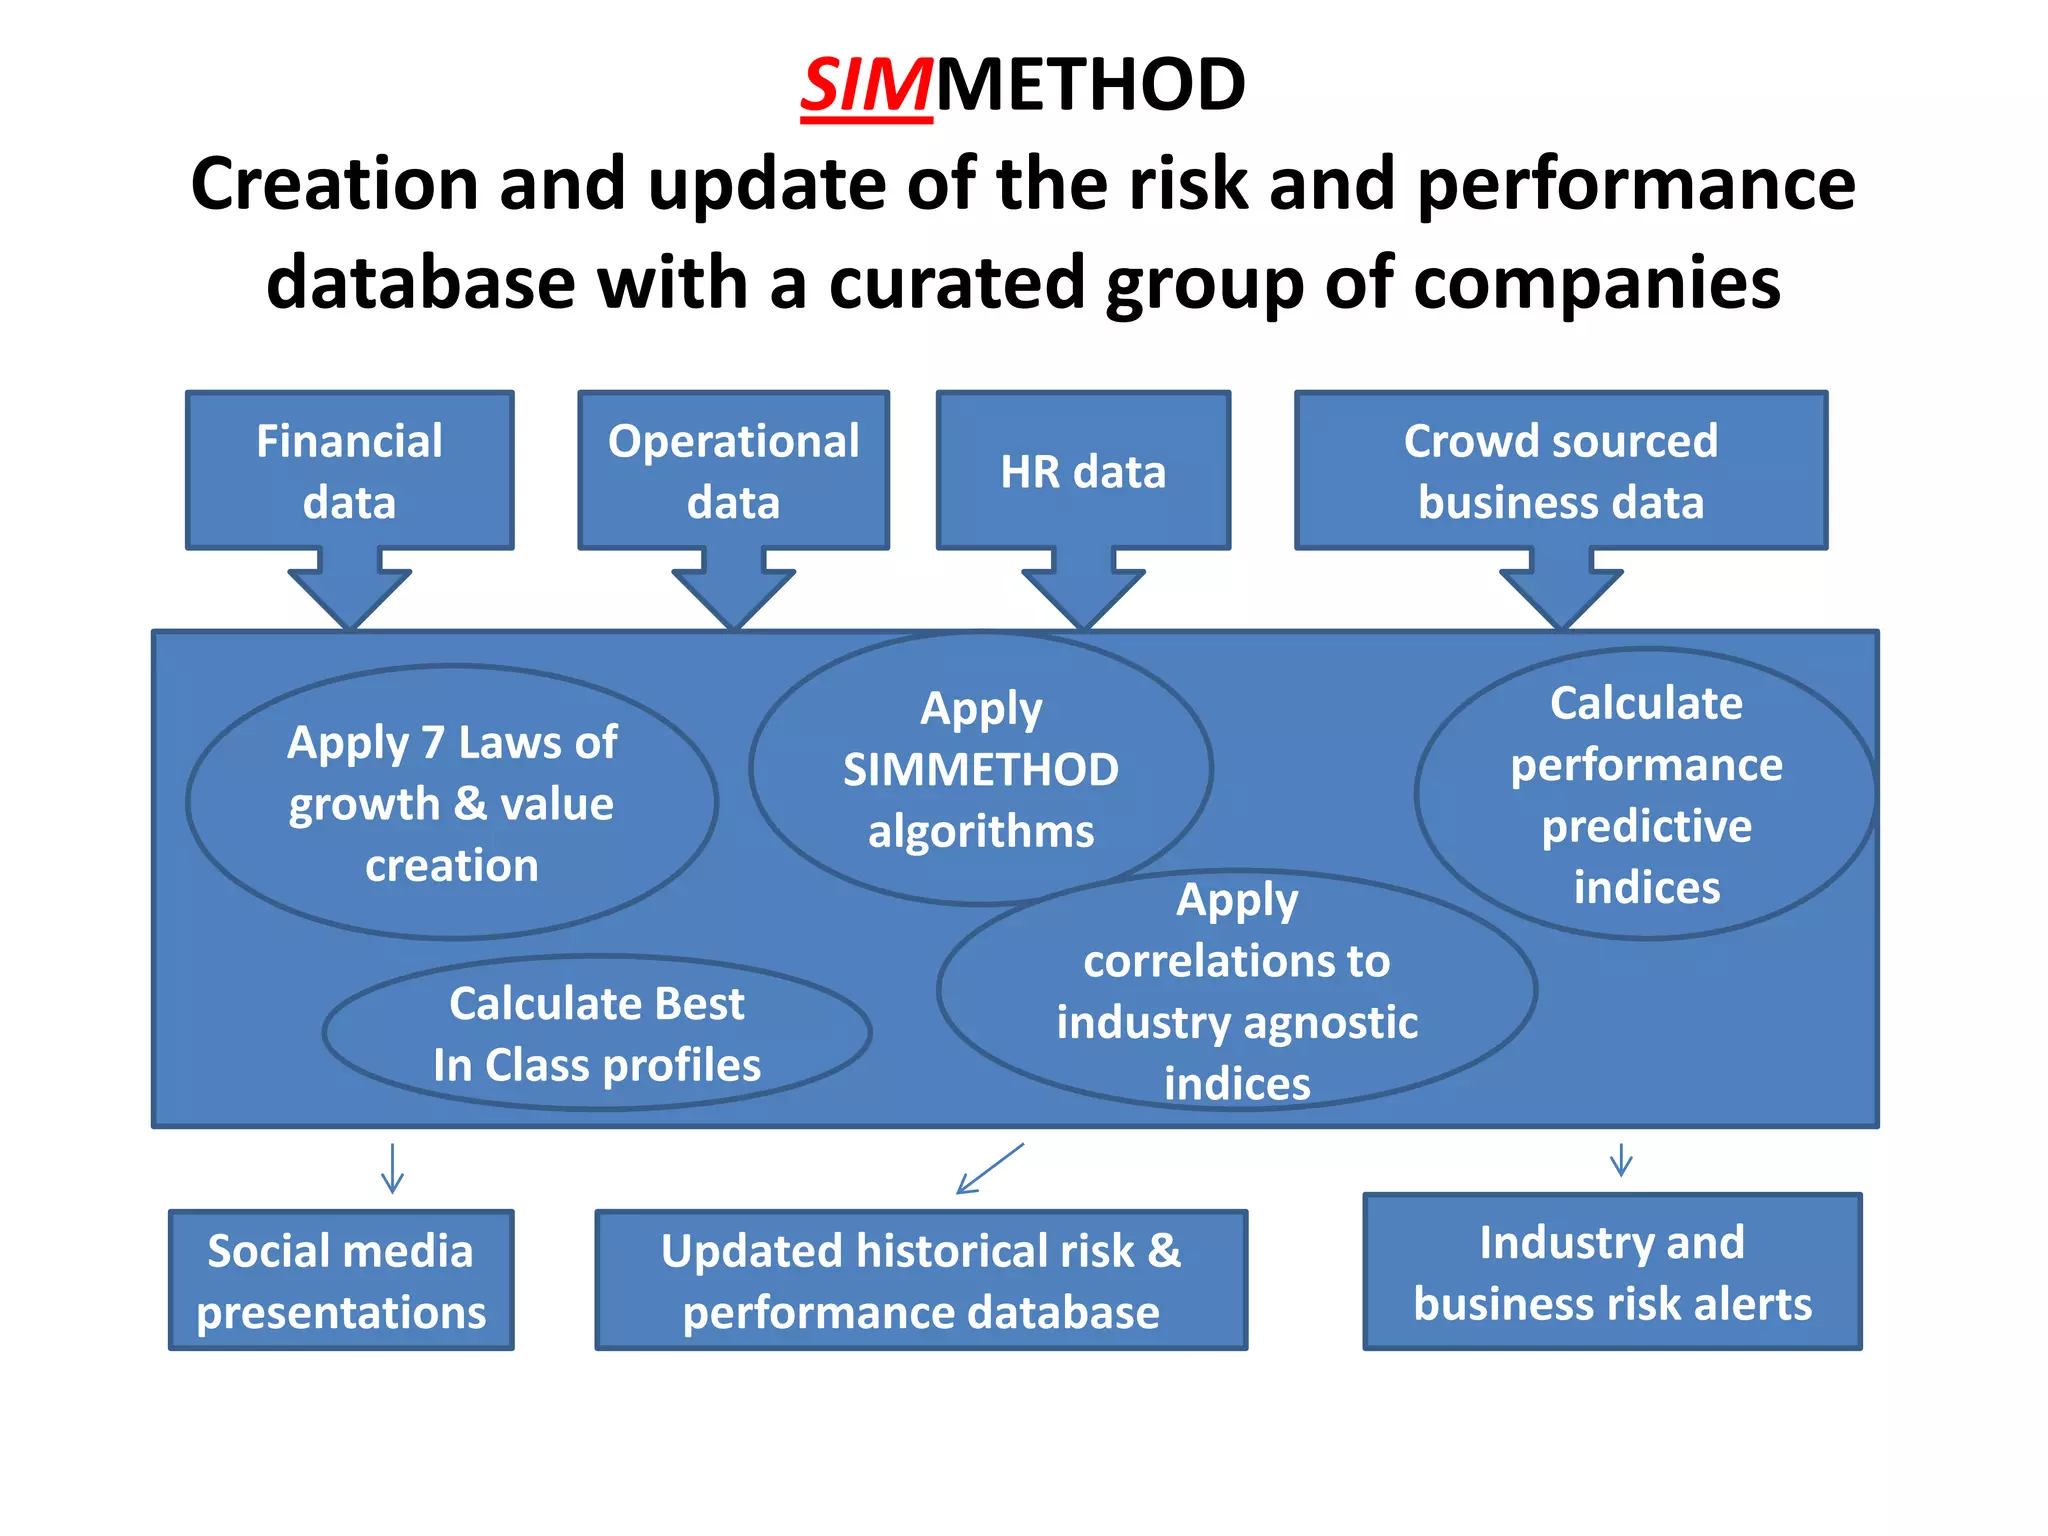
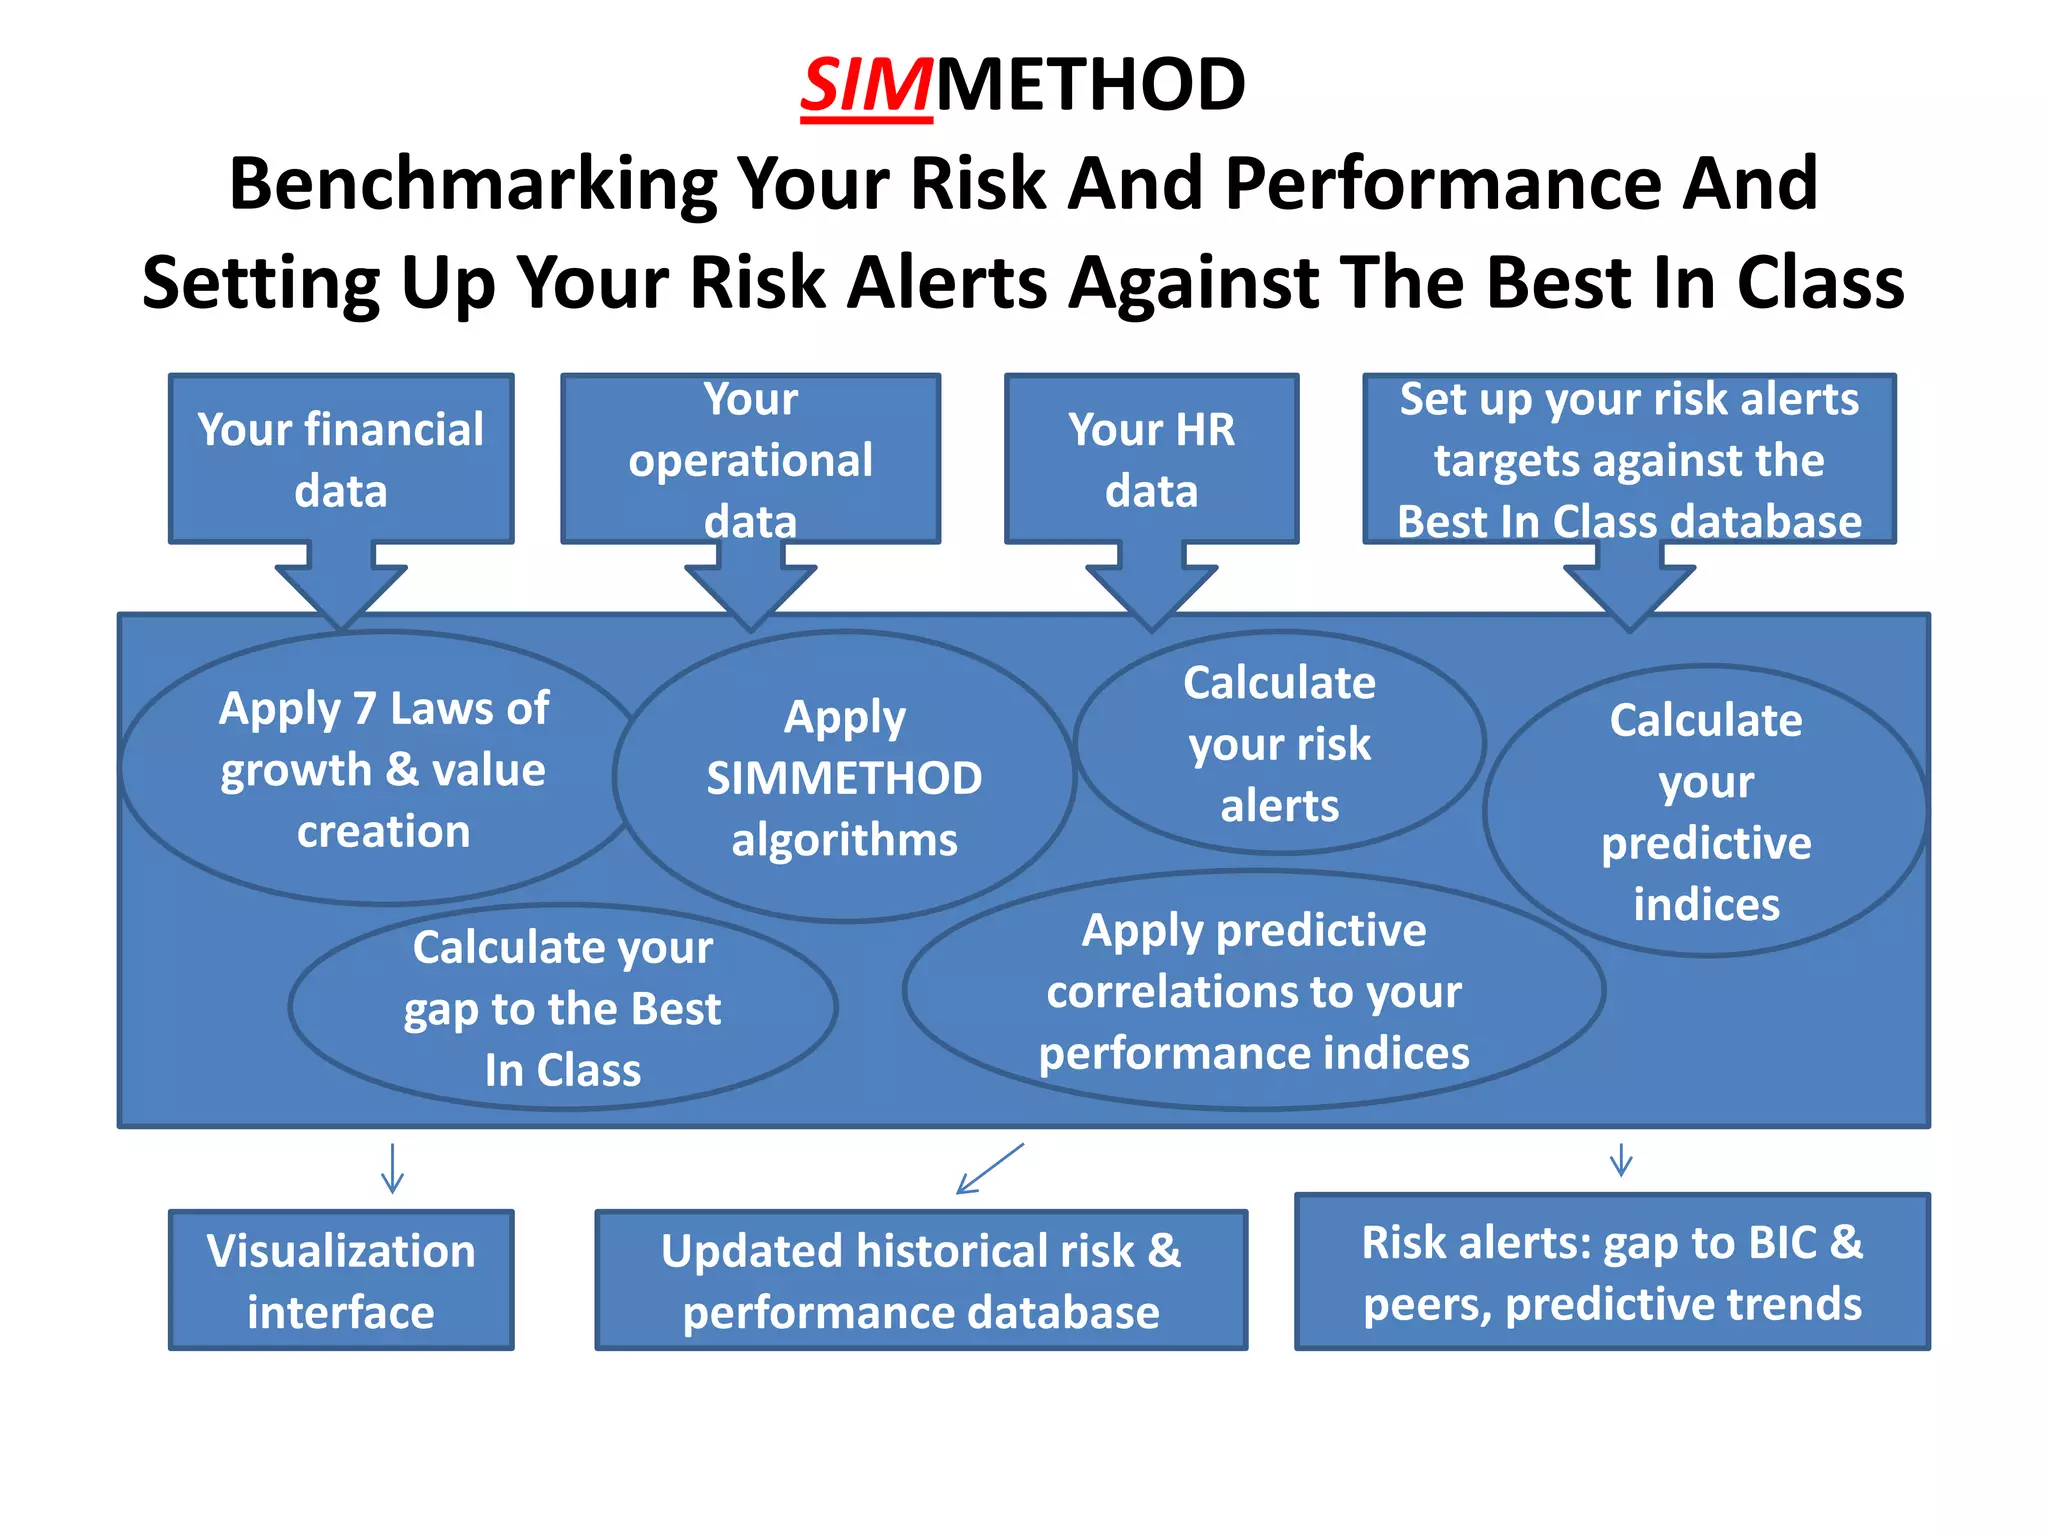
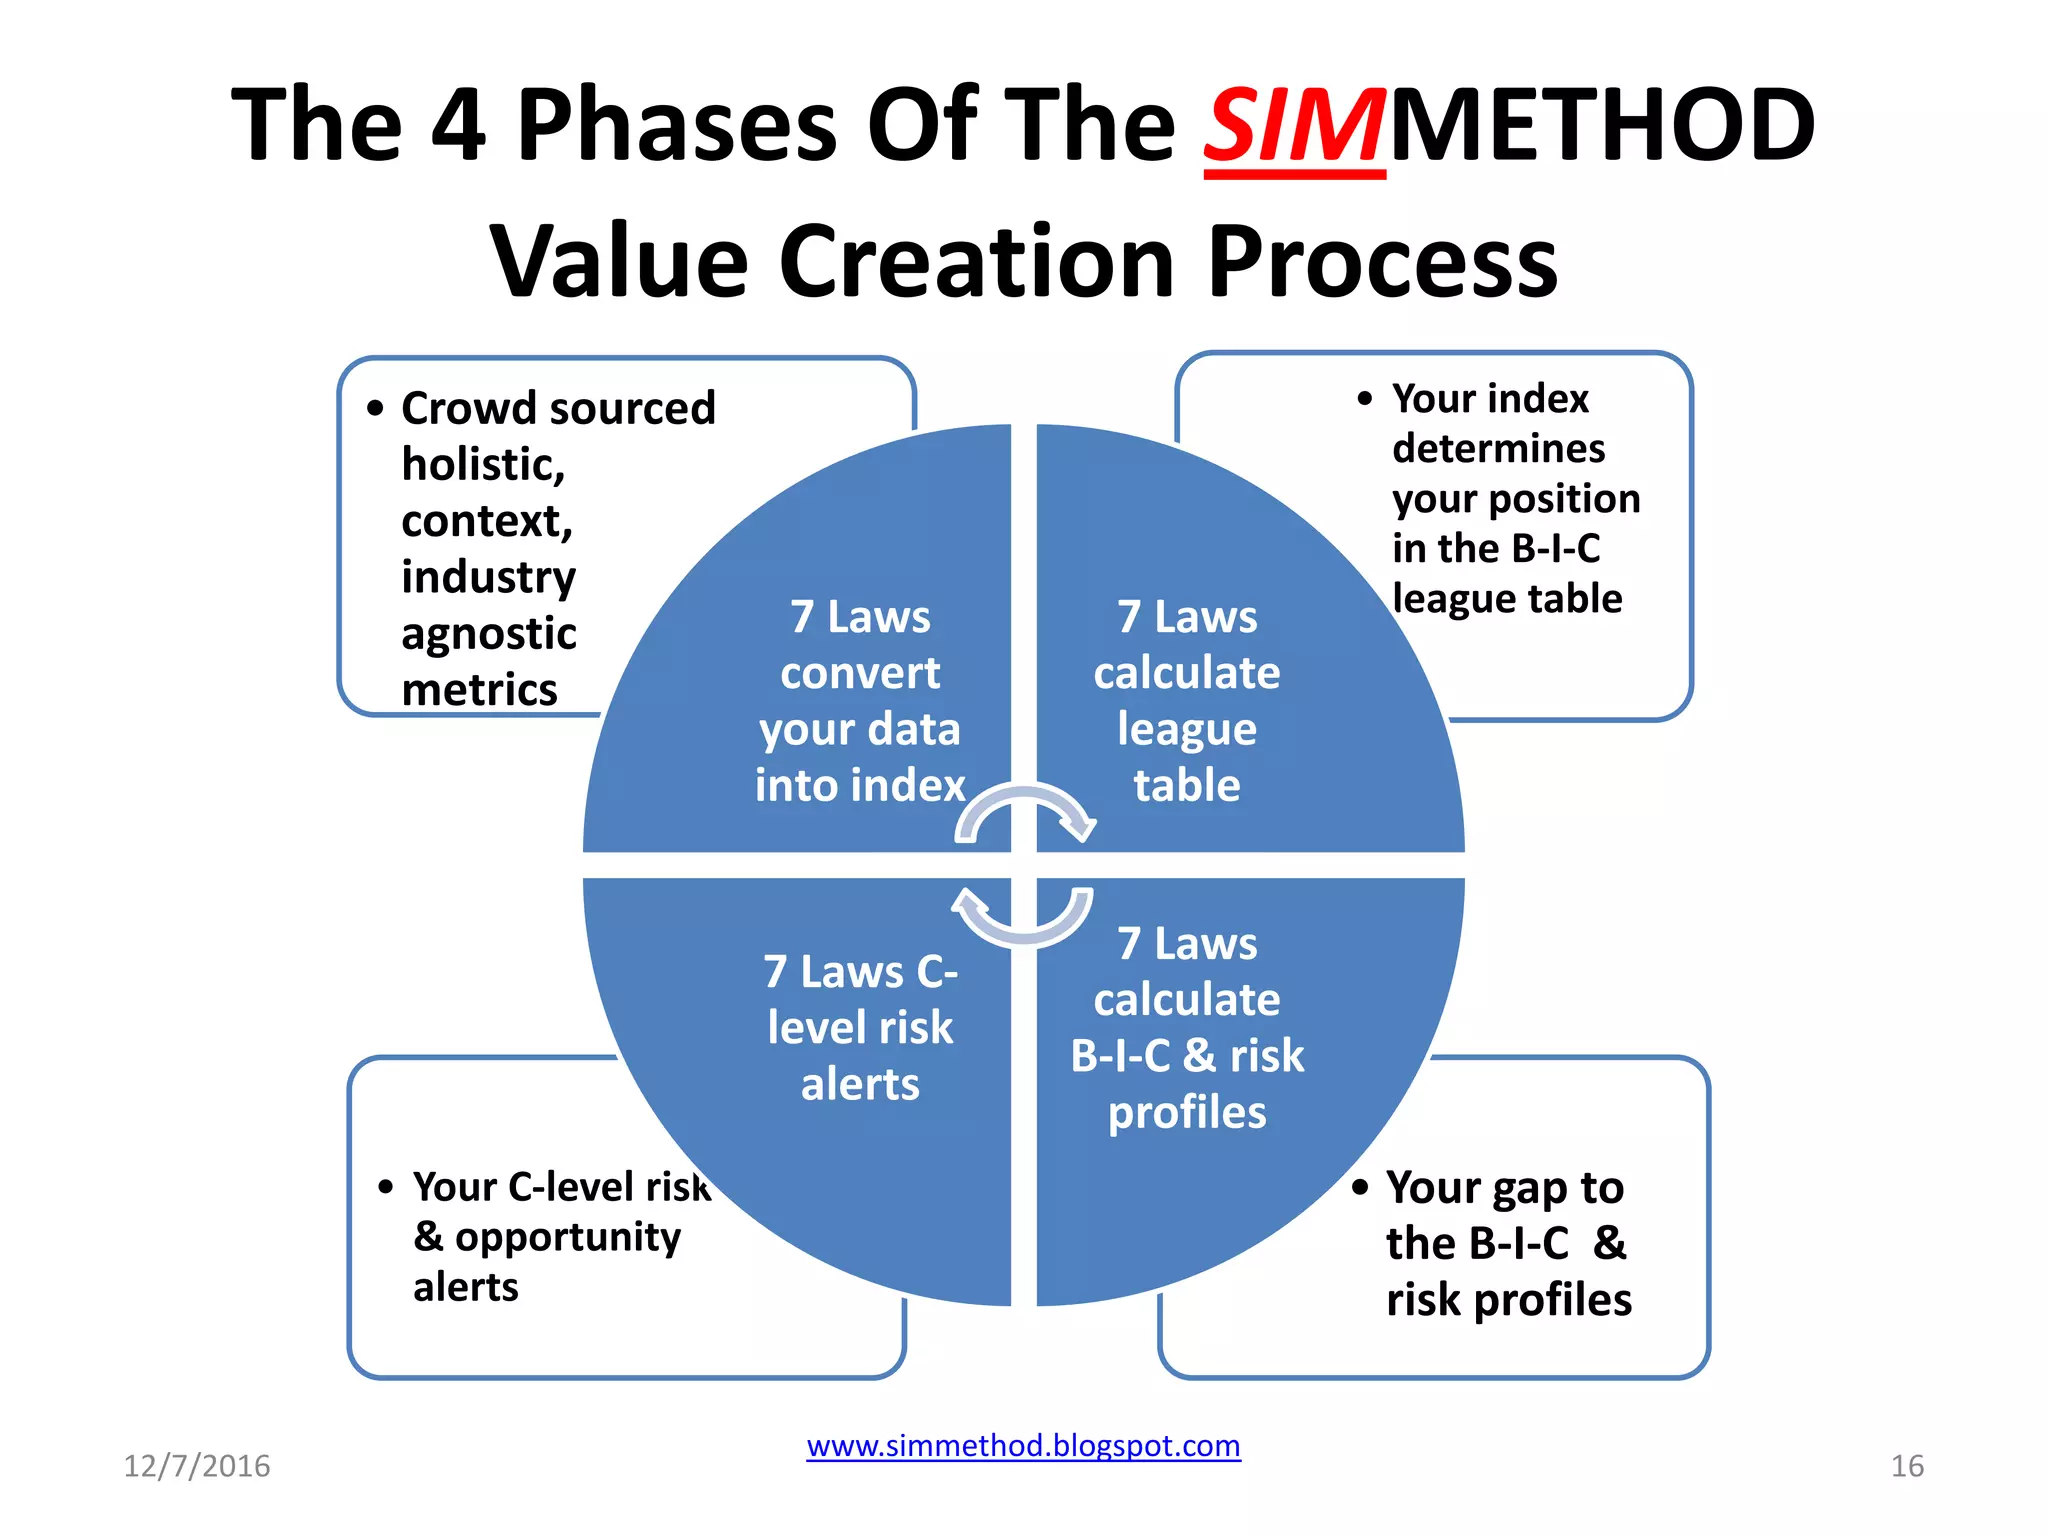
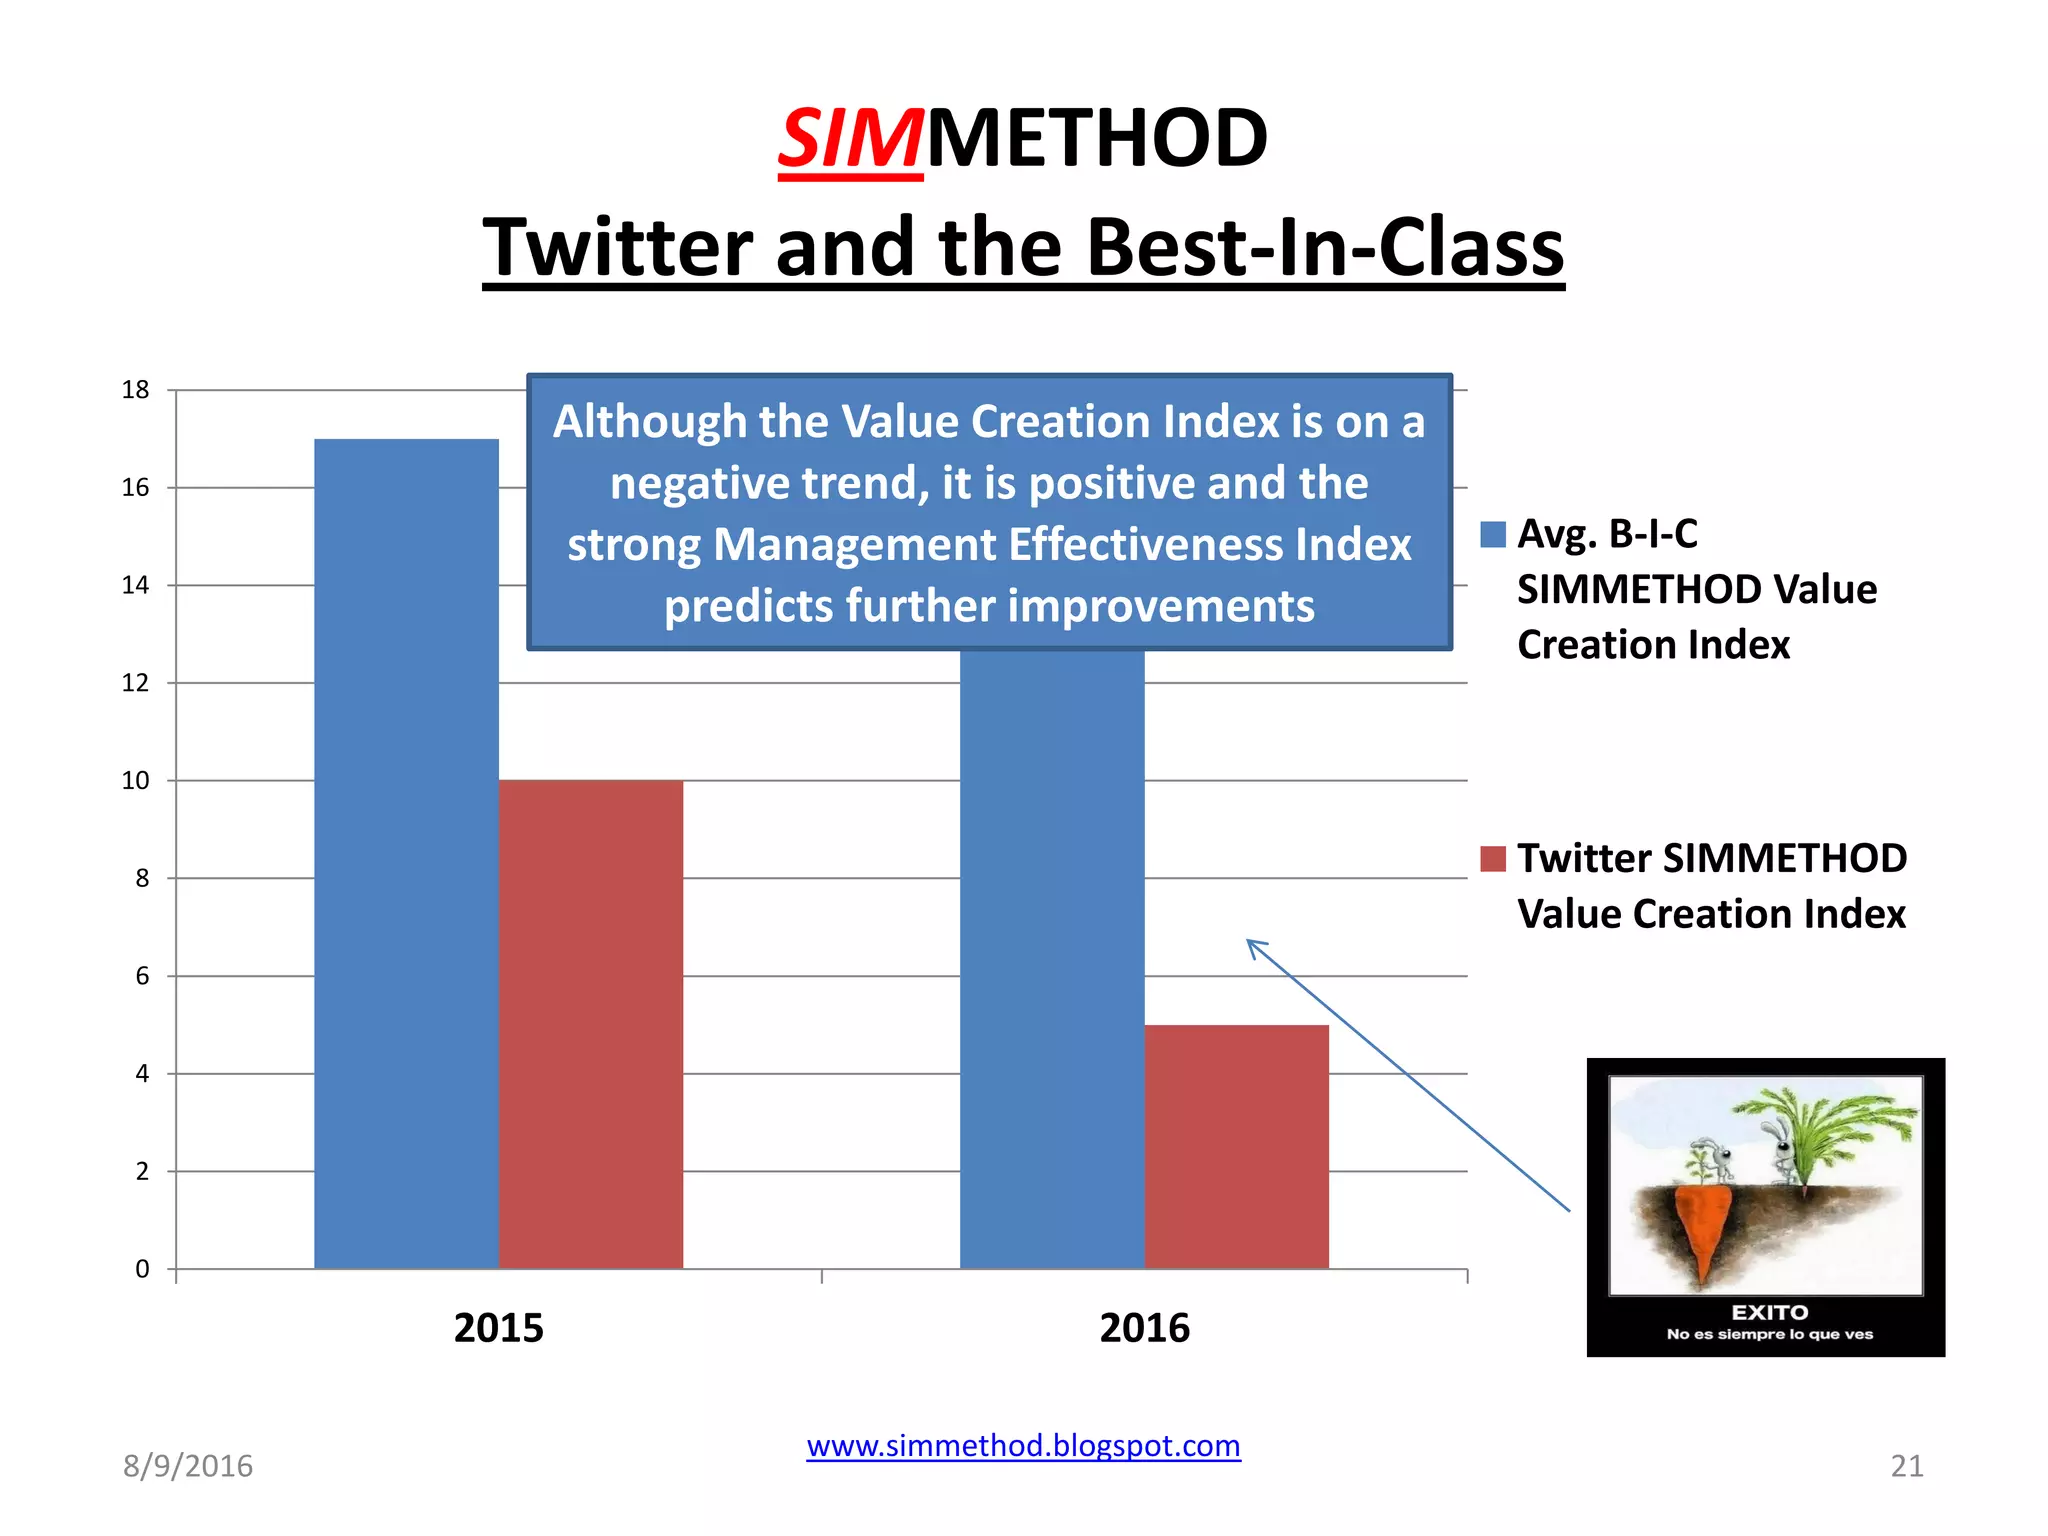
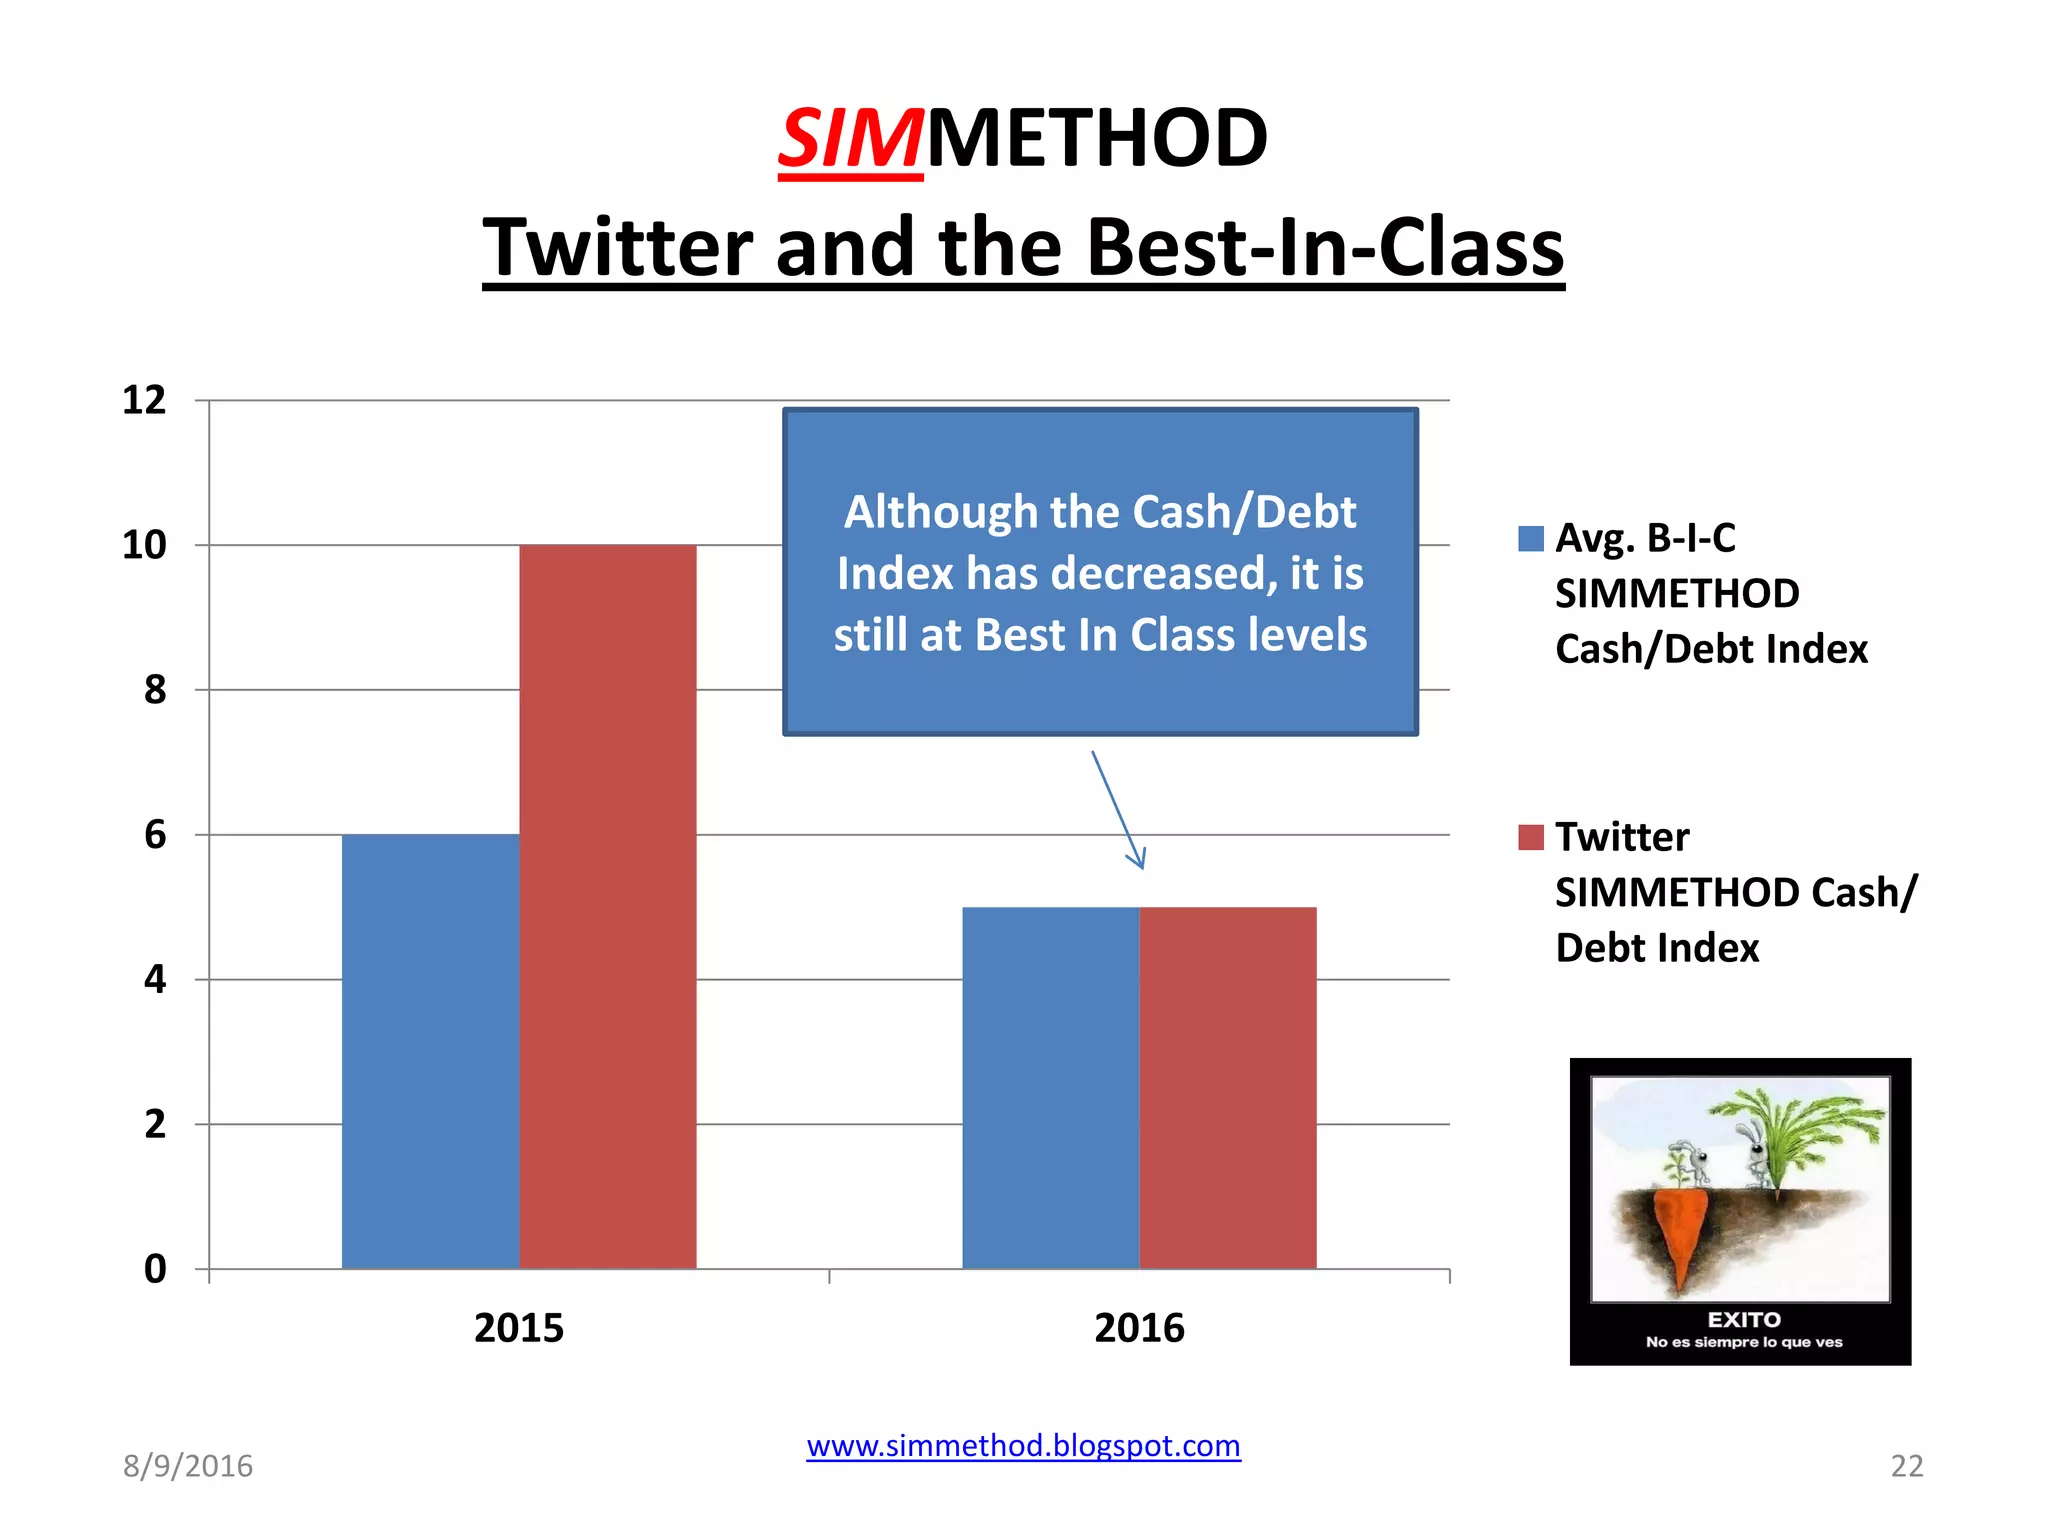
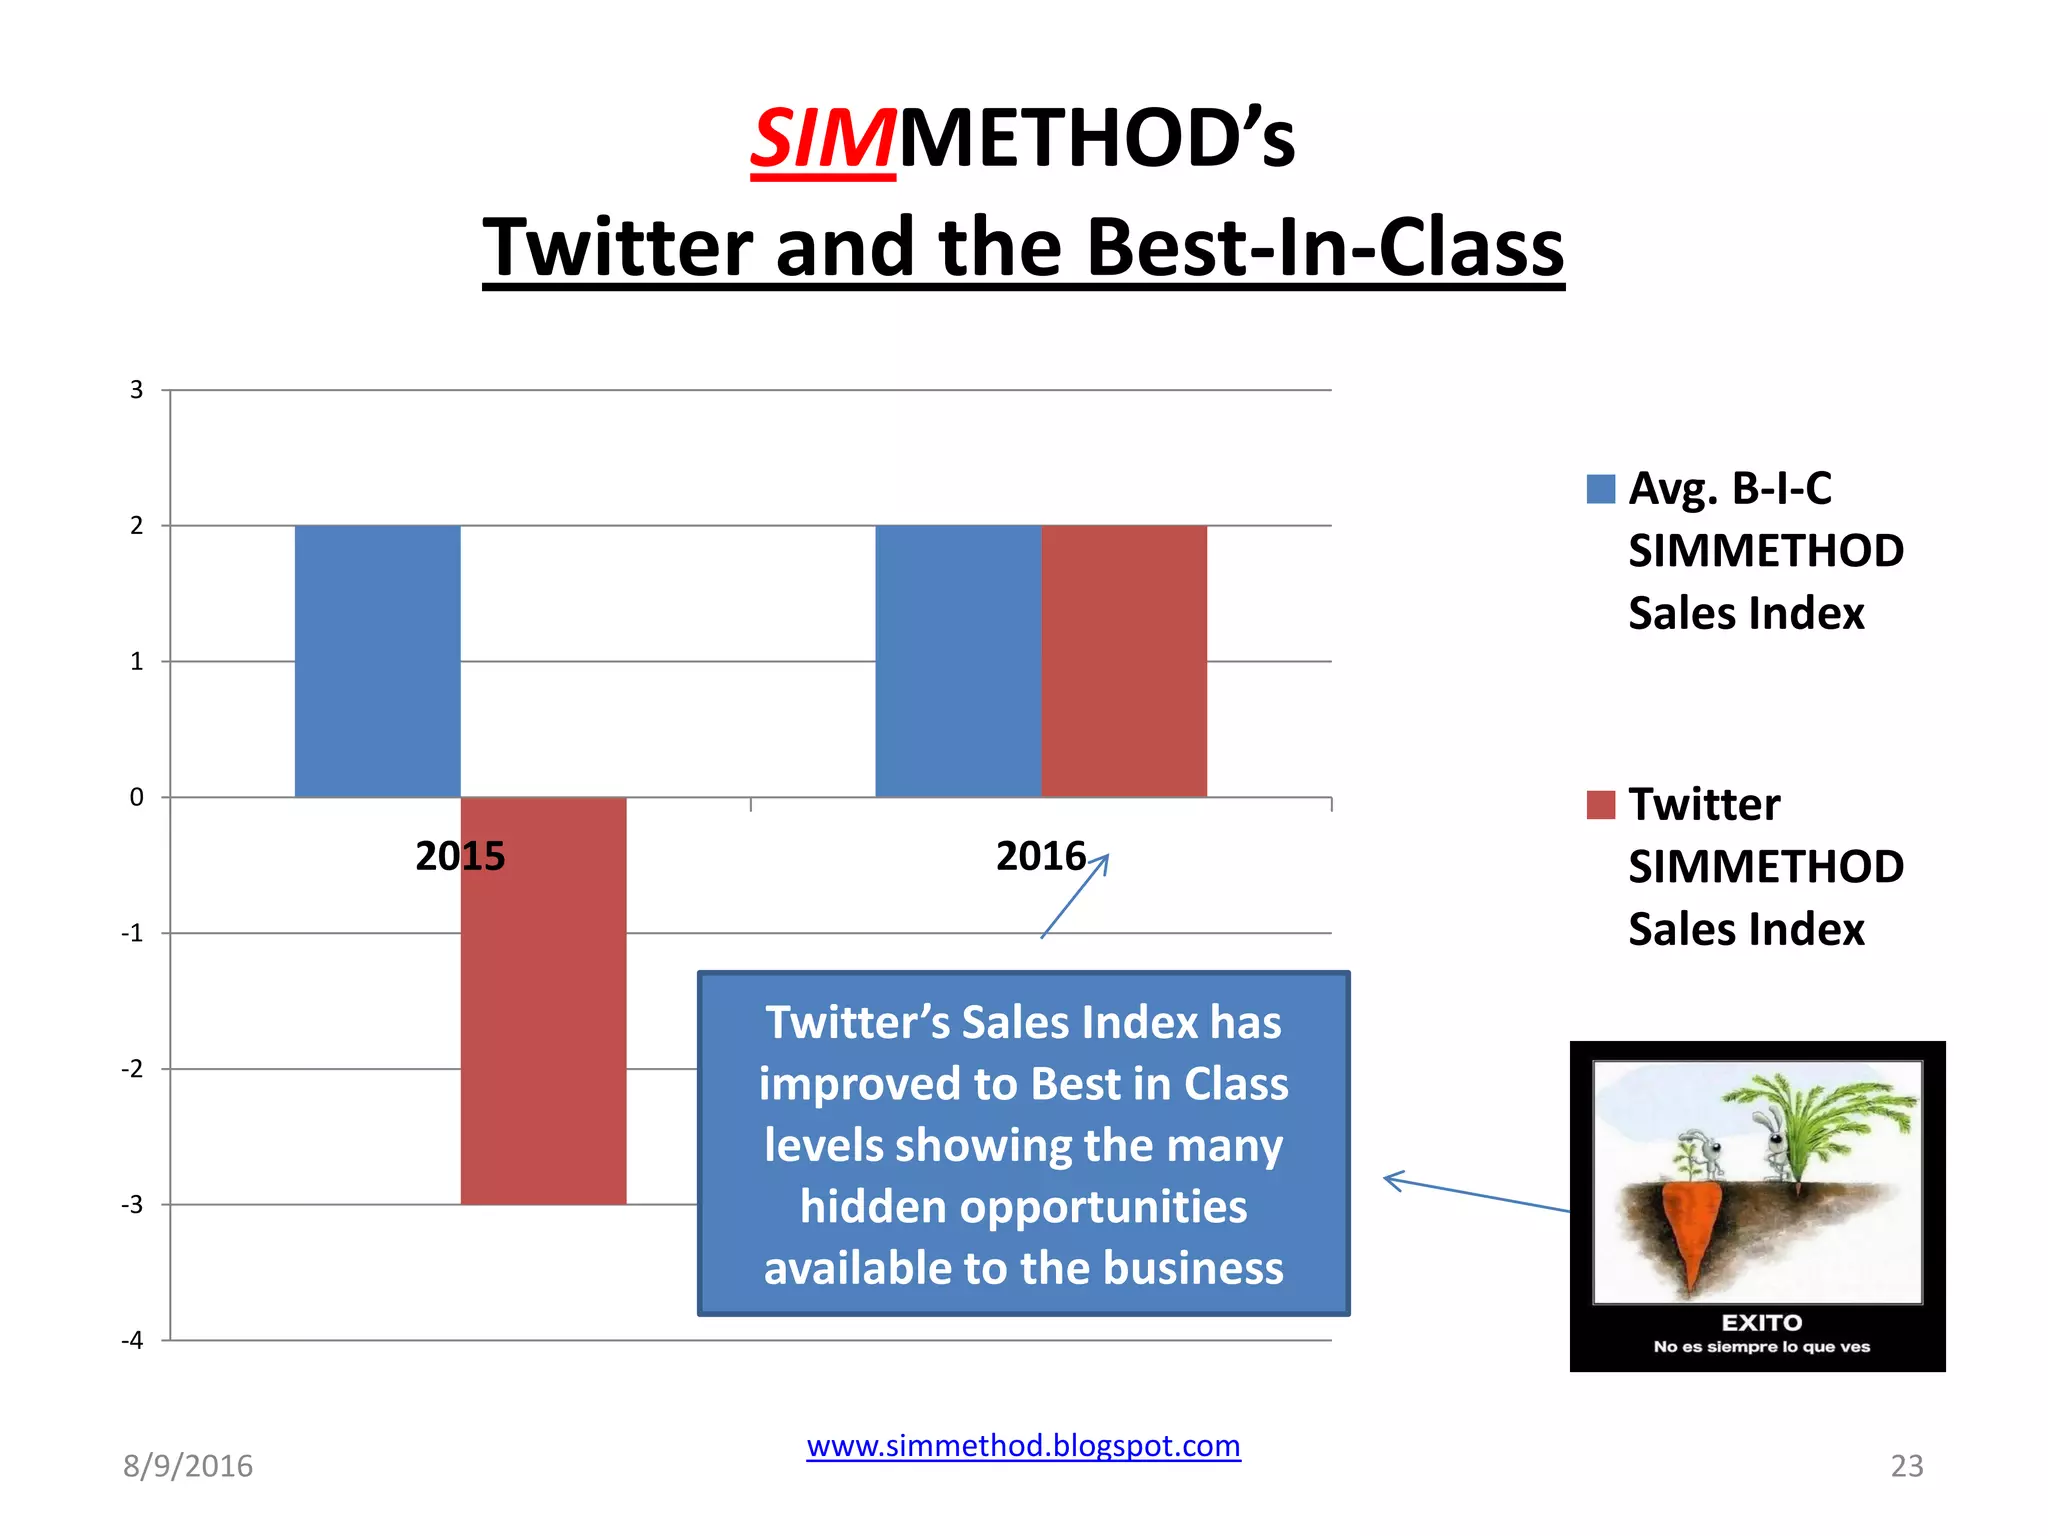
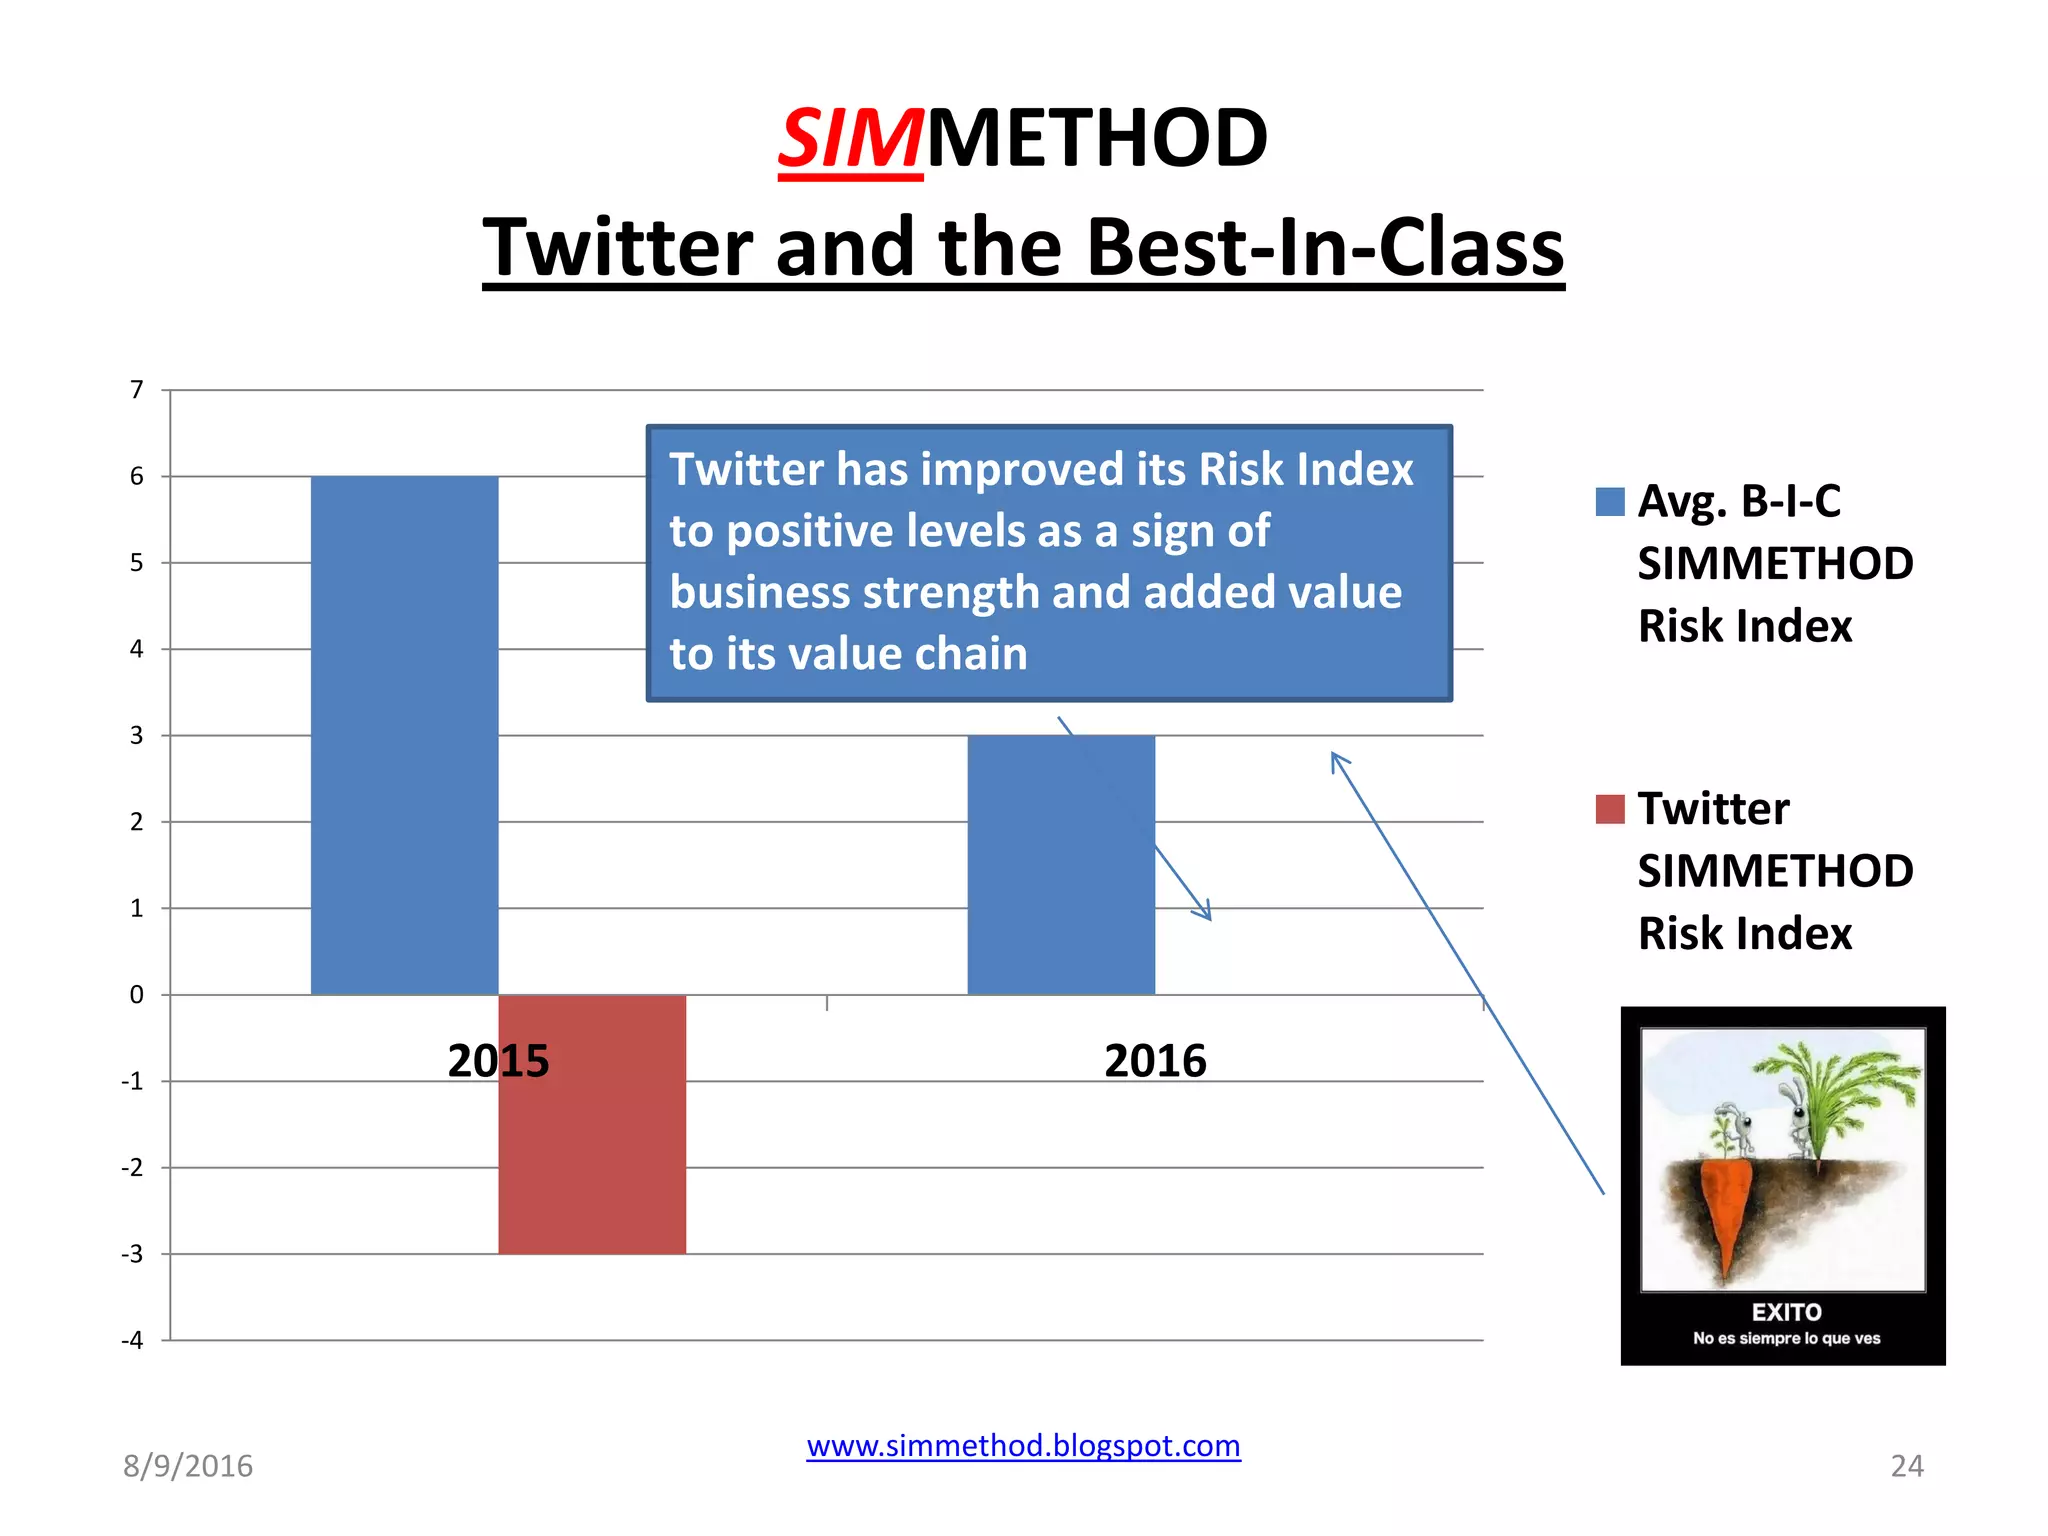
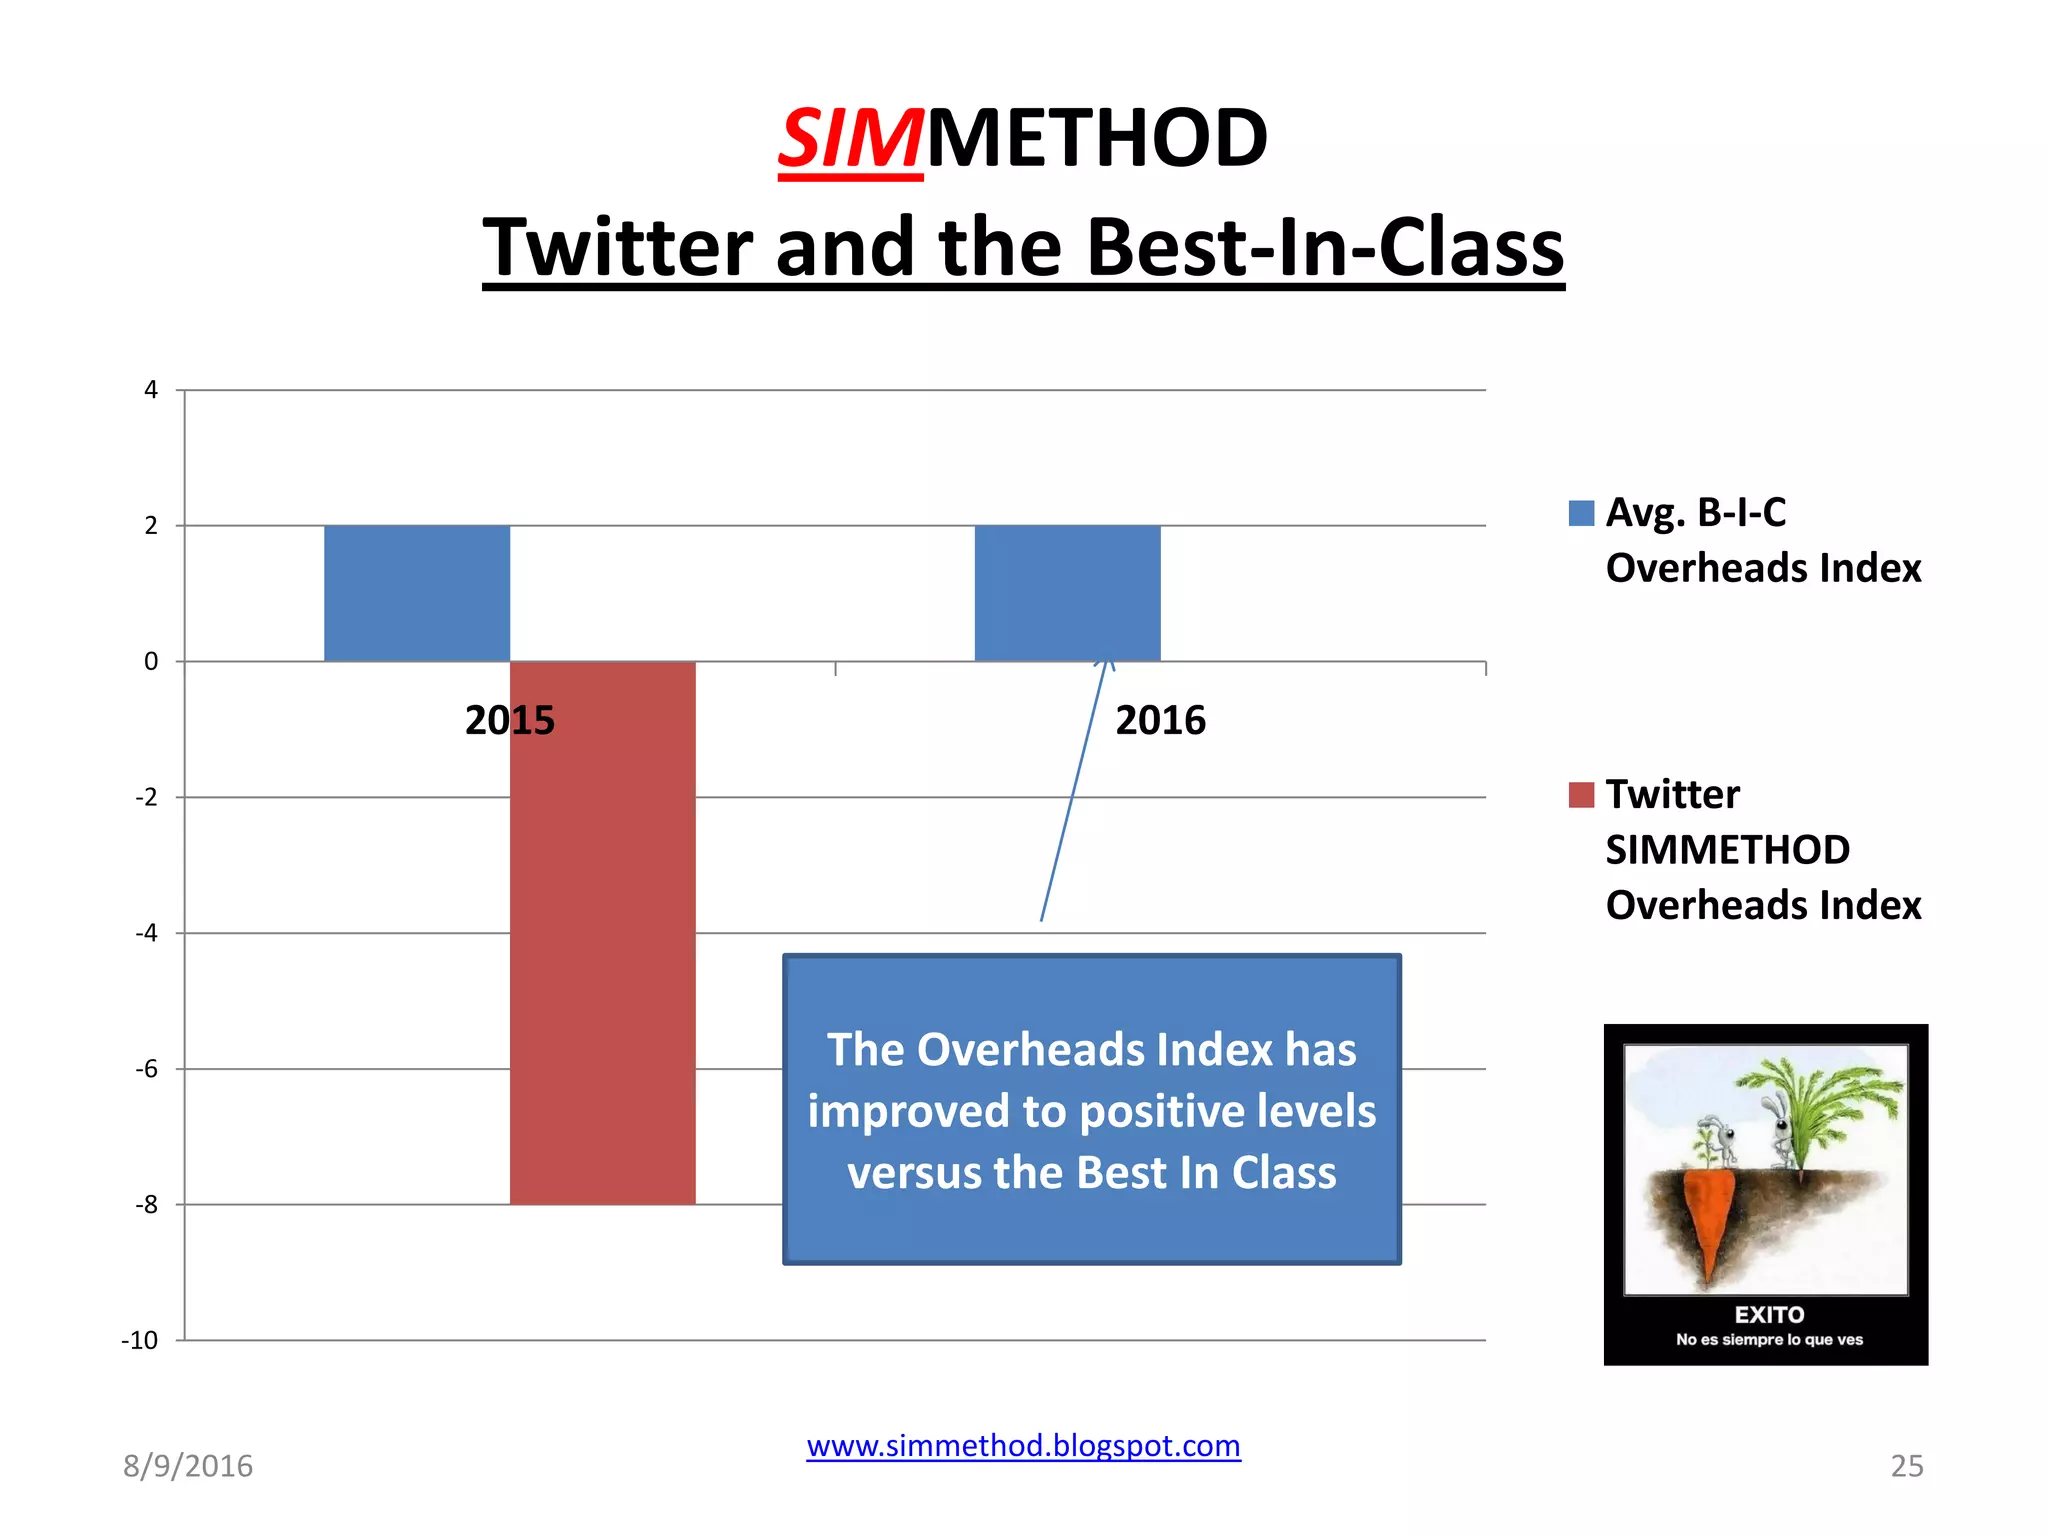
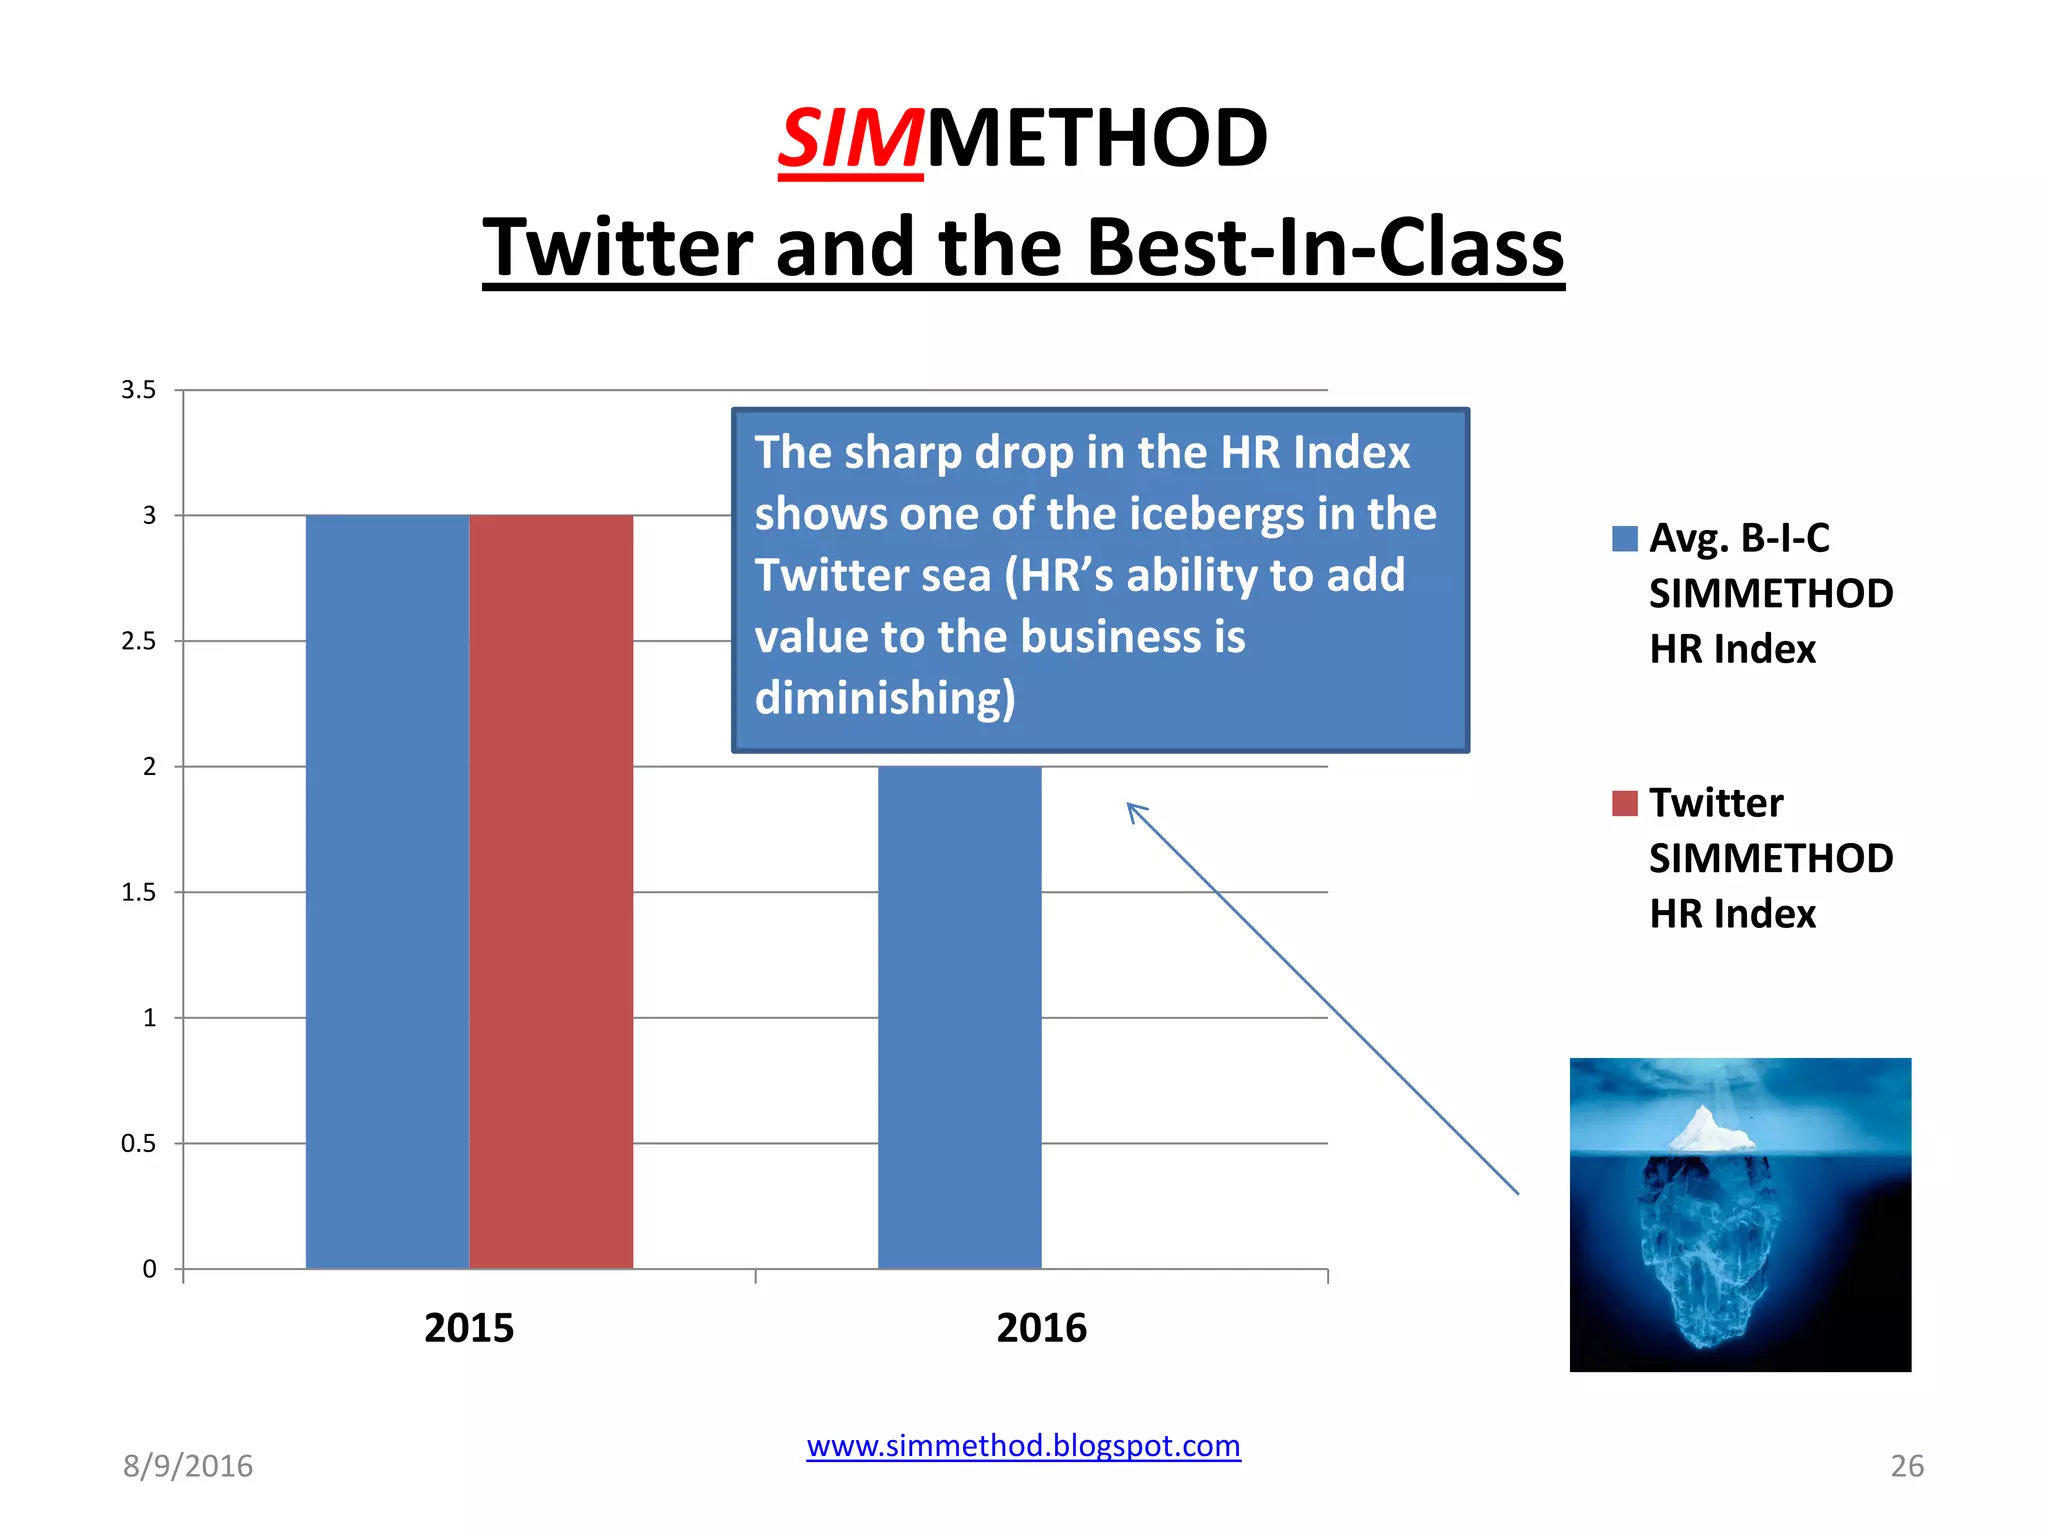
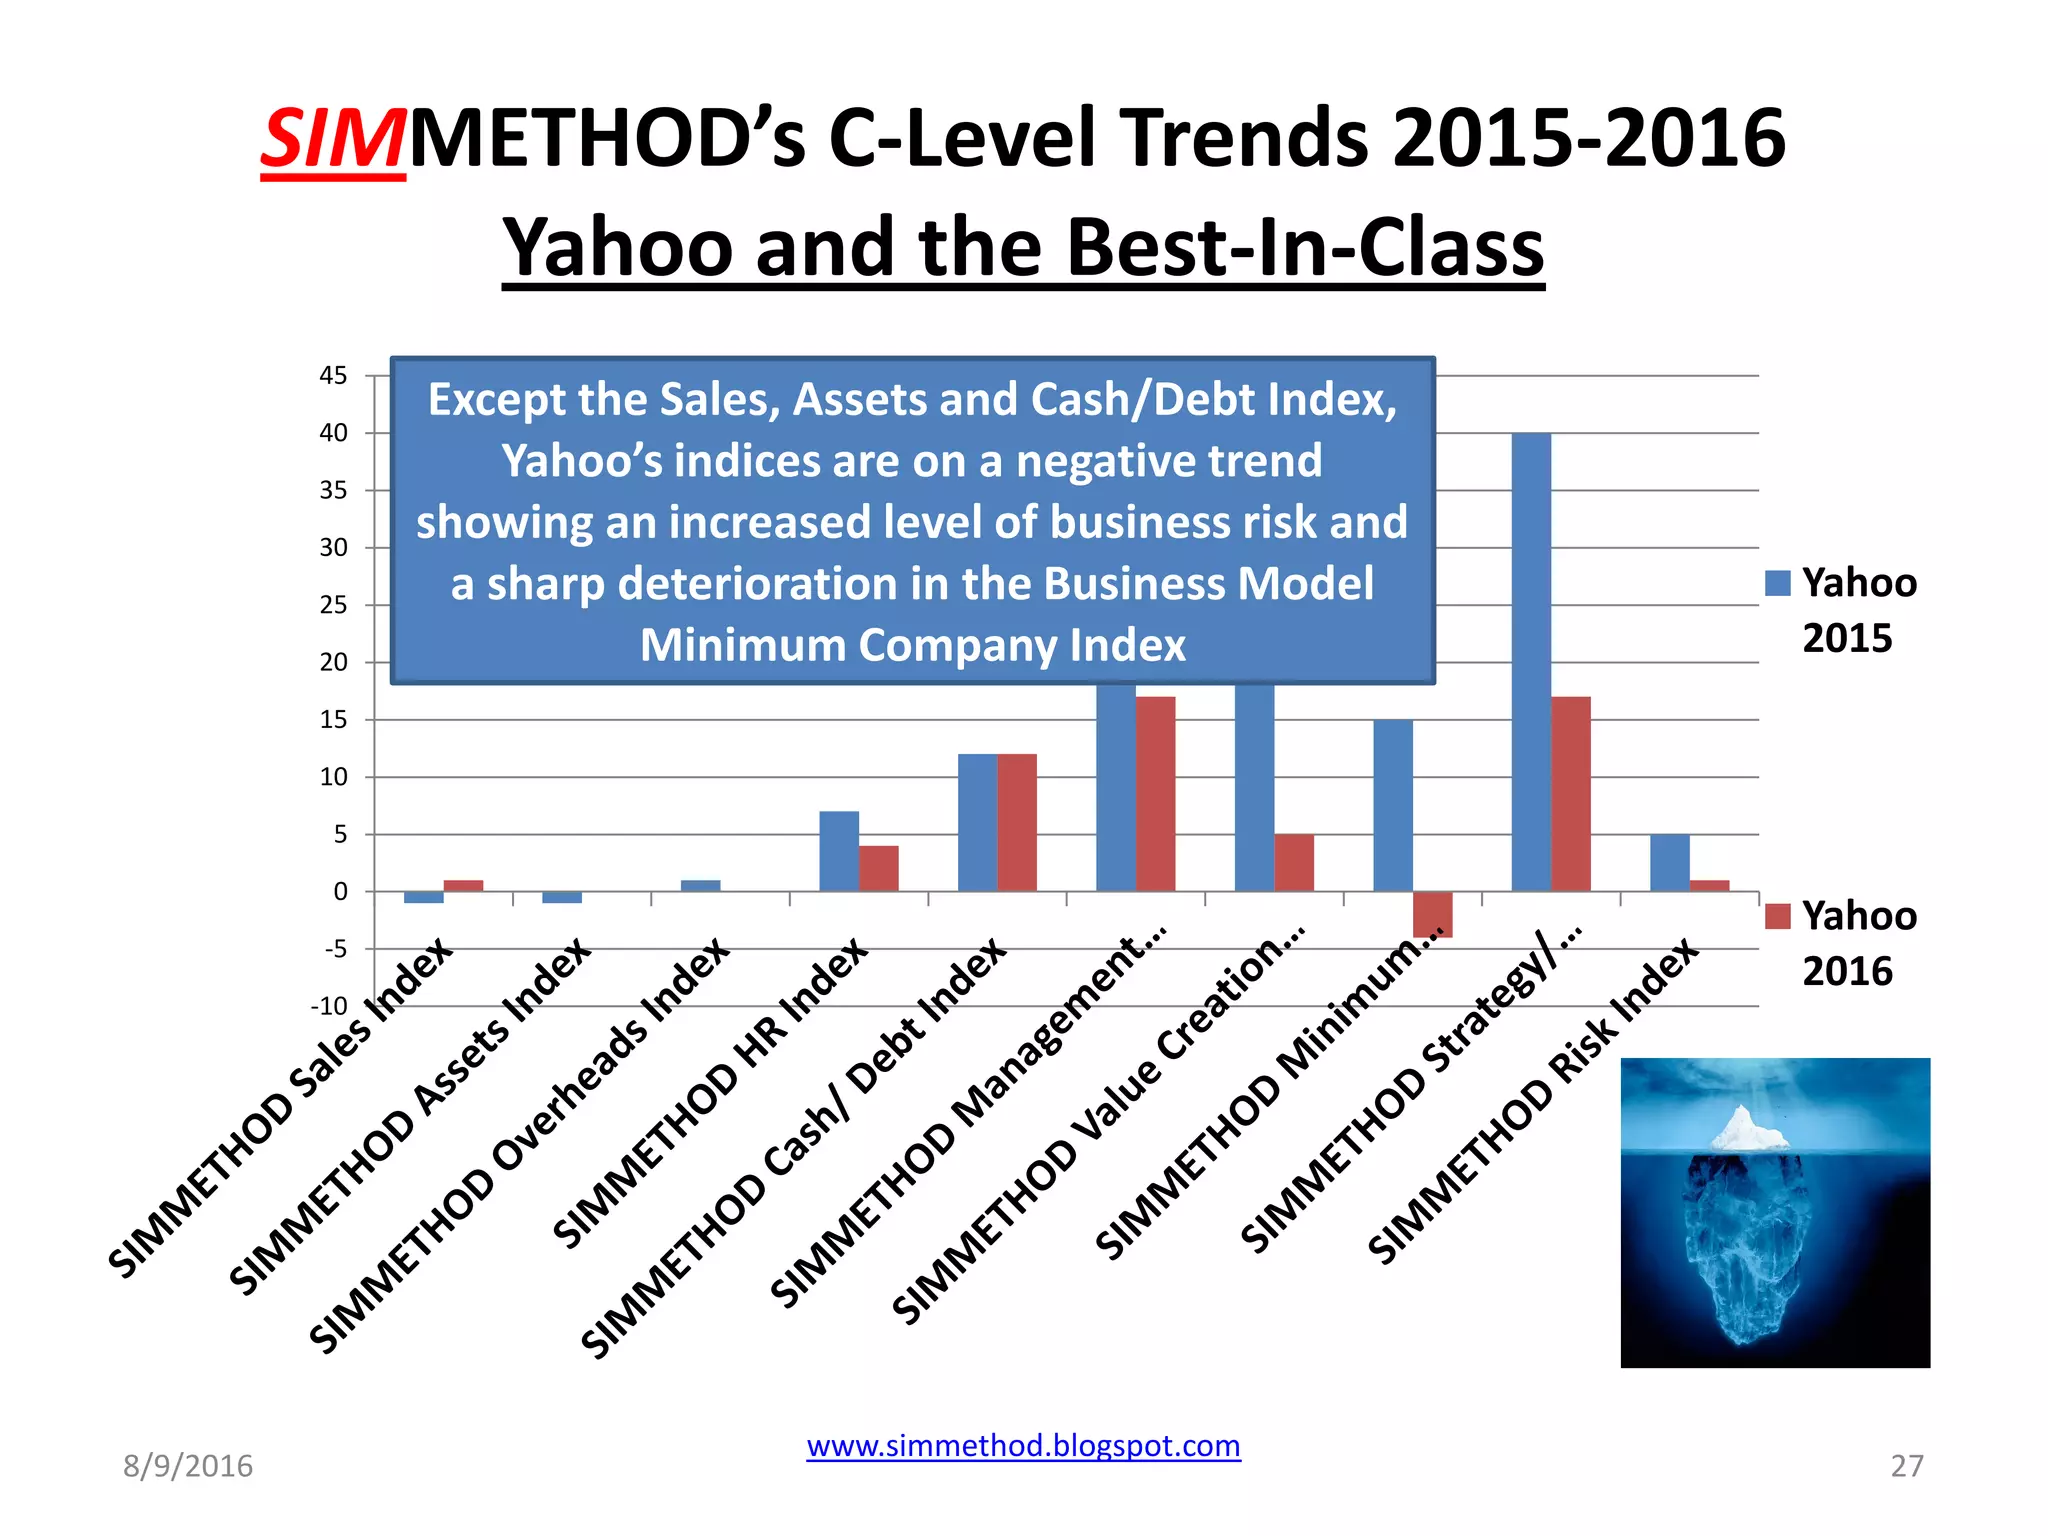
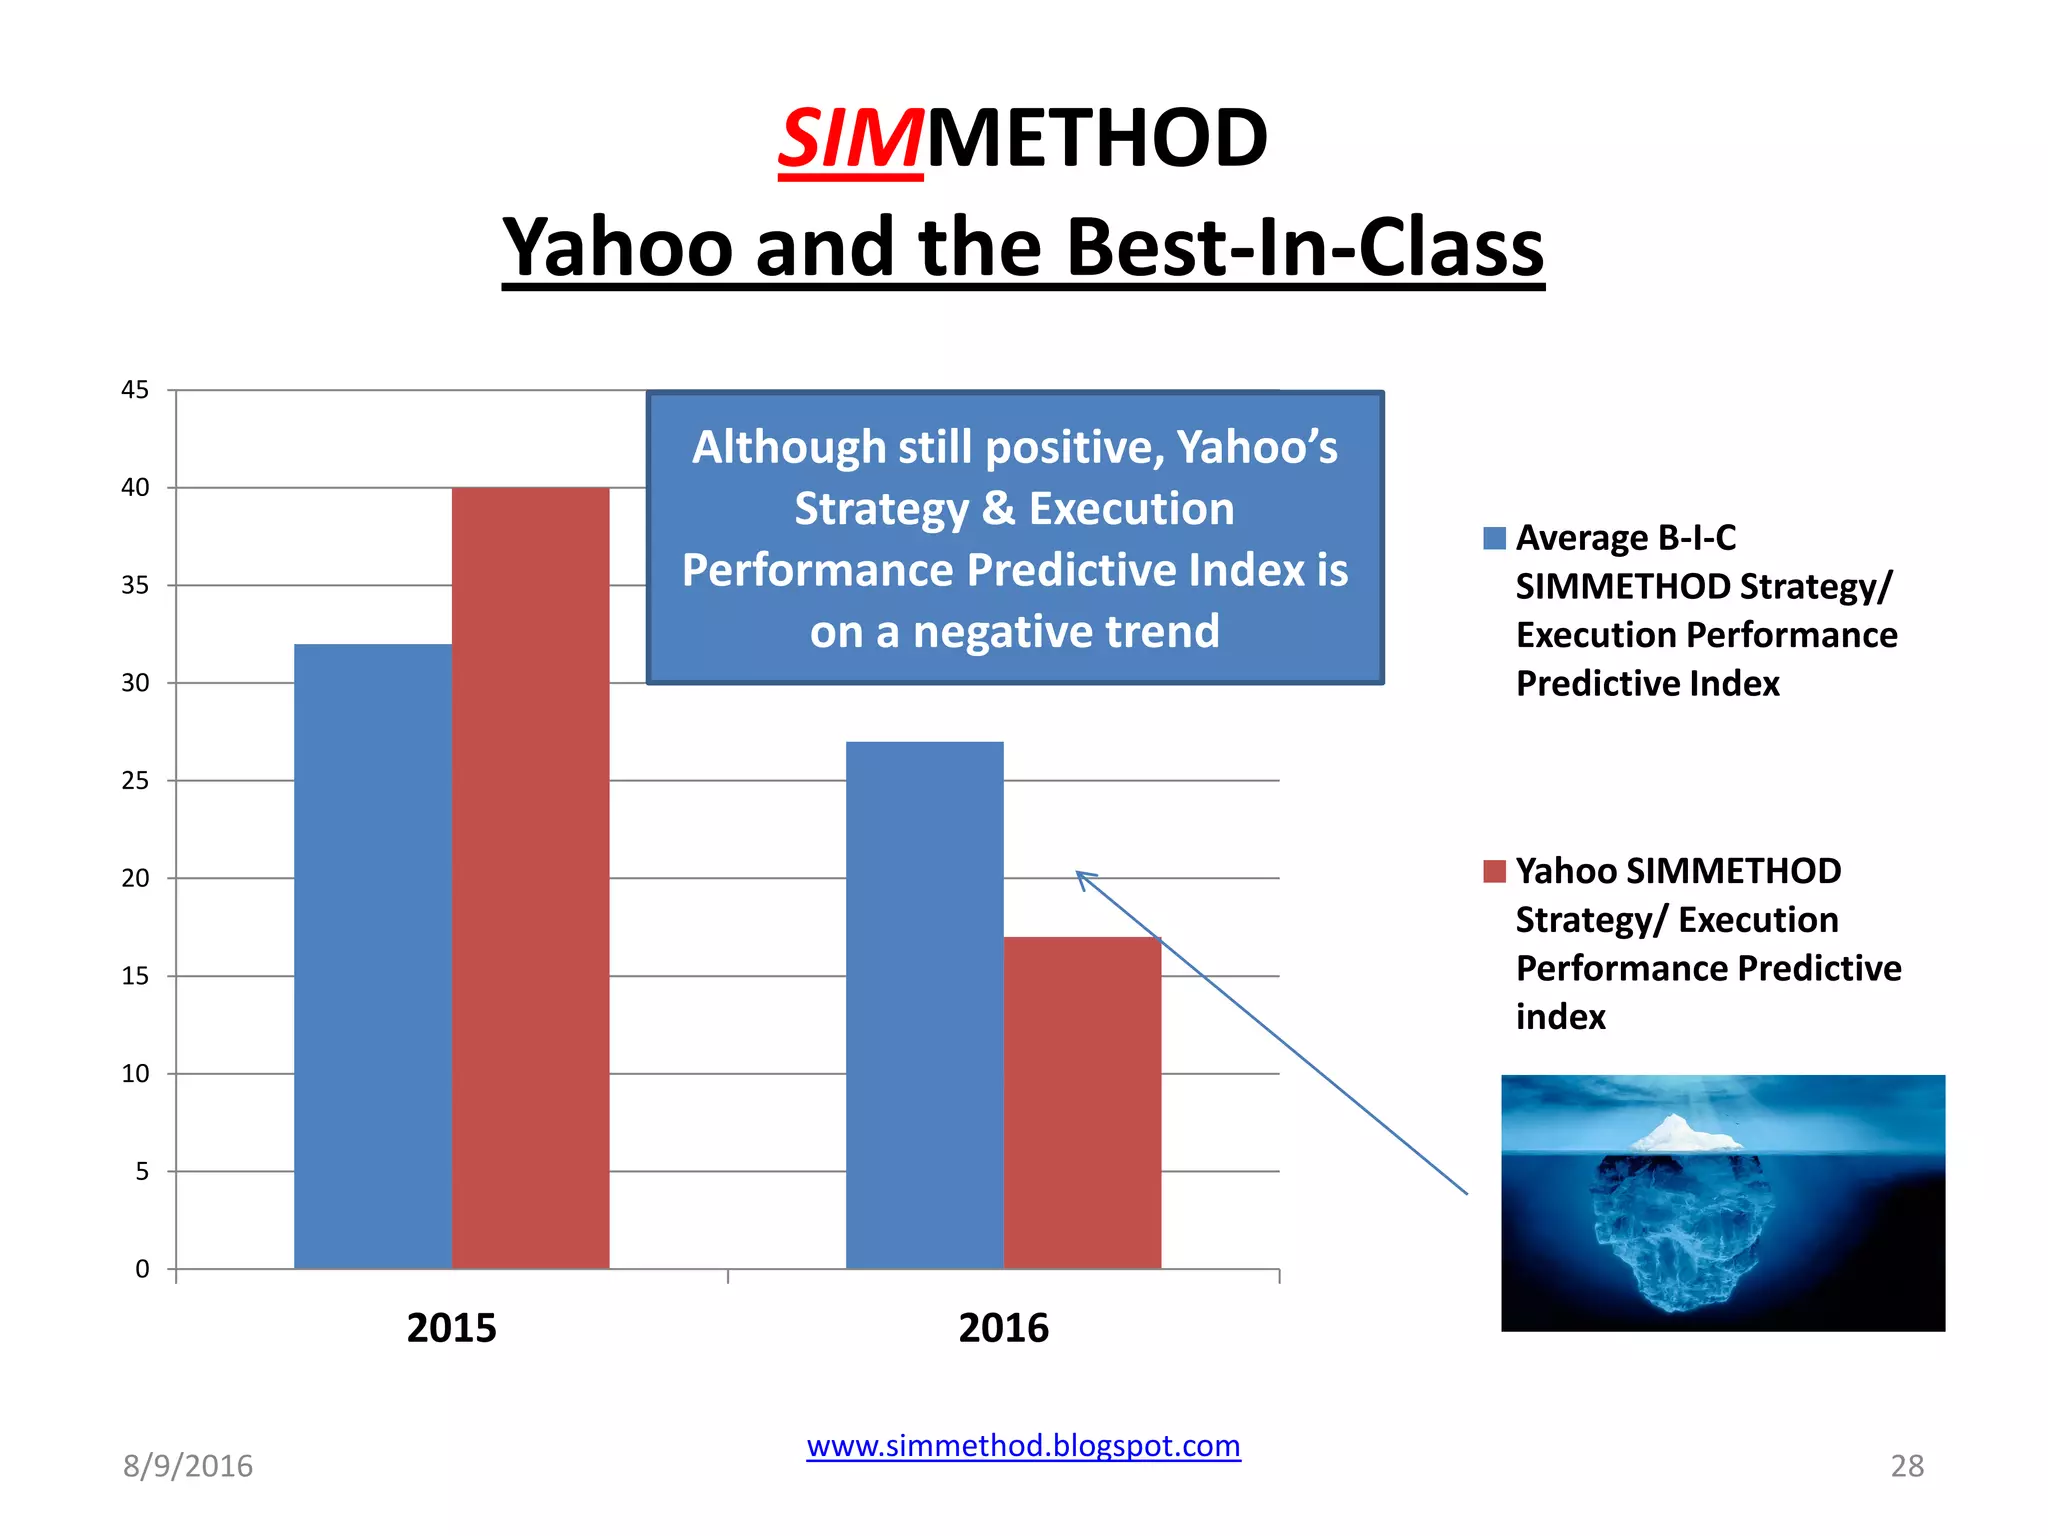
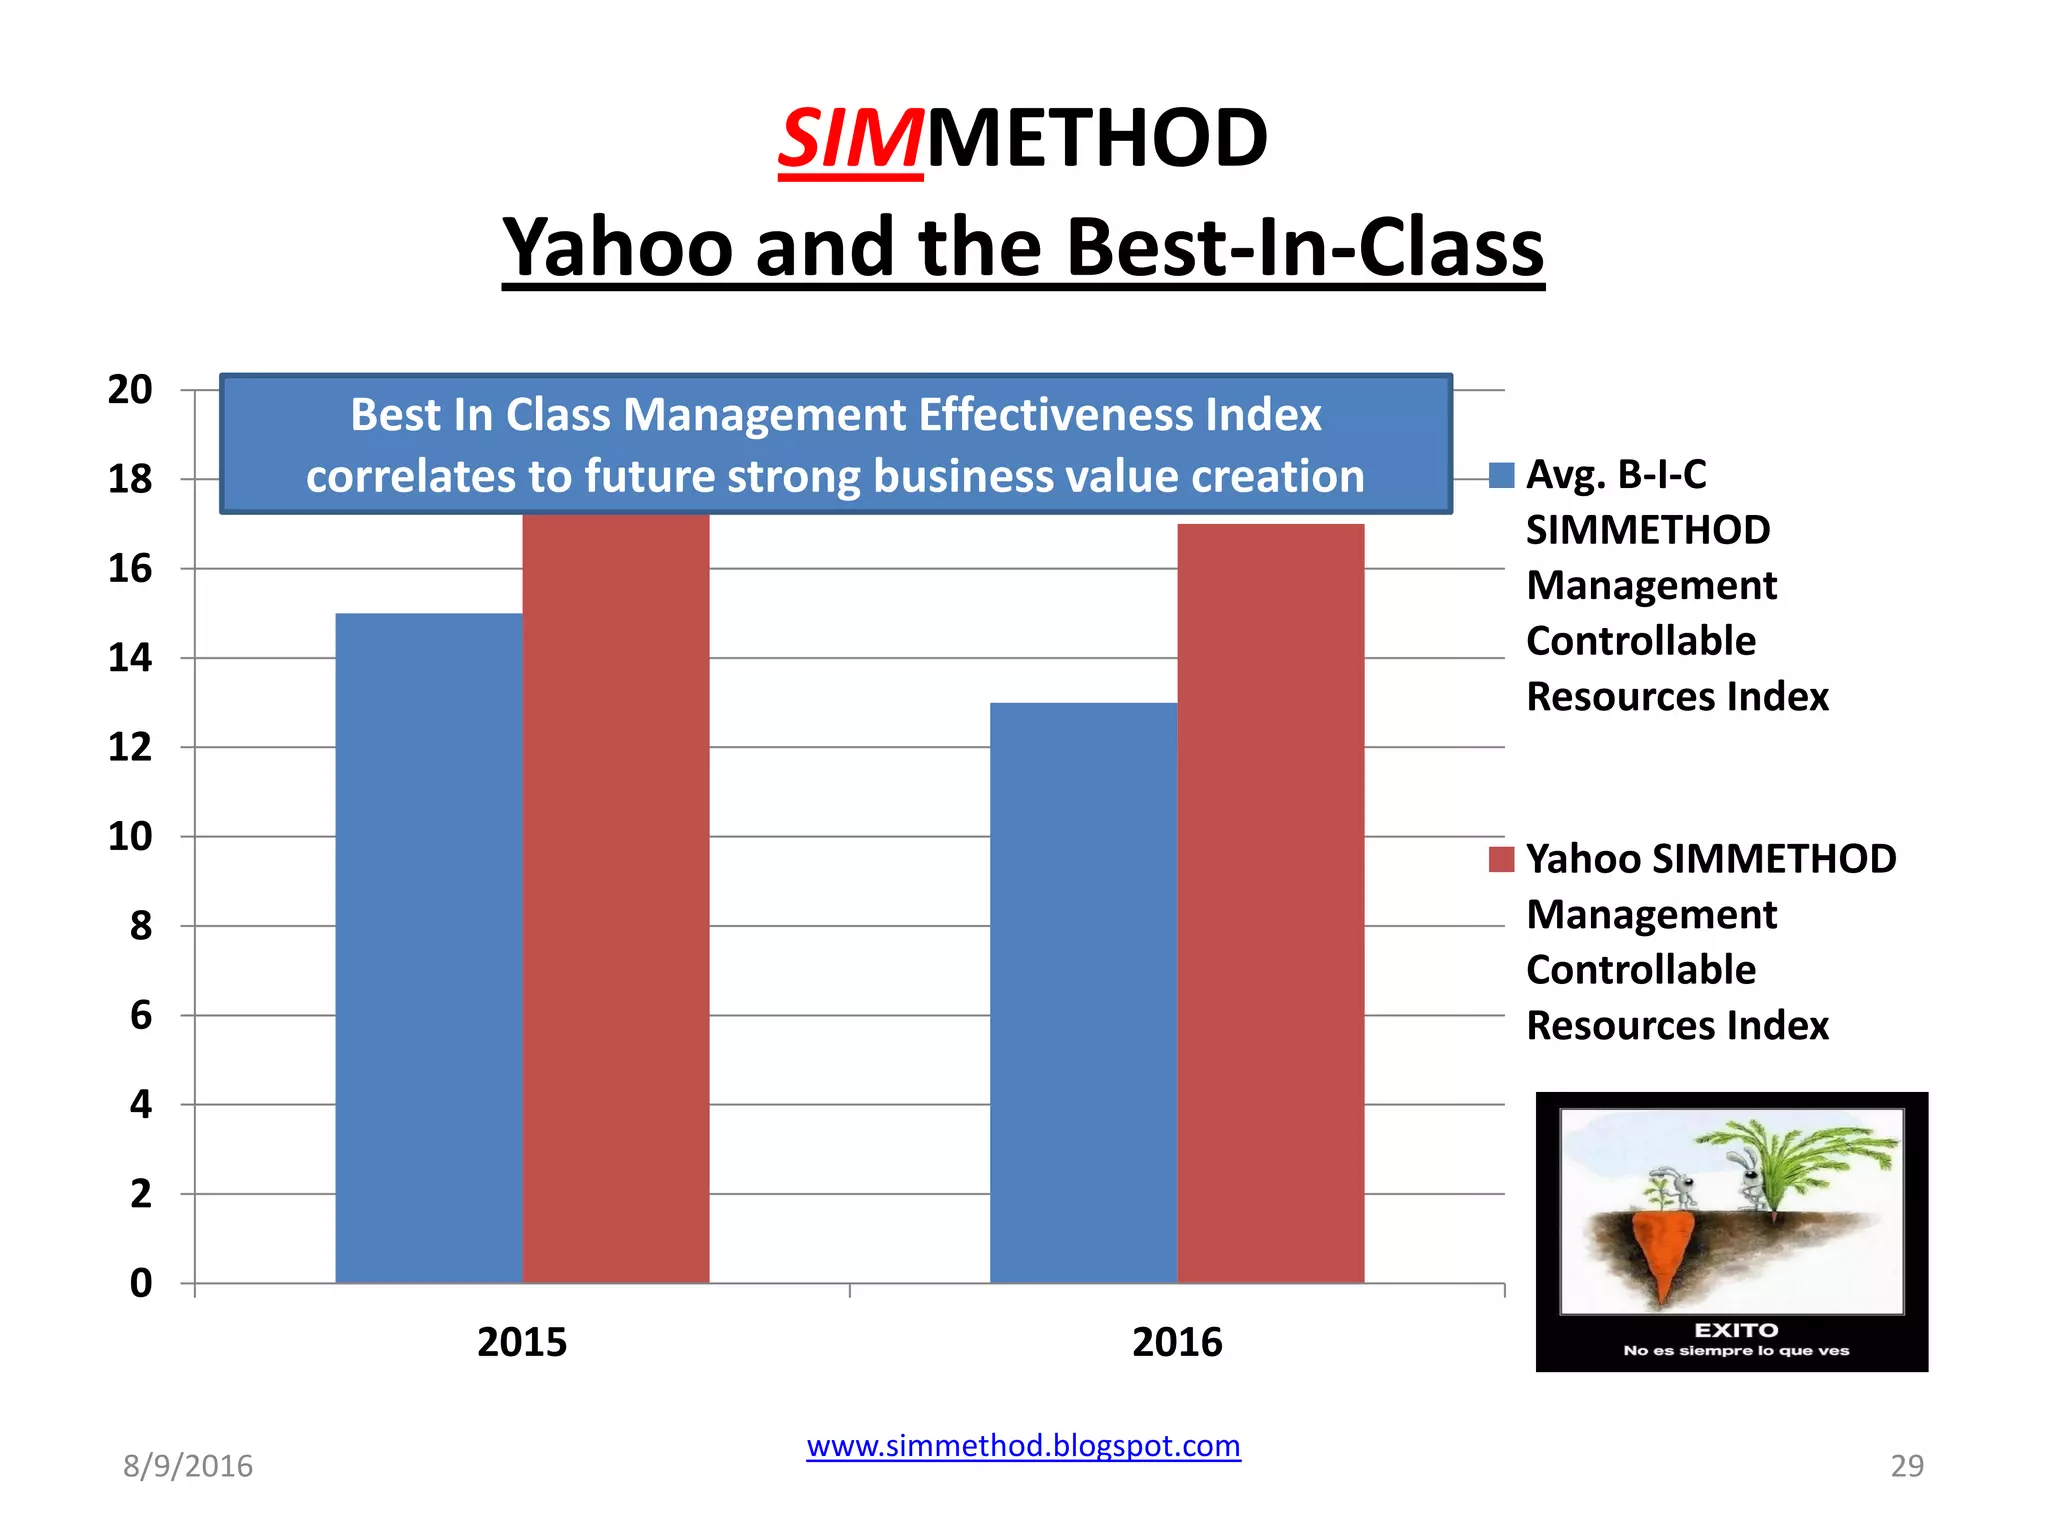
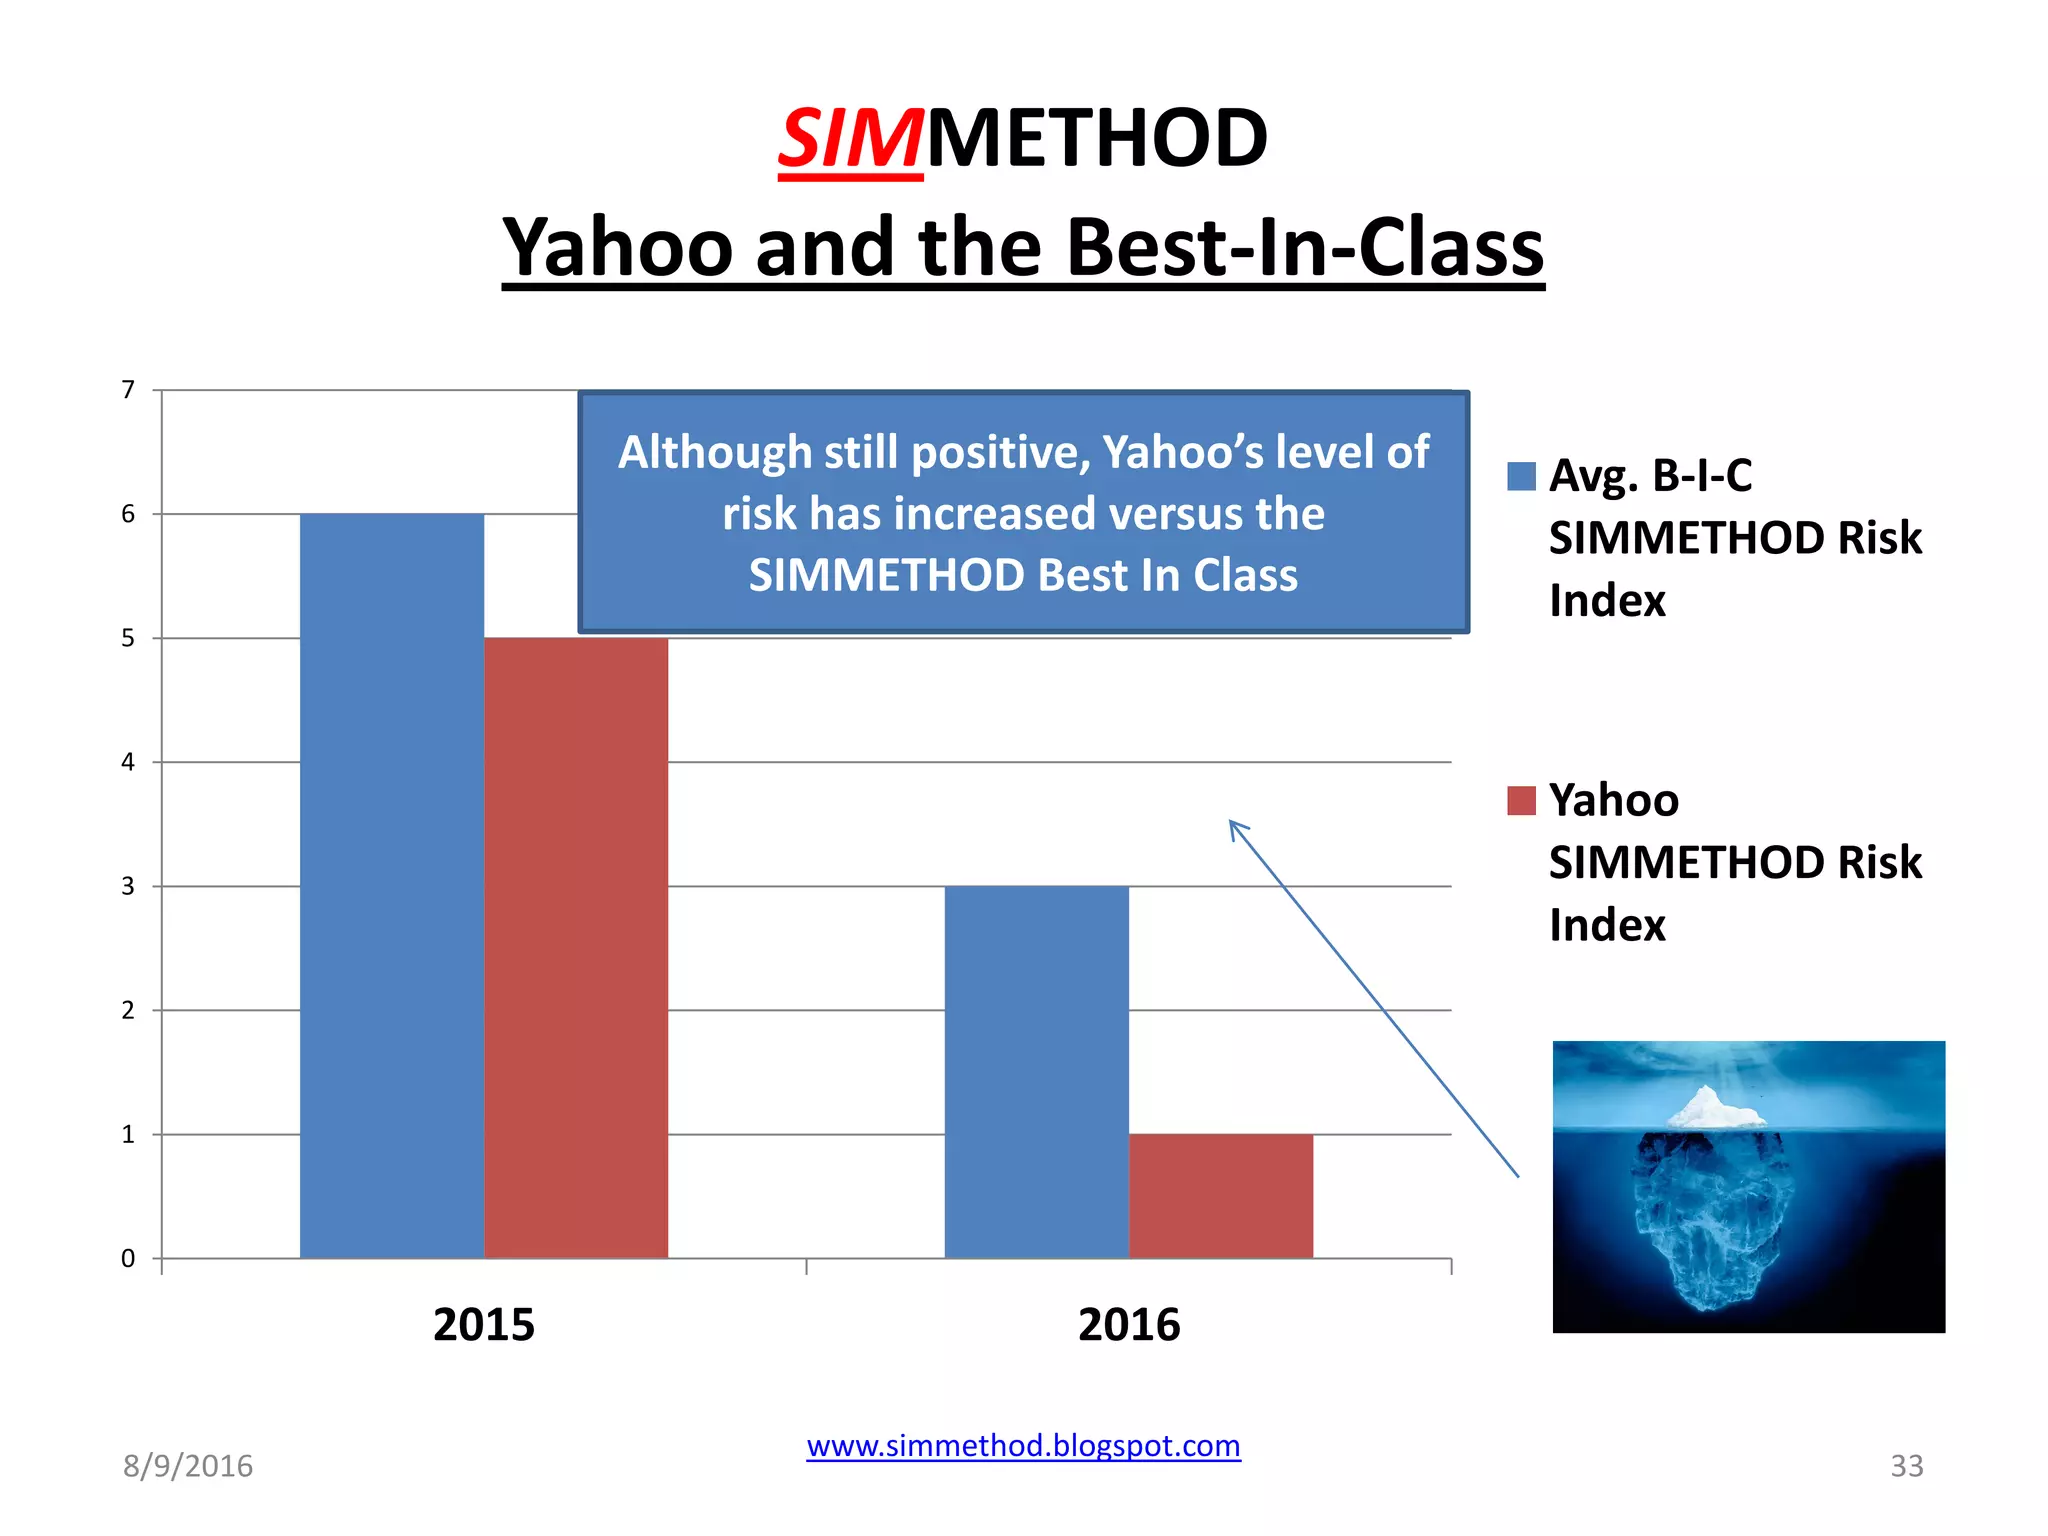
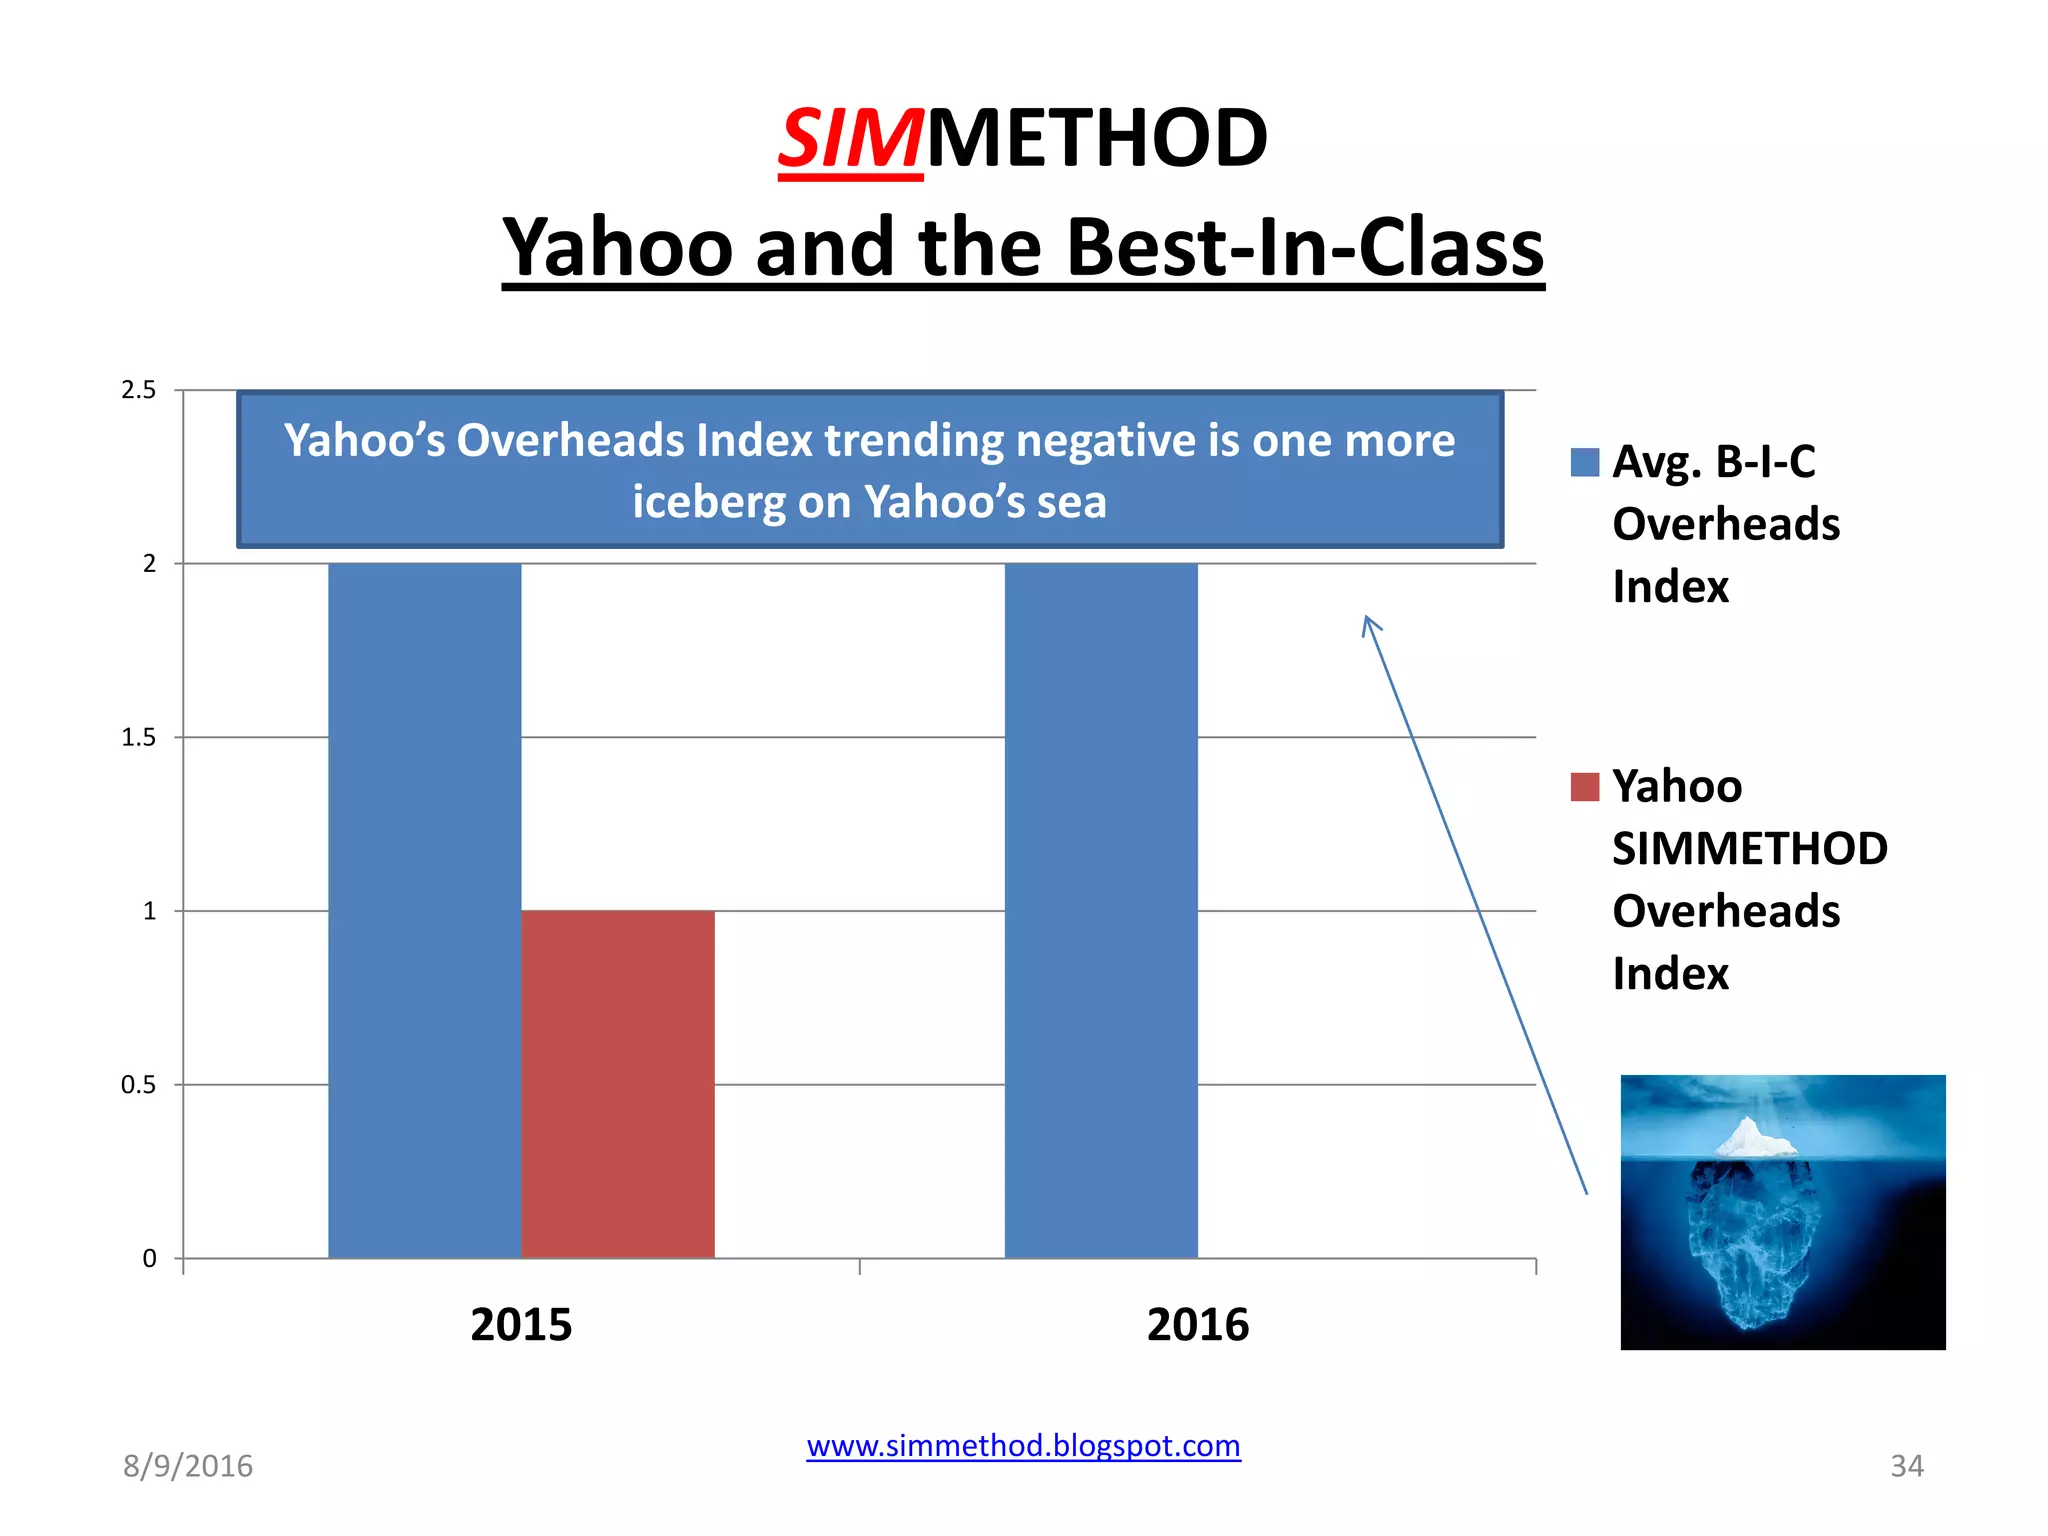
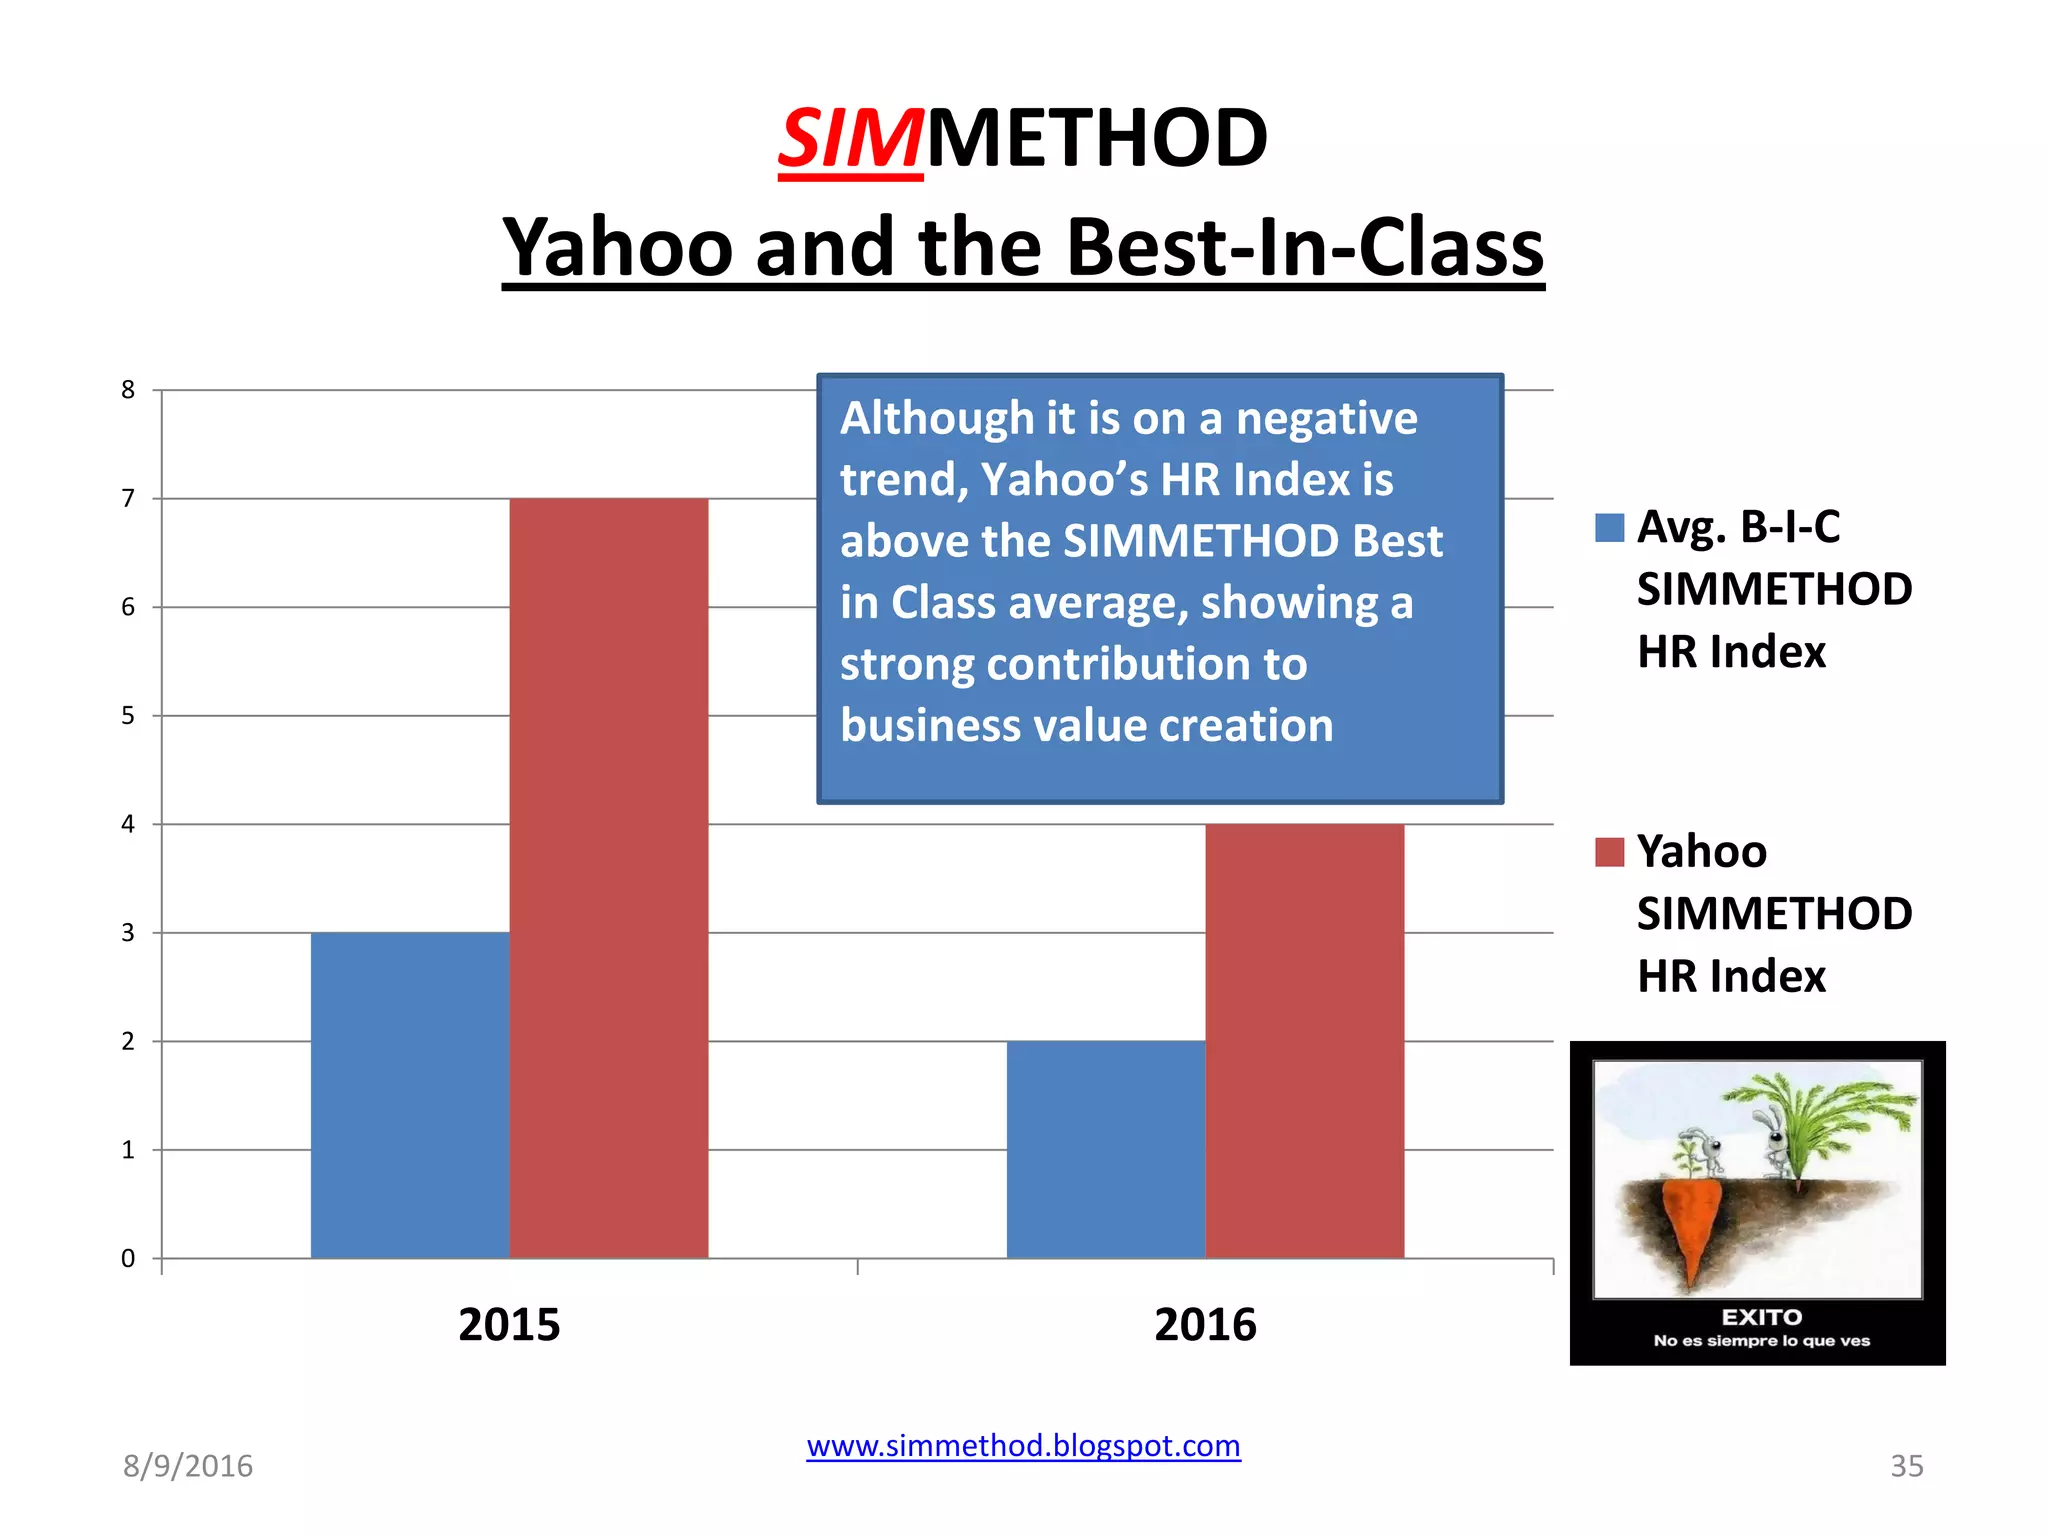
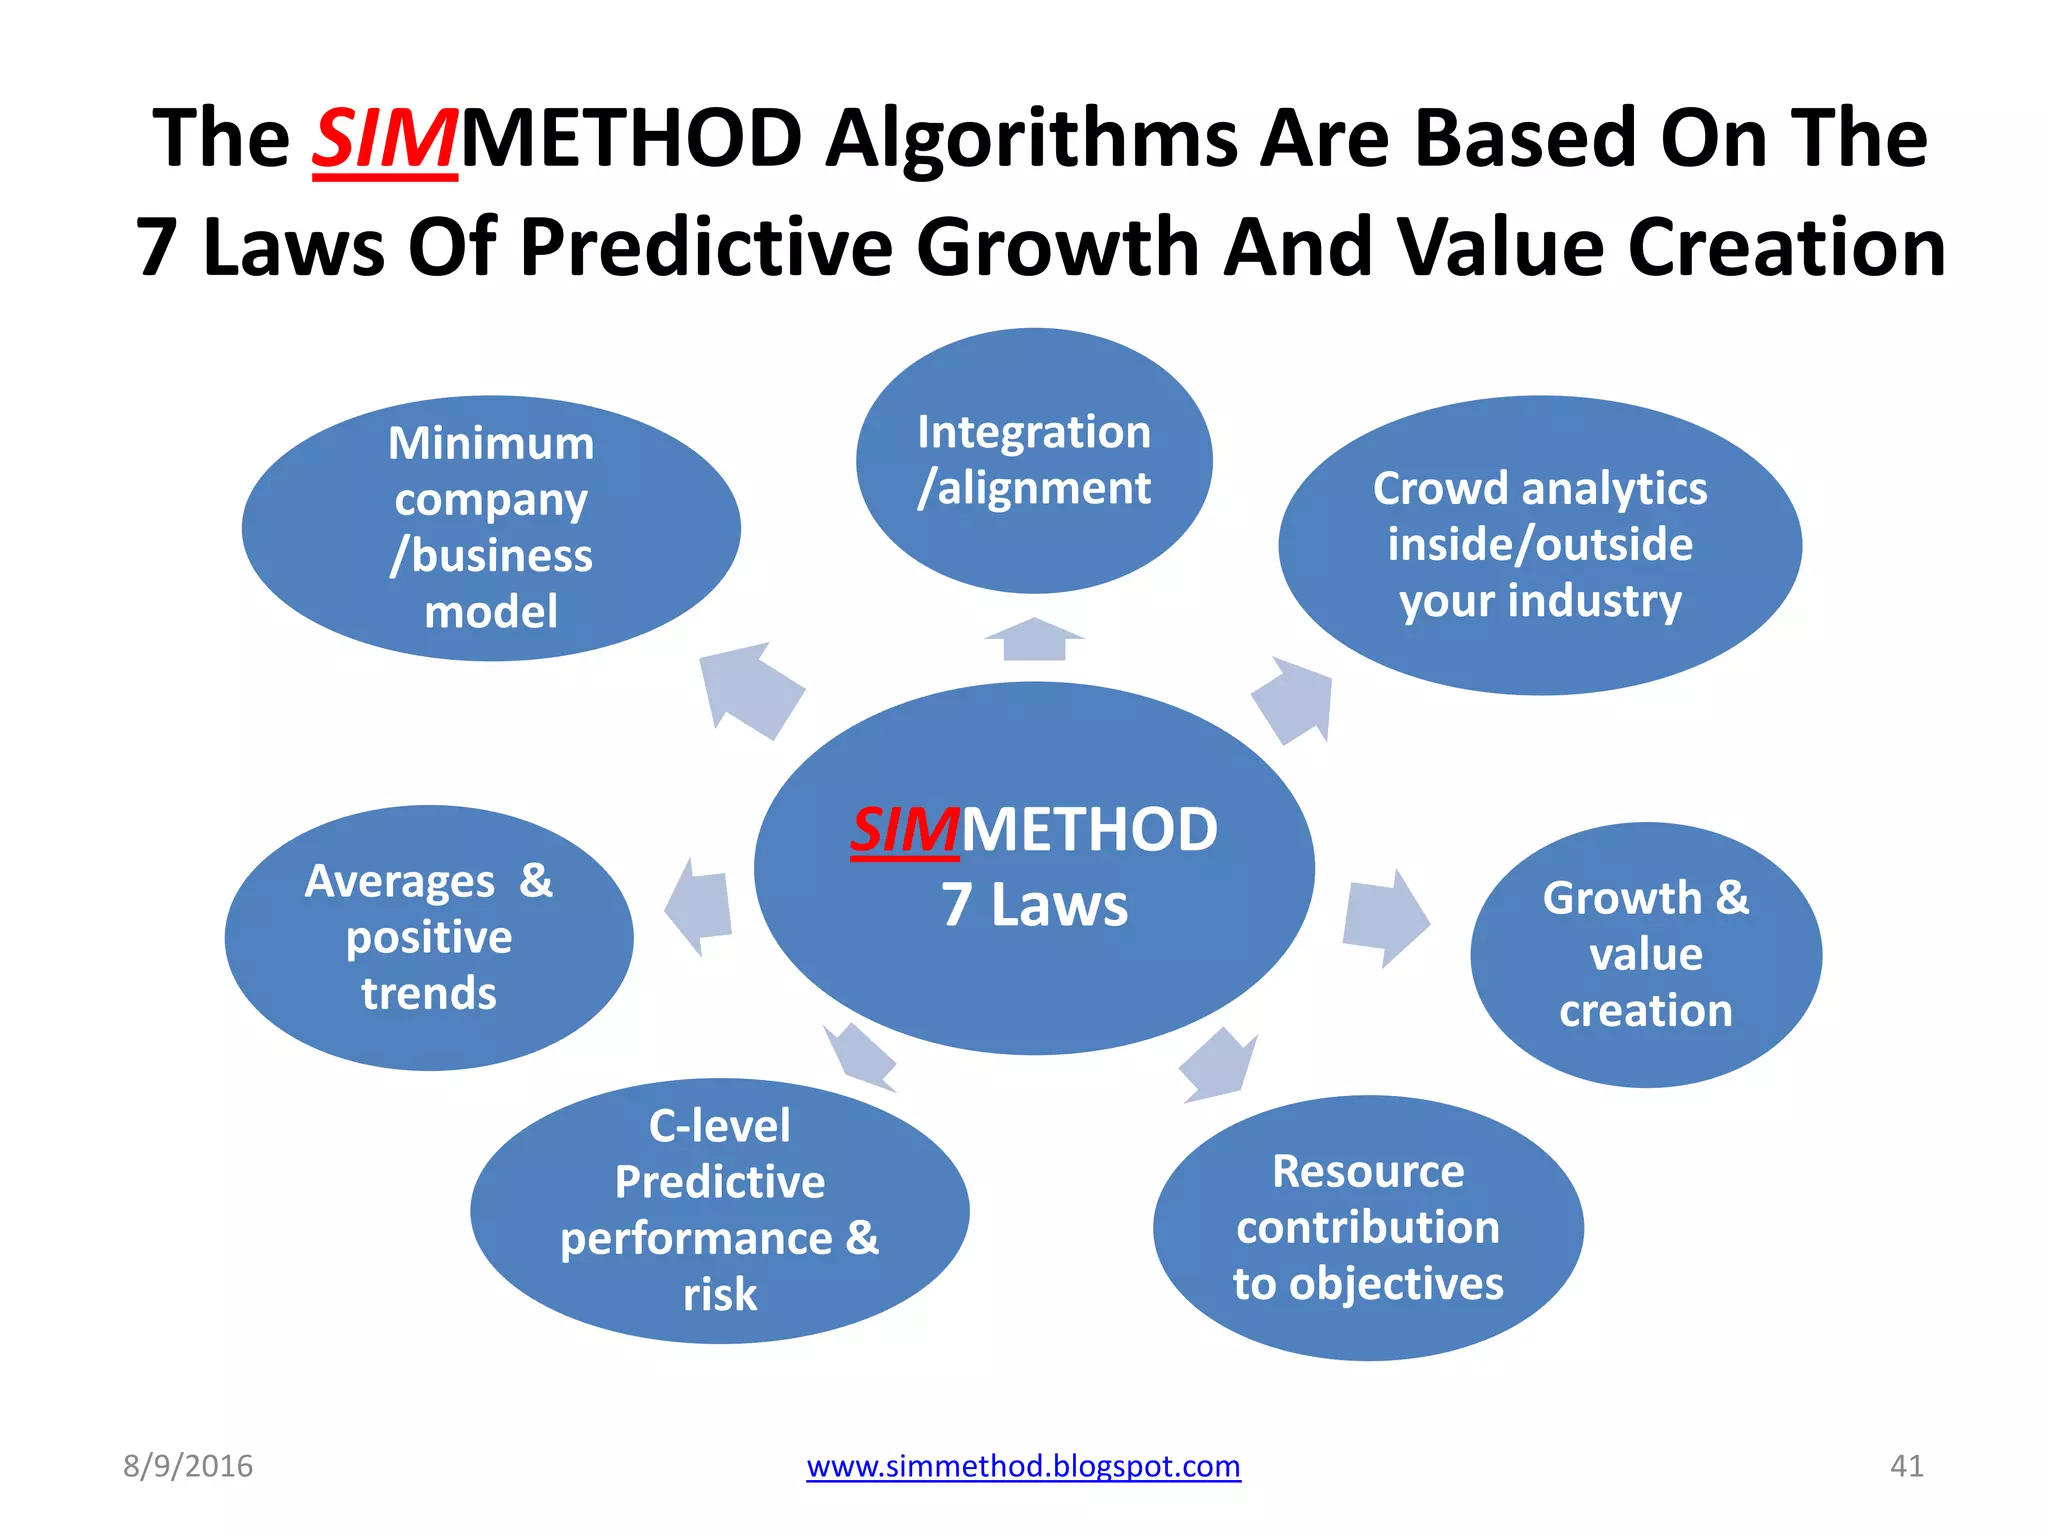
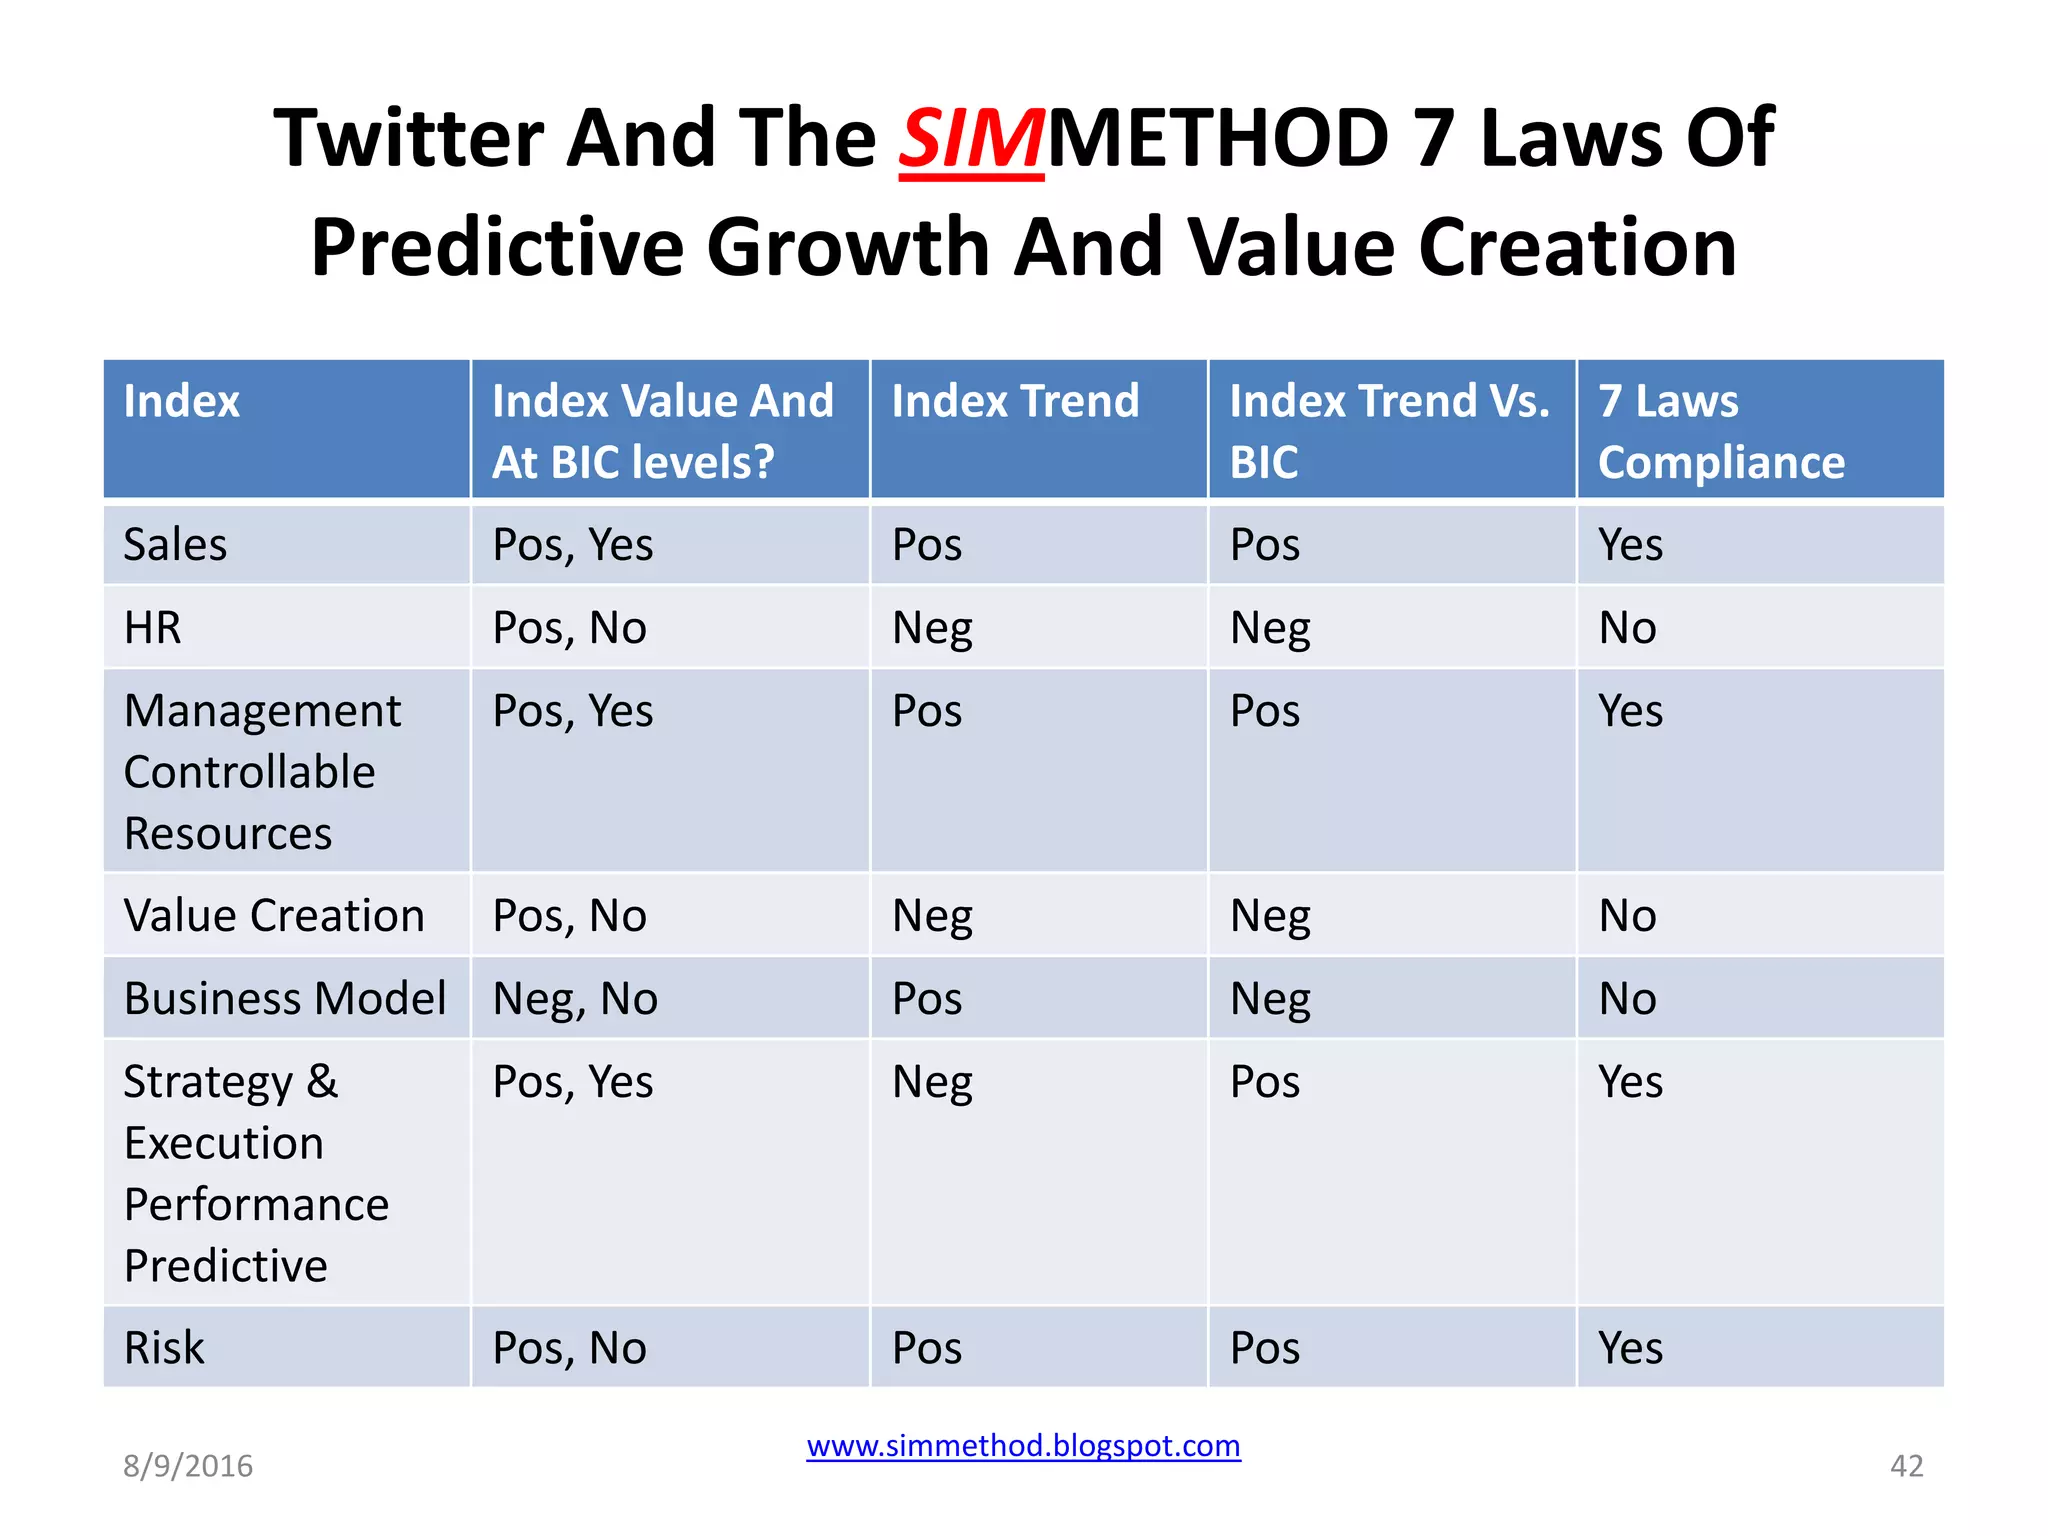
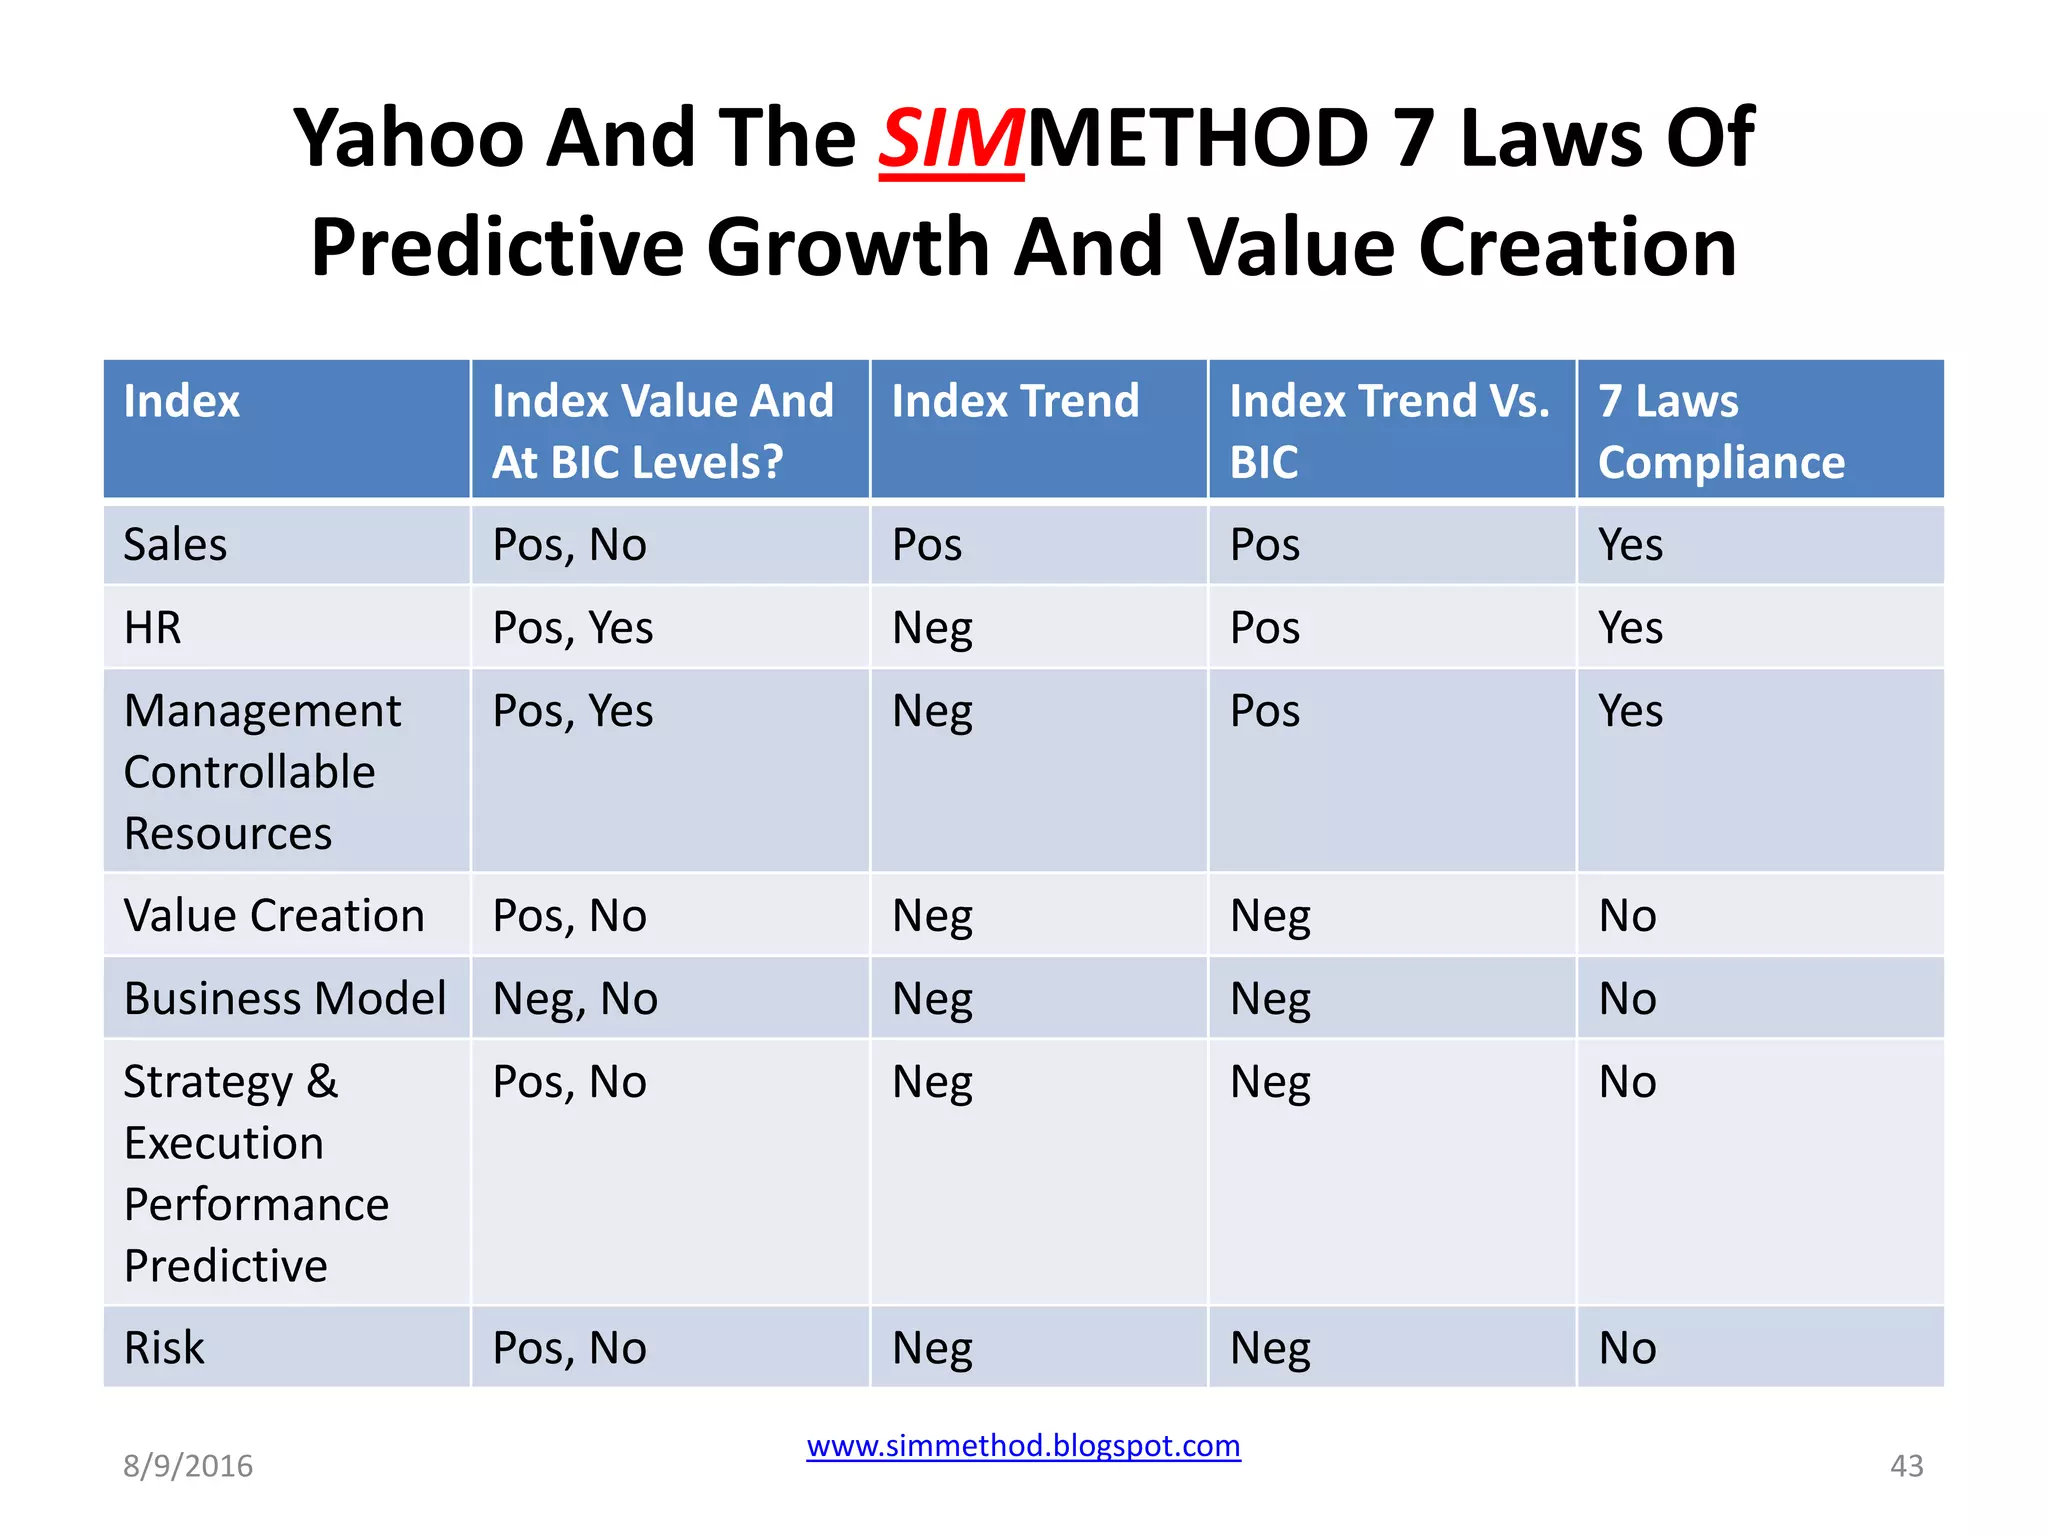
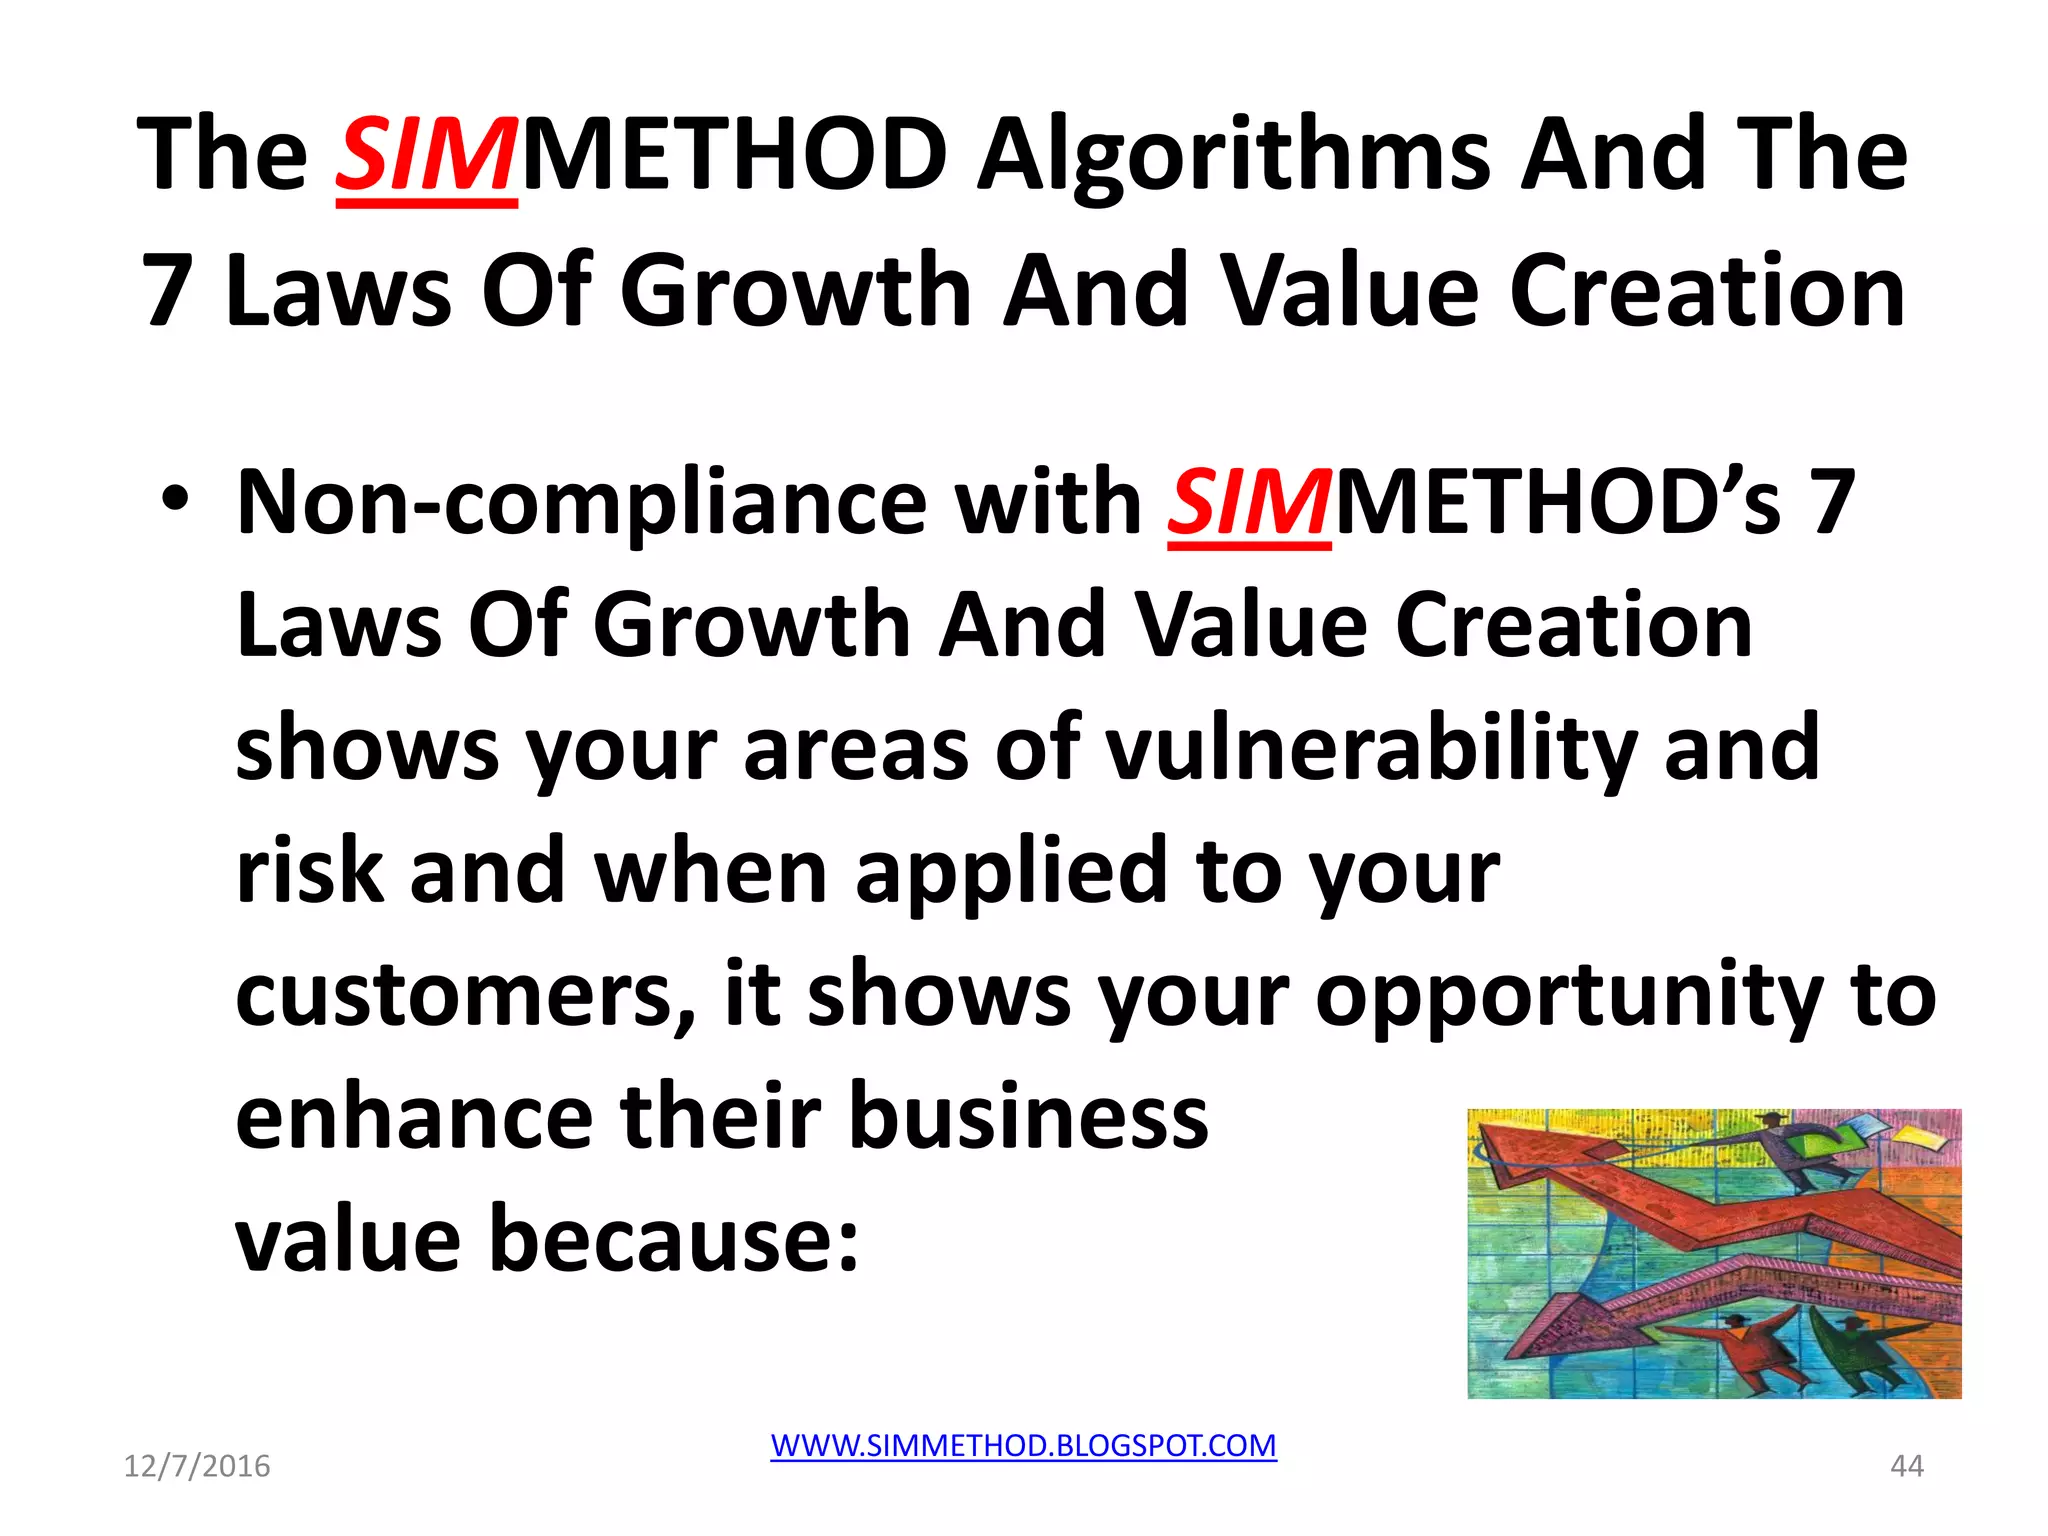
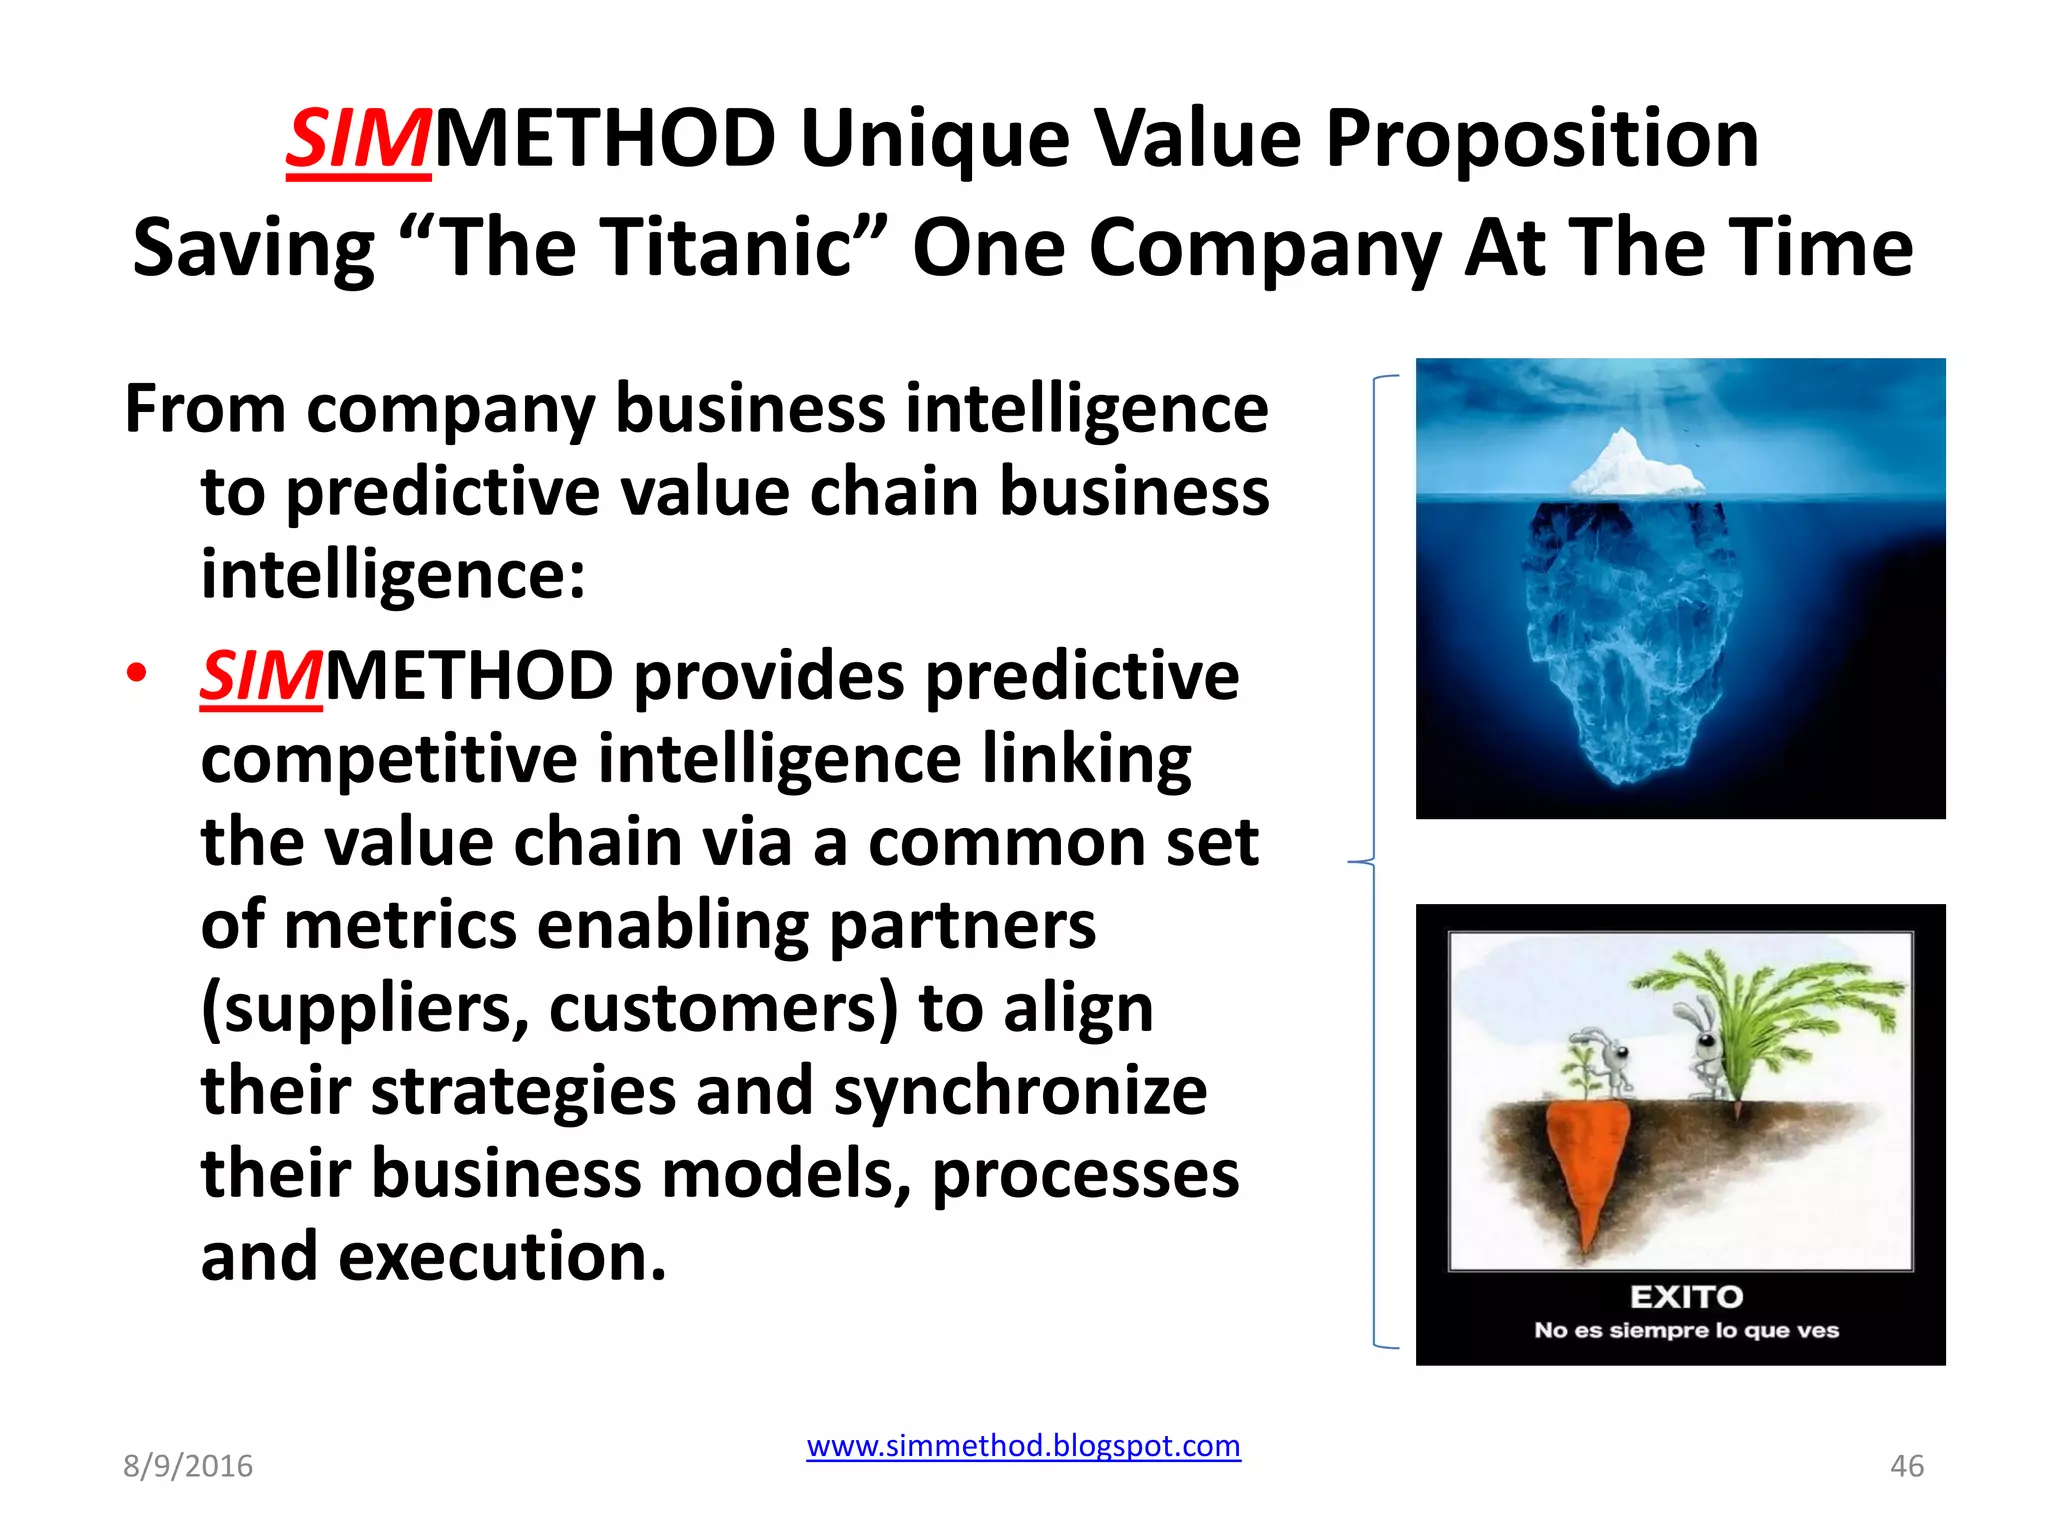
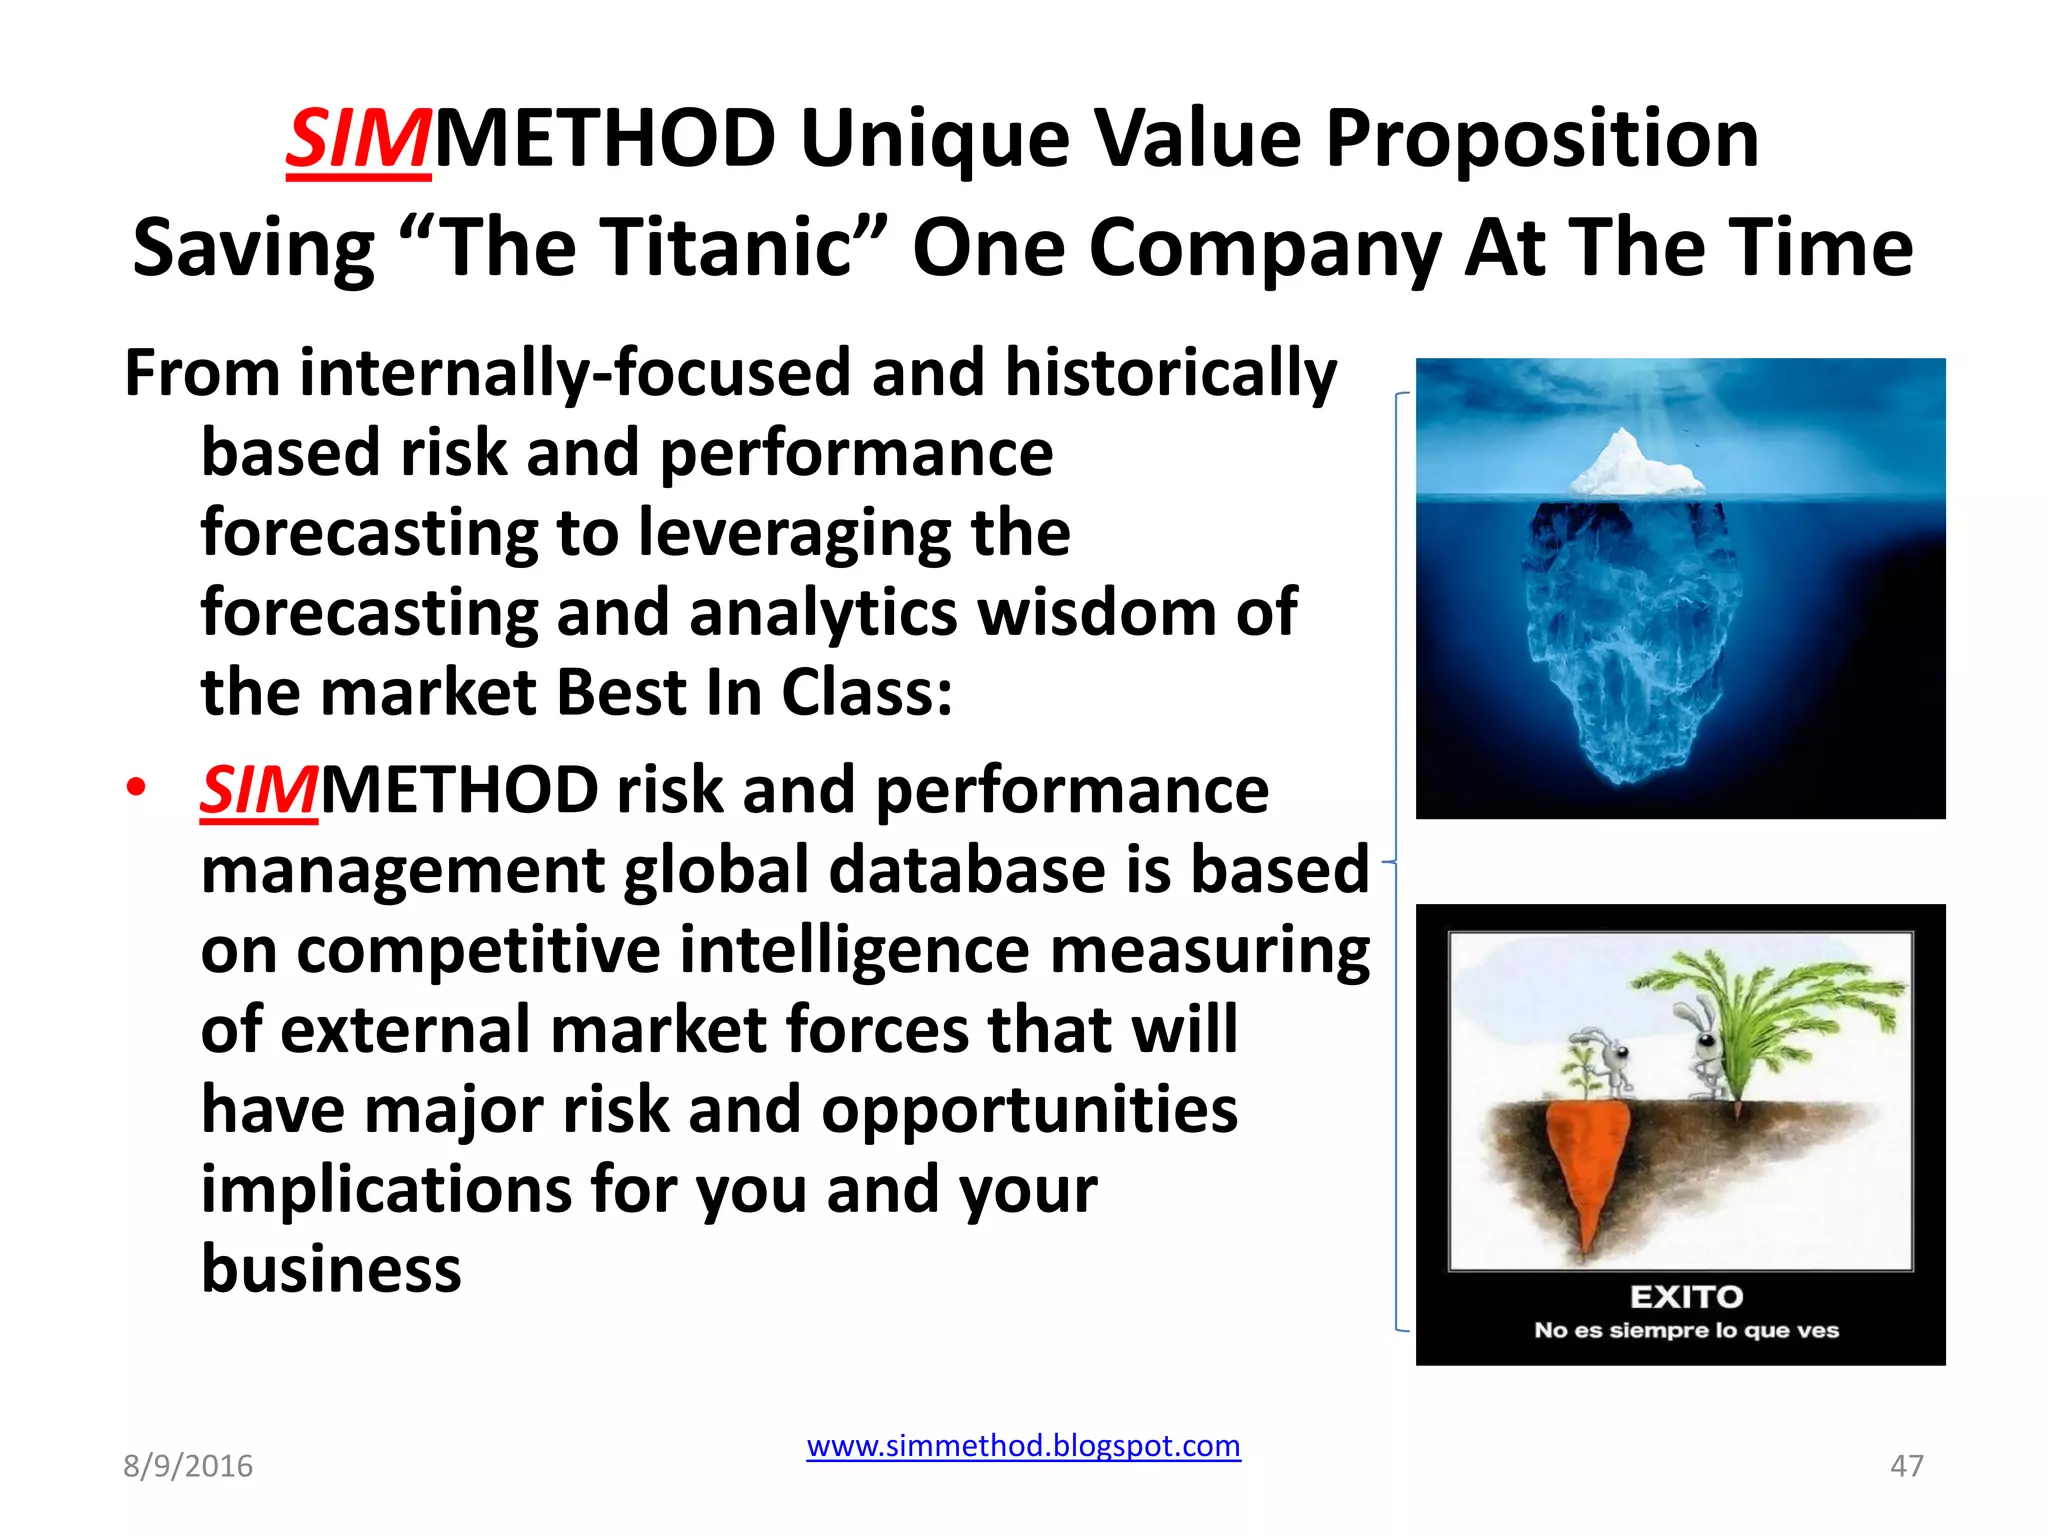
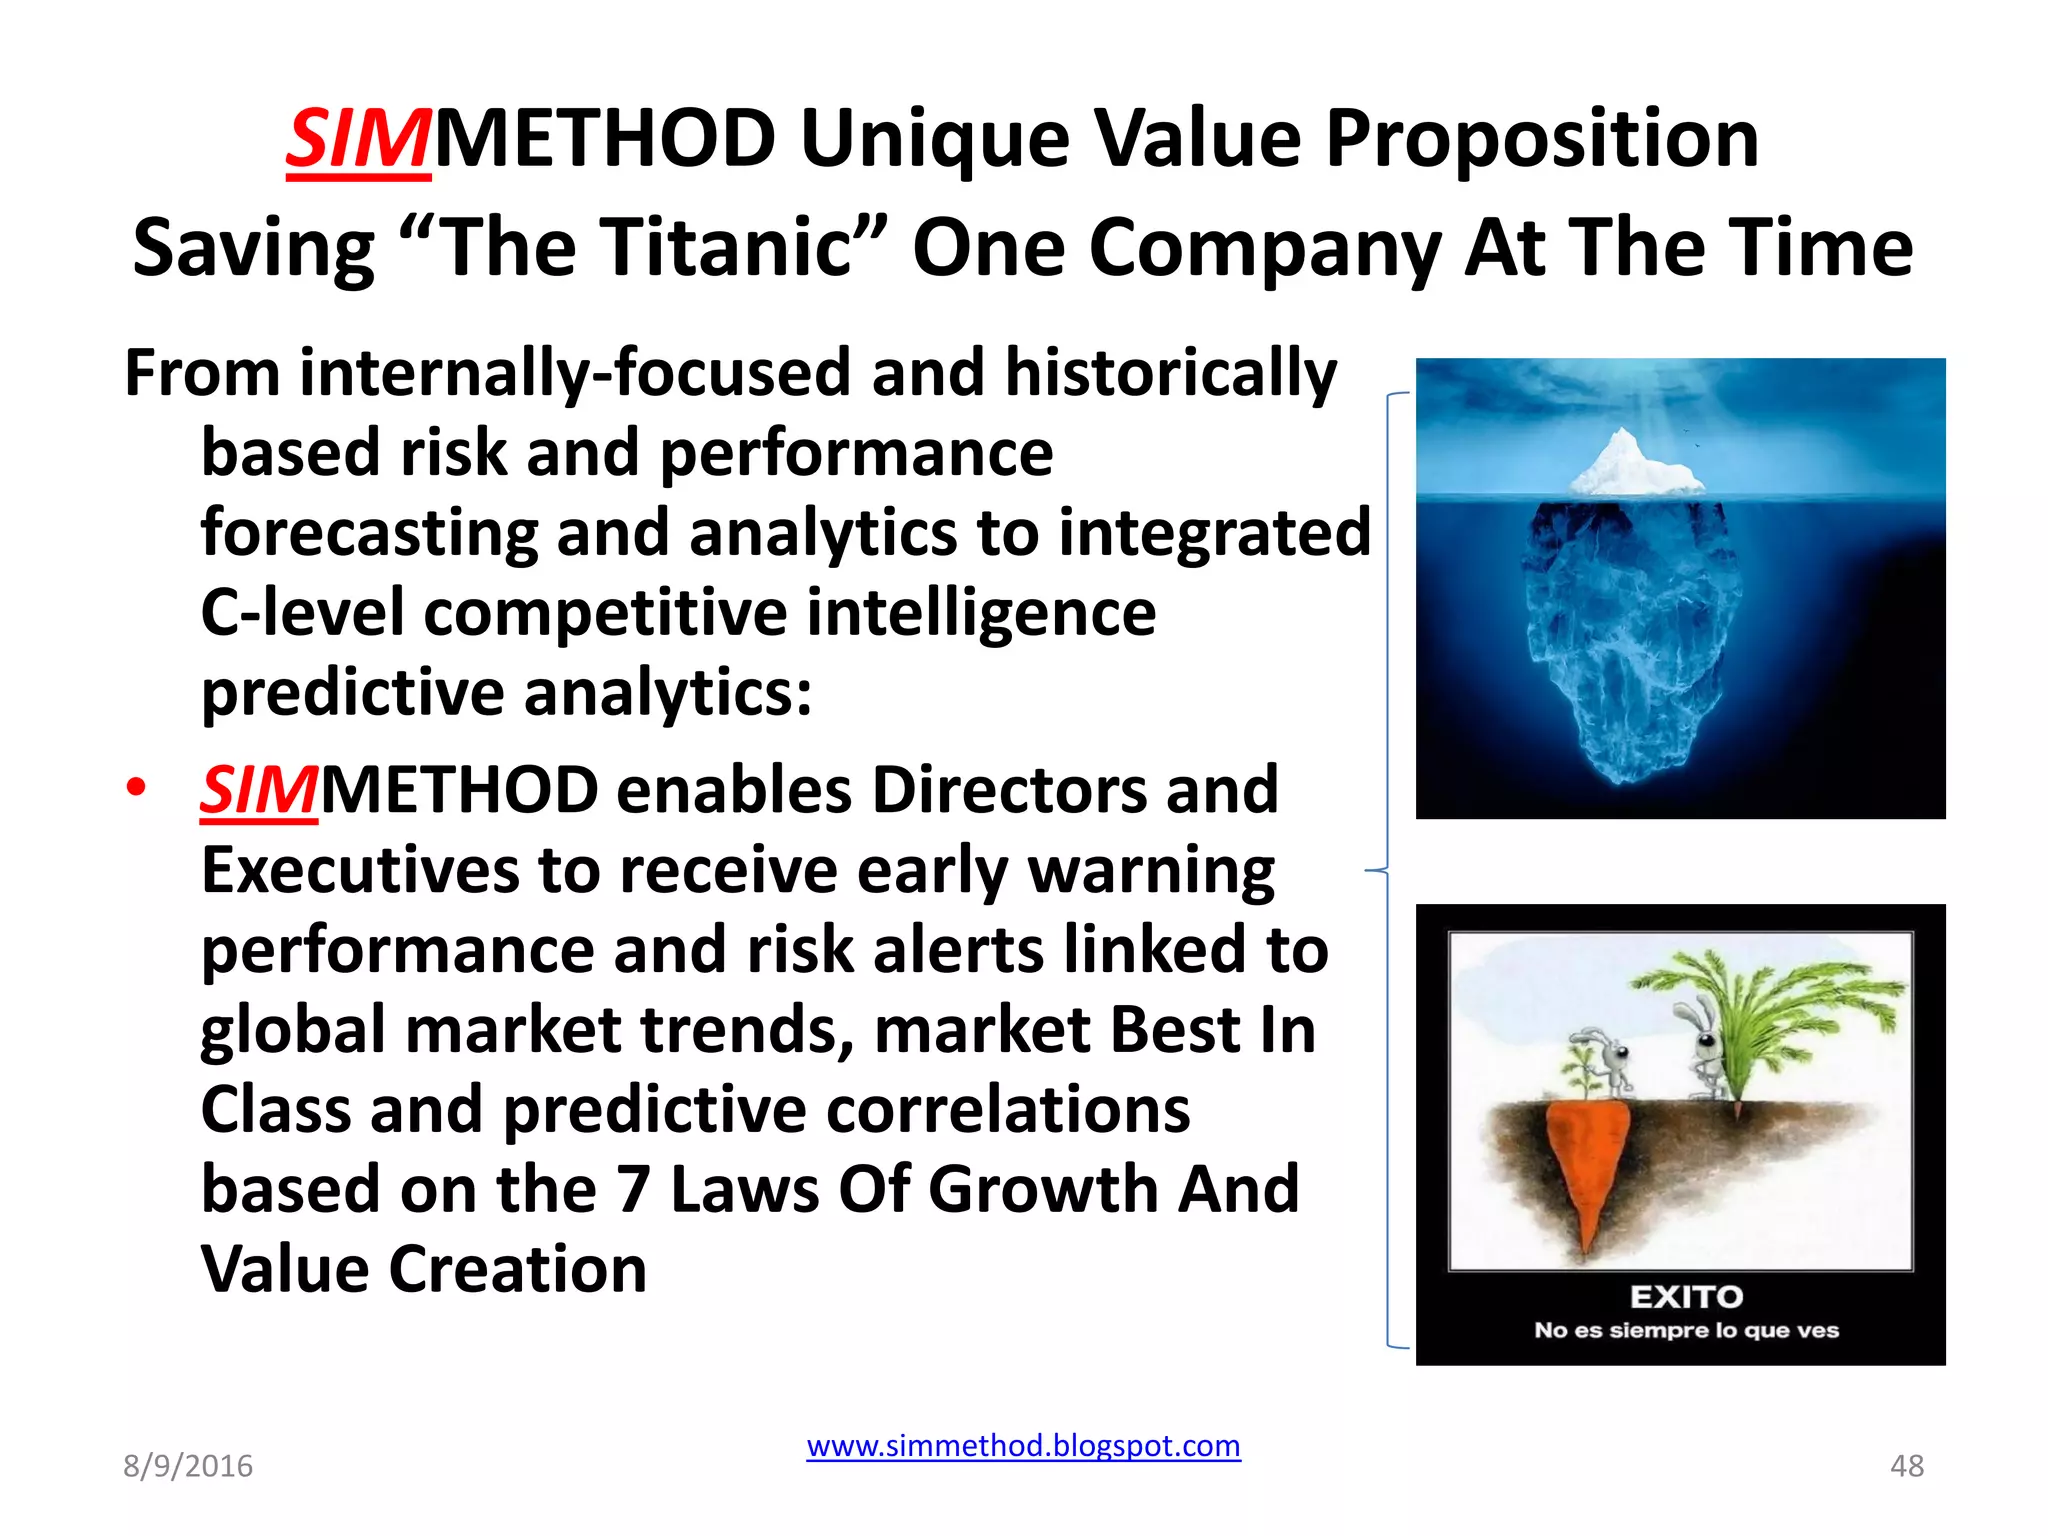
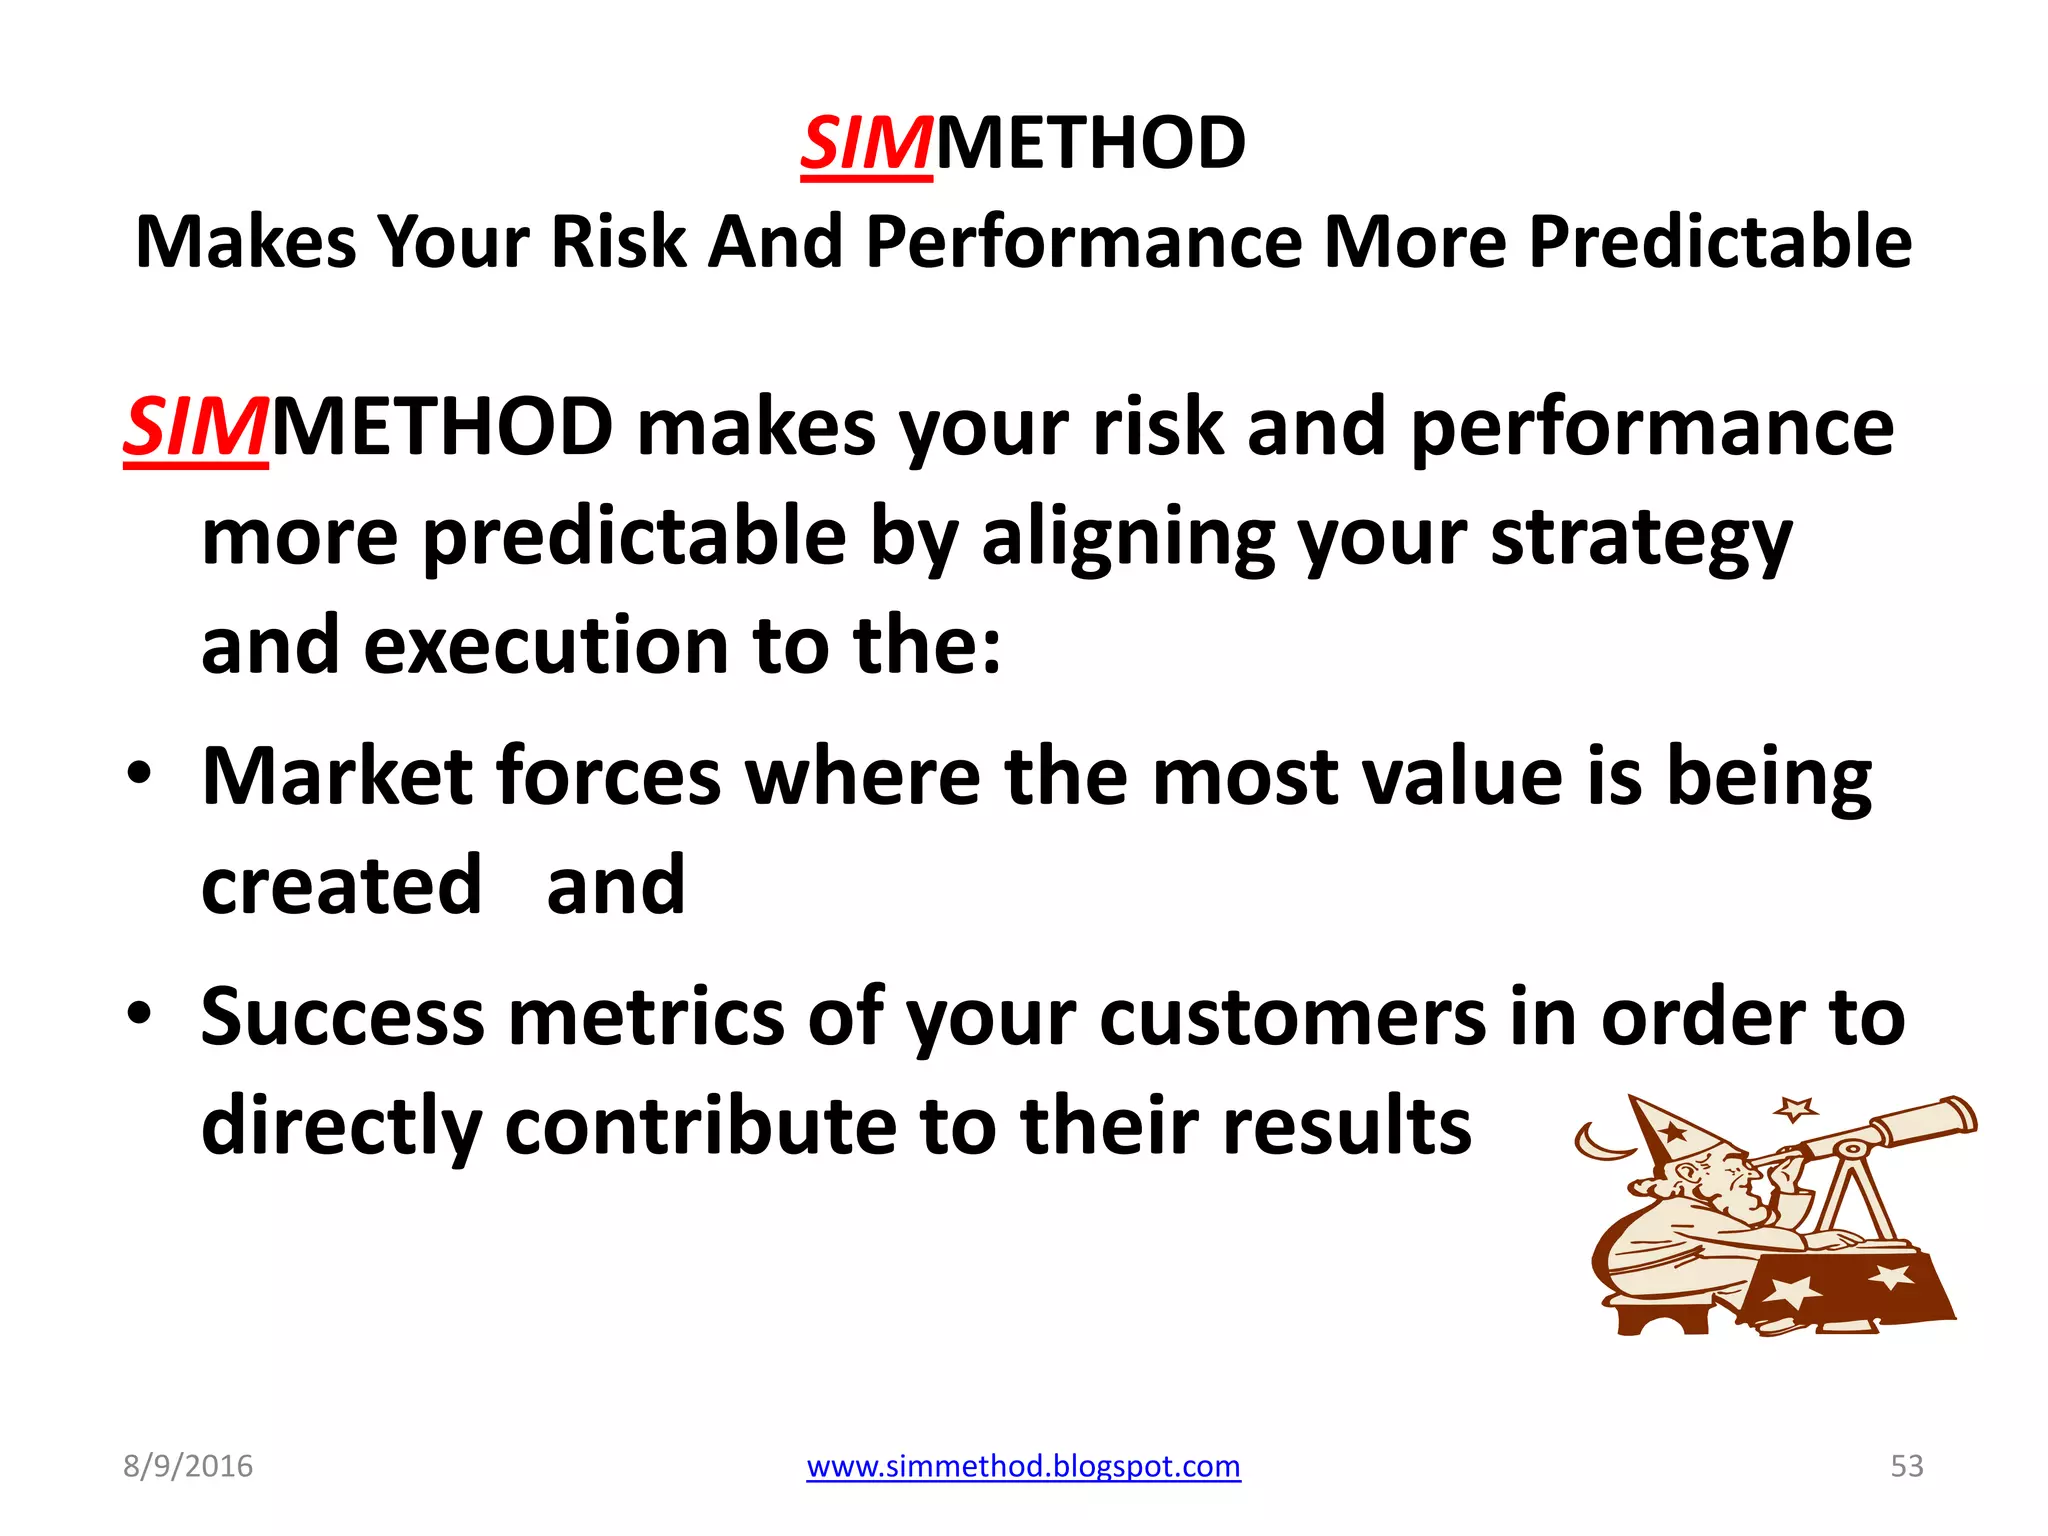
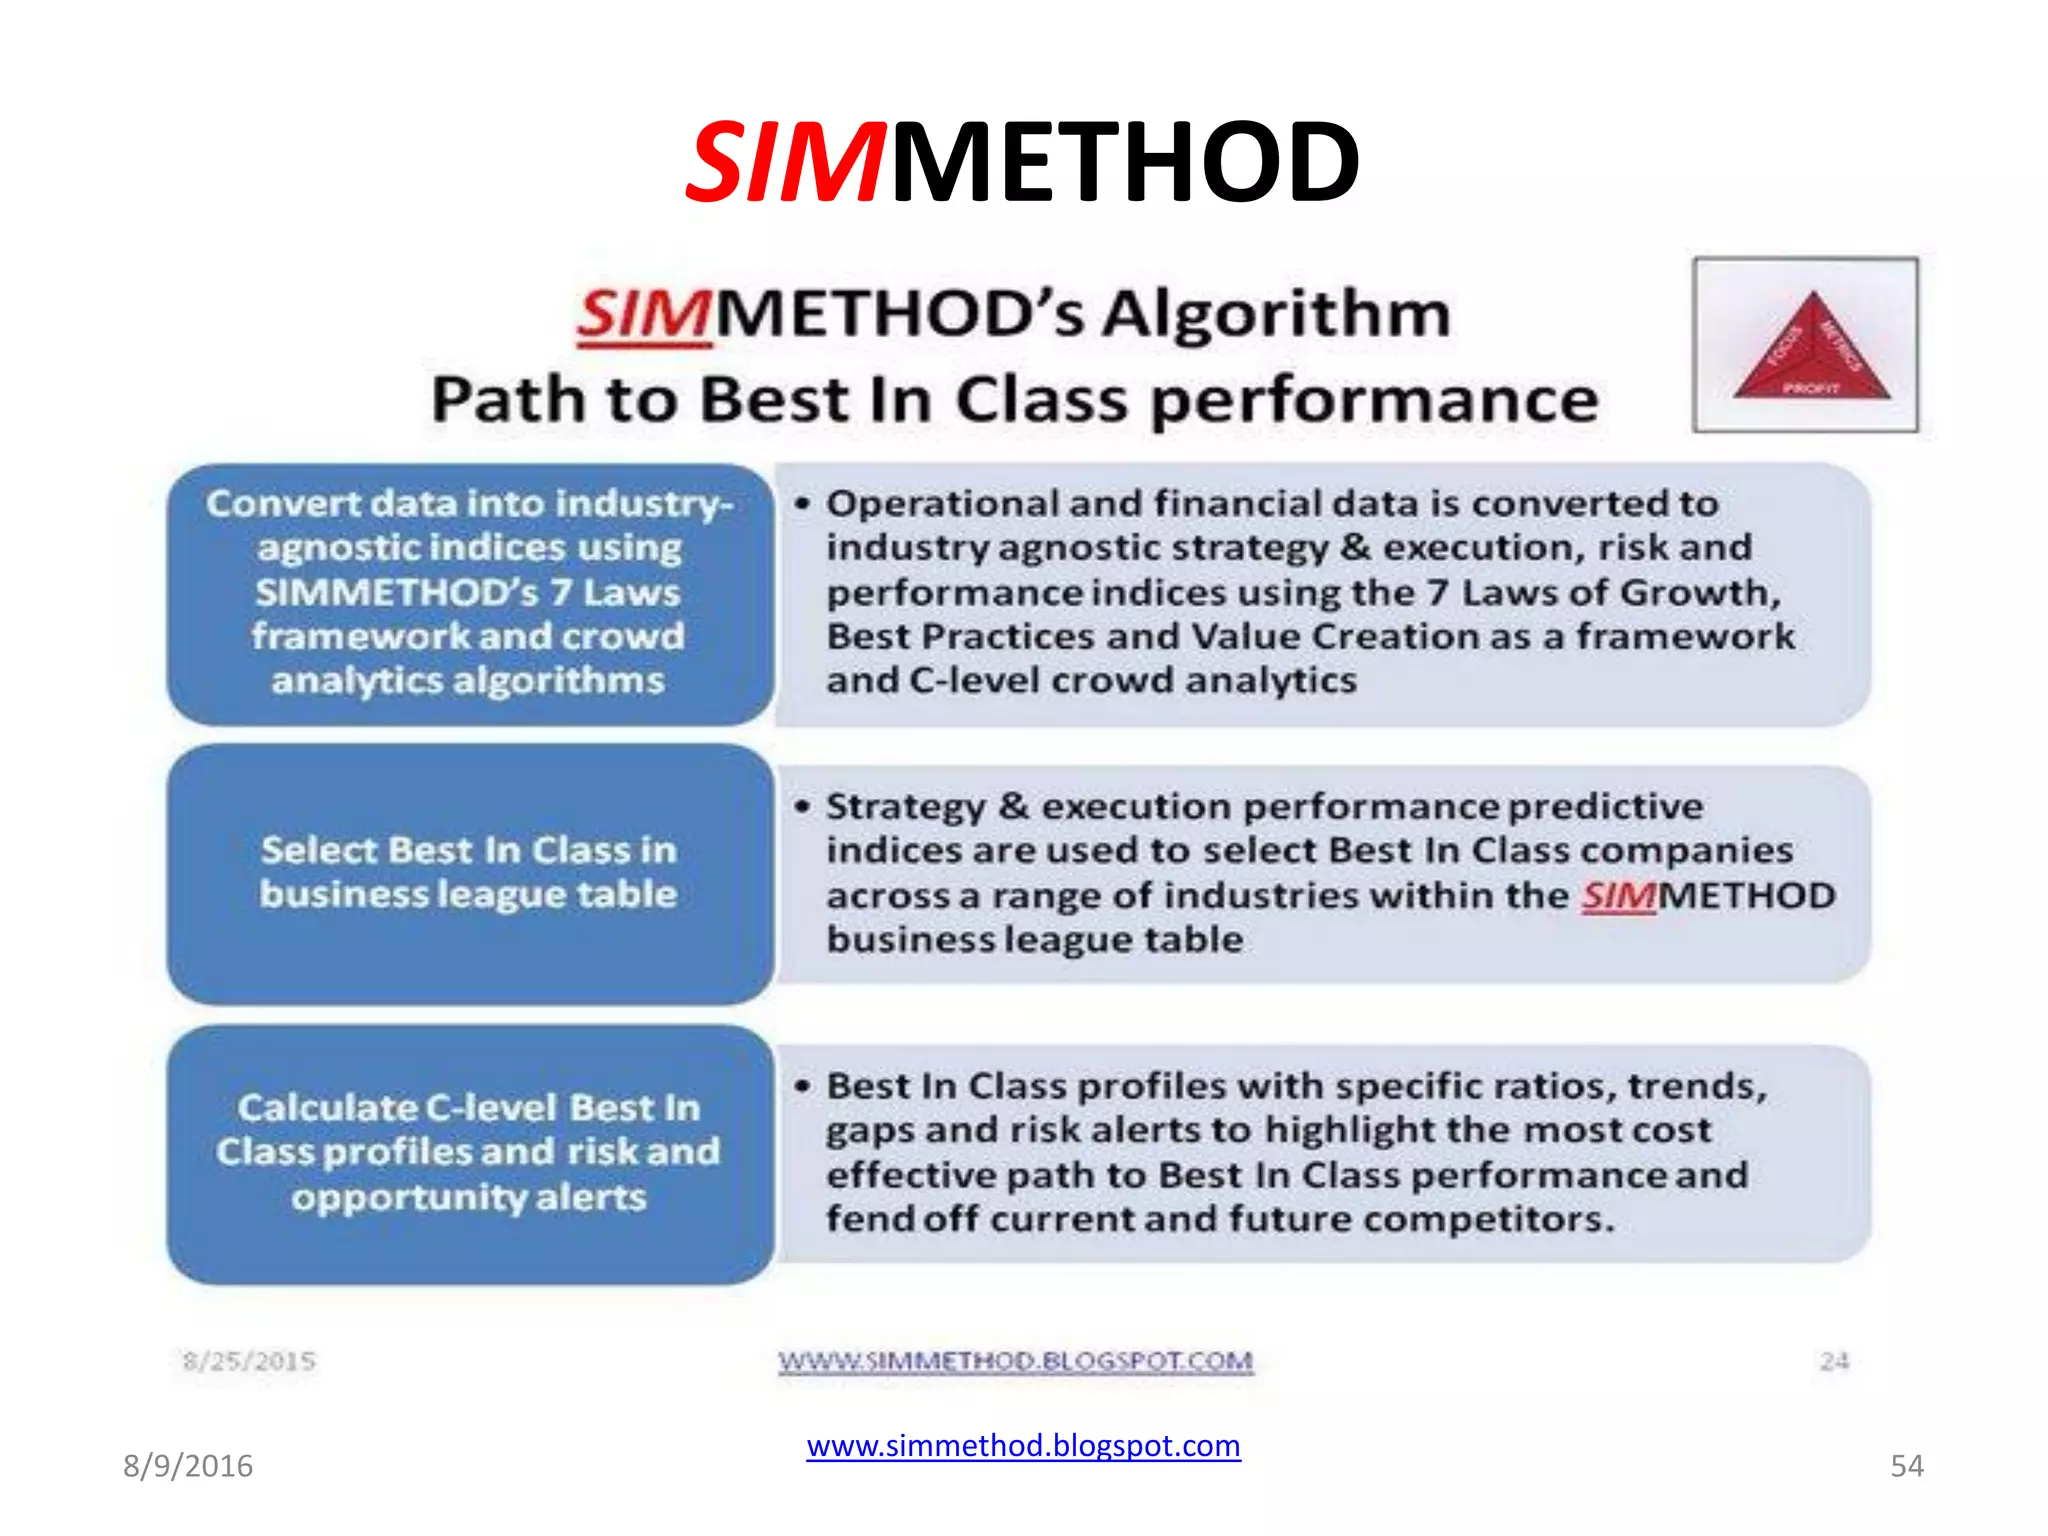
SIMMETHOD
From Software As A service To
Outcomes As A Service
Towards A Single Index To Measure And
Predict The Outcomes Of Your Strategy
And Execution
Twitter And Yahoo 2017 And Beyond
8/9/2016 1
www.simmethod.blogspot.com
The Way We Measure Corporate Risk
And Performance is Broken
• What happens when enterprises
use metrics, leading indicators,
analytics and risk alerts that are
industry inward-looking rather
than industry-agnostic market
focused?
12/7/2016 2WWW.SIMMETHOD.BLOGSPOT.COM
SIMMETHOD Success Metrics And Risk Alerts
The Way We Measure Corporate Risk And
Performance Is Broken
Why do
Businesses fail
or fail to
perform?
Blockbuster
Borders
Circuit City
Mervyns
Wachovia
Washington
Mutual
Linen n’
Things
8/9/2016 3www.simmethod.blogspot.com
SIMMETHOD
Is Business Forecasting And Predictive Analytics
Failing Your C-Suite?
• “In an era of constant
macroeconomic and geopolitical
upheaval, creating a forecast
leveraging just the company’s
internal data is like predicting the
temperature outside one’s house
based on how warm it is inside”,
Rich Wagner, CEO Magazine.
8/9/2016
www.simmethod.blogspot.com
4
SIMMETHOD
Why The Experts Can Not Agree?
• The way we measure
and predict corporate
risk and performance is
disconnected from the
new levers of value
creation.
12/7/2016 www.SIMMETHOD.blogspot.com 5
SIMMETHOD
What Sank The Titanic?
And… Some Of Our Great Companies
• The industrial-era metrics
we use to measure risk and
performance can not
detect risk and identify
opportunities in the new
industry-agnostic digital
economy
8/9/2016 6
www.simmethod.blogspot.com
SIMMETHOD
Problem Definition
The CEO Lament:
• My analytics and
business
intelligence point
North but my
business points
South
12/7/2016 www.SIMMETHOD.blogspot.com 7
Why Do Businesses Succeed Or Fail?
SIMMETHOD Premise
SIMMETHOD
premise is simple:
Businesses succeed or fail
primarily due to internal
decision-making rather than
external circumstances
beyond management control.
12/7/2016 www.SIMMETHOD.blogspot.com 8
SIMMETHOD
Is Business Forecasting And Predictive Analytics
Failing Your C-Suite?
• Is this the traditional “risk-
view” of your C-Suite and
Board of Directors?
• Risk hidden from internal
and historical forecasting
and predictive analytics
data, based on accounting
systems, outdated metrics
and existing products
8/9/2016
www.simmethod.blogspot.com
9
SIMMETHOD
Is Business Forecasting And Predictive Analytics
Failing The C-Suite?
• Is this the traditional
“opportunity-view” of your C-
Suite and the Board of
Directors?
• Opportunities hidden from
internal and historical
forecasting and predictive
analytics data, based on
accounting systems, outdated
metrics and existing products
8/9/2016
www.simmethod.blogspot.com
10
SIMMETHOD
Unique Value Proposition
SIMMETHOD
UNIQUE VALUE
PROPOSITIONS
Missing link between
predictive analytics,
business intelligence
and the C-suite
Missing link
between analytics,
business intelligence
and performance
Industrial era metrics
and KPIS disconnected
from the new levers of
value creation
Silo-Metrics unable to
holistically measure
and predict strategy
and execution
Lack of C-level early
warning risk alerts
linked to a crowd-
sourced success
metrics database
12/7/2016 www.SIMMETHOD.blogspot.com 11
SIMMETHOD Unique Value Proposition
Early Warning Detection Of Risks And Opportunities
0
1
2
3
4
5
6
7
8
Period 1 Period 2 Period 3 Period 4
You
New disrupting
business
Market Best In
Class
8/9/2016
www.simmethod.blogspot.com
12
SIMMETHOD leverages
the forecasting wisdom
and predictive analytics
of the market Best-In-
Class and identifies
where most value is
being created
SIMMETHOD risk alerts (hidden
gap to the B-I-C and new
disrupting competitors)
SIMMETHOD
Creation and update of the risk and performance
database with a curated group of companies
Apply 7 Laws of
growth & value
creation
Apply
SIMMETHOD
algorithms
Calculate
performance
predictive
indices
Calculate Best
In Class profiles
Apply
correlations to
industry agnostic
indices
Financial
data
Operational
data
HR data
Crowd sourced
business data
Social media
presentations
Updated historical risk &
performance database
Industry and
business risk alerts
SIMMETHOD
Creation and update of the risk and performance
database with a curated group of companies
Why SIMMETHOD uses a curated
global industry agnostic database
and crowd-sourced data to build
its predictive index?
• “Data rarely come prepackaged in
a form that is useful for making
predictions about the outcomes
you care about”. Prof. Vasant Dhar,
Stern School of Business
8/9/2016
www.simmethod.blogspot.com
14
SIMMETHOD
Benchmarking Your Risk And Performance And
Setting Up Your Risk Alerts Against The Best In Class
Apply 7 Laws of
growth & value
creation
Apply
SIMMETHOD
algorithms
Calculate
your
predictive
indices
Calculate your
gap to the Best
In Class
Apply predictive
correlations to your
performance indices
Your financial
data
Your
operational
data
Your HR
data
Set up your risk alerts
targets against the
Best In Class database
Visualization
interface
Updated historical risk &
performance database
Risk alerts: gap to BIC &
peers, predictive trends
Calculate
your risk
alerts
The 4 Phases Of The SIMMETHOD
Value Creation Process
• Your gap to
the B-I-C &
risk profiles
• Your C-level risk
& opportunity
alerts
• Your index
determines
your position
in the B-I-C
league table
• Crowd sourced
holistic,
context,
industry
agnostic
metrics
7 Laws
convert
your data
into index
7 Laws
calculate
league
table
7 Laws
calculate
B-I-C & risk
profiles
7 Laws C-
level risk
alerts
12/7/2016 16
www.simmethod.blogspot.com
SIMMETHOD’s C-Level Trends 2015-2016
Twitter, Yahoo and the Best-In-Class
• When the Best-In-Class and your
SIMMETHOD C-Level indices are
moving in opposite directions, your
ability to compete weakens in
proportion to your widening
gap to the Best-In-Class.
8/9/2016 www.simmethod.blogspot.com 17
SIMMETHOD’s C-Level Trends 2015-2016
Twitter and the Best-In-Class
8/9/2016
www.simmethod.blogspot.com
18
-15
-10
-5
0
5
10
15
20
Twitter 2015
Twitter 2016
Twitter has many positive trends: the Sales
Index, the Management Effectiveness Index
and the Risk Index. The Business Model
Index continues to be a source of trouble
SIMMETHOD
Twitter and the Best-In-Class
8/9/2016
www.simmethod.blogspot.com
19
0
5
10
15
20
25
30
35
2015 2016
Average B-I-C
SIMMETHOD Strategy/
Execution Performance
Predictive Index
Twitter SIMMETHOD
Strategy/ Execution
Performance Predictive
index
Improved Strategy & Execution
Performance Predictive Index vs. the Best
In Class as predictor of future performance
SIMMETHOD
Twitter and the Best-In-Class
8/9/2016
www.simmethod.blogspot.com
20
0
2
4
6
8
10
12
14
16
2015 2016
Avg. B-I-C SIMMETHOD
Management
Controllable Resources
Index
Twitter SIMMETHOD
Management
Controllable Resources
Index
Improved Management Effectiveness
Index correlates to future improvements
in the Value Creation Index
SIMMETHOD
Twitter and the Best-In-Class
8/9/2016
www.simmethod.blogspot.com
21
0
2
4
6
8
10
12
14
16
18
2015 2016
Avg. B-I-C
SIMMETHOD Value
Creation Index
Twitter SIMMETHOD
Value Creation Index
Although the Value Creation Index is on a
negative trend, it is positive and the
strong Management Effectiveness Index
predicts further improvements
SIMMETHOD
Twitter and the Best-In-Class
8/9/2016
www.simmethod.blogspot.com
22
0
2
4
6
8
10
12
2015 2016
Avg. B-I-C
SIMMETHOD
Cash/Debt Index
Twitter
SIMMETHOD Cash/
Debt Index
Although the Cash/Debt
Index has decreased, it is
still at Best In Class levels
SIMMETHOD’s
Twitter and the Best-In-Class
8/9/2016
www.simmethod.blogspot.com
23
-4
-3
-2
-1
0
1
2
3
2015 2016
Avg. B-I-C
SIMMETHOD
Sales Index
Twitter
SIMMETHOD
Sales Index
Twitter’s Sales Index has
improved to Best in Class
levels showing the many
hidden opportunities
available to the business
SIMMETHOD
Twitter and the Best-In-Class
8/9/2016
www.simmethod.blogspot.com
24
-4
-3
-2
-1
0
1
2
3
4
5
6
7
2015 2016
Avg. B-I-C
SIMMETHOD
Risk Index
Twitter
SIMMETHOD
Risk Index
Twitter has improved its Risk Index
to positive levels as a sign of
business strength and added value
to its value chain
SIMMETHOD
Twitter and the Best-In-Class
8/9/2016
www.simmethod.blogspot.com
25
-10
-8
-6
-4
-2
0
2
4
2015 2016
Avg. B-I-C
Overheads Index
Twitter
SIMMETHOD
Overheads Index
The Overheads Index has
improved to positive levels
versus the Best In Class
SIMMETHOD
Twitter and the Best-In-Class
8/9/2016
www.simmethod.blogspot.com
26
0
0.5
1
1.5
2
2.5
3
3.5
2015 2016
Avg. B-I-C
SIMMETHOD
HR Index
Twitter
SIMMETHOD
HR Index
The sharp drop in the HR Index
shows one of the icebergs in the
Twitter sea (HR’s ability to add
value to the business is
diminishing)
SIMMETHOD’s C-Level Trends 2015-2016
Yahoo and the Best-In-Class
8/9/2016
www.simmethod.blogspot.com
27
-10
-5
0
5
10
15
20
25
30
35
40
45
Yahoo
2015
Yahoo
2016
Except the Sales, Assets and Cash/Debt Index,
Yahoo’s indices are on a negative trend
showing an increased level of business risk and
a sharp deterioration in the Business Model
Minimum Company Index
SIMMETHOD
Yahoo and the Best-In-Class
8/9/2016
www.simmethod.blogspot.com
28
0
5
10
15
20
25
30
35
40
45
2015 2016
Average B-I-C
SIMMETHOD Strategy/
Execution Performance
Predictive Index
Yahoo SIMMETHOD
Strategy/ Execution
Performance Predictive
index
Although still positive, Yahoo’s
Strategy & Execution
Performance Predictive Index is
on a negative trend
SIMMETHOD
Yahoo and the Best-In-Class
8/9/2016
www.simmethod.blogspot.com
29
0
2
4
6
8
10
12
14
16
18
20
2015 2016
Avg. B-I-C
SIMMETHOD
Management
Controllable
Resources Index
Yahoo SIMMETHOD
Management
Controllable
Resources Index
Best In Class Management Effectiveness Index
correlates to future strong business value creation
SIMMETHOD
Yahoo and the Best-In-Class
8/9/2016
www.simmethod.blogspot.com
30
0
5
10
15
20
25
2015 2016
Avg. B-I-C
SIMMETHOD
Value Creation
Index
Yahoo
SIMMETHOD
Value Creation
Index
Although the Value Creation Index
is trending negative, the Best In
Class Management Effectiveness
Index correlates to a positive
Business Value Creation Index
SIMMETHOD
Yahoo and the Best-In-Class
8/9/2016
www.simmethod.blogspot.com
31
0
2
4
6
8
10
12
14
2015 2016
Avg. B-I-C
SIMMETHOD
Cash/Debt Index
Yahoo
SIMMETHOD
Cash/ Debt Index
SIMMETHOD Cash/Debt Index above Best In Class average
SIMMETHOD
Yahoo and the Best-In-Class
8/9/2016
www.simmethod.blogspot.com
32
-1.5
-1
-0.5
0
0.5
1
1.5
2
2.5
2015 2016
Avg. B-I-C
SIMMETHOD
Sales Index
Yahoo
SIMMETHOD
Sales Index
The Sales Index has changed from
negative to positive strengthening
Yahoo’s competitive advantage
SIMMETHOD
Yahoo and the Best-In-Class
8/9/2016
www.simmethod.blogspot.com
33
0
1
2
3
4
5
6
7
2015 2016
Avg. B-I-C
SIMMETHOD Risk
Index
Yahoo
SIMMETHOD Risk
Index
Although still positive, Yahoo’s level of
risk has increased versus the
SIMMETHOD Best In Class
SIMMETHOD
Yahoo and the Best-In-Class
8/9/2016
www.simmethod.blogspot.com
34
0
0.5
1
1.5
2
2.5
2015 2016
Avg. B-I-C
Overheads
Index
Yahoo
SIMMETHOD
Overheads
Index
Yahoo’s Overheads Index trending negative is one more
iceberg on Yahoo’s sea
SIMMETHOD
Yahoo and the Best-In-Class
8/9/2016
www.simmethod.blogspot.com
35
0
1
2
3
4
5
6
7
8
2015 2016
Avg. B-I-C
SIMMETHOD
HR Index
Yahoo
SIMMETHOD
HR Index
Although it is on a negative
trend, Yahoo’s HR Index is
above the SIMMETHOD Best
in Class average, showing a
strong contribution to
business value creation
SIMMETHOD
Why Your SIMMETHOD Risk Index Is So Important
To You, Your Prospects And Your Customers?
• As a cloud vendor, your
business risk is embedded
in your products and
services and is likely to be
transferred to your
customers and value chain
8/9/2016
www.simmethod.blogspot.com
36
SIMMETHOD
Linking Your Sales To Business Value Creation
• When the link between
your sales, your risk and
your value creation is
broken and your gap to
the SIMMETHOD Best In
Class is widening your
competitors will
determine your future
8/9/2016
www.simmethod.blogspot.com
37
SIMMETHOD
Competitive Intelligence Risk Alerts
8/9/2016
www.simmethod.blogspot.com
38
-10
-5
0
5
10
15
20
25
Yahoo 2015 Yahoo 2016 Twitter 2015 Twitter 2016
SIMMETHOD Profit
Index
SIMMETHOD Cash
Debt Index
SIMMETHOD Value
Creation Index
Some of the 2015-2016 trends
SIMMETHOD
Competitive Intelligence Risk Alerts
8/9/2016
www.simmethod.blogspot.com
39
-10
-5
0
5
10
15
20
25
30
35
40
45
Yahoo 2015 Yahoo 2016 Twitter 2015 Twitter 2016
SIMMETHOD Strategy
Execution
Performance
Predictive Index Index
SIMMETHOD Risk
Index
While Yahoo is on a negative risk and
performance trend, Twitter is in a
positive risk and performance trend
SIMMETHOD Unique Value Proposition
Early Warning Detection Of Risks And Opportunities
8/9/2016
www.simmethod.blogspot.com
40
SIMMETHOD leverages the forecasting wisdom
and predictive analytics of the market B-I-C and
identifies where the most value is being created
7 laws of
growth
& value
creation
Gap to
market
Best In
Class
Success &
Risk
Predictive
algorithms
The SIMMETHOD Algorithms Are Based On The
7 Laws Of Predictive Growth And Value Creation
SIMMETHOD
7 Laws
Integration
/alignment Crowd analytics
inside/outside
your industry
Growth &
value
creation
Resource
contribution
to objectives
C-level
Predictive
performance &
risk
Averages &
positive
trends
Minimum
company
/business
model
8/9/2016 www.simmethod.blogspot.com 41
Twitter And The SIMMETHOD 7 Laws Of
Predictive Growth And Value Creation
Index Index Value And
At BIC levels?
Index Trend Index Trend Vs.
BIC
7 Laws
Compliance
Sales Pos, Yes Pos Pos Yes
HR Pos, No Neg Neg No
Management
Controllable
Resources
Pos, Yes Pos Pos Yes
Value Creation Pos, No Neg Neg No
Business Model Neg, No Pos Neg No
Strategy &
Execution
Performance
Predictive
Pos, Yes Neg Pos Yes
Risk Pos, No Pos Pos Yes
8/9/2016
www.simmethod.blogspot.com
42
Yahoo And The SIMMETHOD 7 Laws Of
Predictive Growth And Value Creation
Index Index Value And
At BIC Levels?
Index Trend Index Trend Vs.
BIC
7 Laws
Compliance
Sales Pos, No Pos Pos Yes
HR Pos, Yes Neg Pos Yes
Management
Controllable
Resources
Pos, Yes Neg Pos Yes
Value Creation Pos, No Neg Neg No
Business Model Neg, No Neg Neg No
Strategy &
Execution
Performance
Predictive
Pos, No Neg Neg No
Risk Pos, No Neg Neg No
8/9/2016
www.simmethod.blogspot.com
43
The SIMMETHOD Algorithms And The
7 Laws Of Growth And Value Creation
• Non-compliance with SIMMETHOD’s 7
Laws Of Growth And Value Creation
shows your areas of vulnerability and
risk and when applied to your
customers, it shows your opportunity to
enhance their business
value because:
12/7/2016
WWW.SIMMETHOD.BLOGSPOT.COM
44
The SIMMETHOD Algorithms And The
7 Laws Of Growth And Value Creation
• “The real measure of your
products and services is the
value they add to your
customers”, SIMMETHOD
12/7/2016
WWW.SIMMETHOD.BLOGSPOT.COM
45
SIMMETHOD Unique Value Proposition
Saving “The Titanic” One Company At The Time
8/9/2016
www.simmethod.blogspot.com
46
From company business intelligence
to predictive value chain business
intelligence:
• SIMMETHOD provides predictive
competitive intelligence linking
the value chain via a common set
of metrics enabling partners
(suppliers, customers) to align
their strategies and synchronize
their business models, processes
and execution.
SIMMETHOD Unique Value Proposition
Saving “The Titanic” One Company At The Time
8/9/2016
www.simmethod.blogspot.com
47
From internally-focused and historically
based risk and performance
forecasting to leveraging the
forecasting and analytics wisdom of
the market Best In Class:
• SIMMETHOD risk and performance
management global database is based
on competitive intelligence measuring
of external market forces that will
have major risk and opportunities
implications for you and your
business
SIMMETHOD Unique Value Proposition
Saving “The Titanic” One Company At The Time
8/9/2016
www.simmethod.blogspot.com
48
From internally-focused and historically
based risk and performance
forecasting and analytics to integrated
C-level competitive intelligence
predictive analytics:
• SIMMETHOD enables Directors and
Executives to receive early warning
performance and risk alerts linked to
global market trends, market Best In
Class and predictive correlations
based on the 7 Laws Of Growth And
Value Creation
SIMMETHOD’s Disclaimer
• The purpose of the SIMMETHOD Strategy &
Execution Performance Predictive Index and
risk and opportunities alerts is not to make a
business right or wrong but rather contribute
towards the understanding of management
actions in comparison to industry’s peers and
the SIMMETHOD Best In Class.
8/9/2016 www.simmethod.blogspot.com 49
SIMMETHOD’s Disclaimer
• SIMMETHOD’s Global Strategy & Execution
Performance Predictive Index and risk and
opportunities alerts do not seek to be exact
but rather serve as a conduit to ask better
questions and seek better answers in the
performance improvement, risk minimization
and value creation journey.
8/9/2016 www.simmethod.blogspot.com 50
SIMMETHOD’s Disclaimer
• Sometimes, the value of a metric in itself
does not provide the greatest of insights, but
valuable actionable knowledge is gained
from its ability to provide a trend or a
common comparison yardstick with other
businesses across a range of
industries.
8/9/2016 www.simmethod.blogspot.com 51
SIMMETHOD’s Disclaimer
• This Presentation is for informational
purpose only and SIMMETHOD shall not be
liable for the contents of the Presentation or
for any damage incurred or alleged to be
incurred to any of the businesses included in
the Presentation as a result of its content.
8/9/2016 www.simmethod.blogspot.com 52
SIMMETHOD
Makes Your Risk And Performance More Predictable
SIMMETHOD makes your risk and performance
more predictable by aligning your strategy
and execution to the:
• Market forces where the most value is being
created and
• Success metrics of your customers in order to
directly contribute to their results
8/9/2016 www.simmethod.blogspot.com 53
SIMMETHOD
8/9/2016
www.simmethod.blogspot.com
54
Jorge Oscar Tabacman
jtabacman@gmail.com
Twitter ID: SIMMETHOD
SIMMETHOD
Success Metrics And Risk Alerts
The Way You Measure Determines
Your Results
8/9/2016 55www.simmethod.blogspot.com

Simmethod From Software As A Service To Outcomes As A Service, Twitter and Yahoo 2017 And Beyond

  • 1.
    SIMMETHOD From Software AsA service To Outcomes As A Service Towards A Single Index To Measure And Predict The Outcomes Of Your Strategy And Execution Twitter And Yahoo 2017 And Beyond 8/9/2016 1 www.simmethod.blogspot.com
  • 2.
    The Way WeMeasure Corporate Risk And Performance is Broken • What happens when enterprises use metrics, leading indicators, analytics and risk alerts that are industry inward-looking rather than industry-agnostic market focused? 12/7/2016 2WWW.SIMMETHOD.BLOGSPOT.COM
  • 3.
    SIMMETHOD Success MetricsAnd Risk Alerts The Way We Measure Corporate Risk And Performance Is Broken Why do Businesses fail or fail to perform? Blockbuster Borders Circuit City Mervyns Wachovia Washington Mutual Linen n’ Things 8/9/2016 3www.simmethod.blogspot.com
  • 4.
    SIMMETHOD Is Business ForecastingAnd Predictive Analytics Failing Your C-Suite? • “In an era of constant macroeconomic and geopolitical upheaval, creating a forecast leveraging just the company’s internal data is like predicting the temperature outside one’s house based on how warm it is inside”, Rich Wagner, CEO Magazine. 8/9/2016 www.simmethod.blogspot.com 4
  • 5.
    SIMMETHOD Why The ExpertsCan Not Agree? • The way we measure and predict corporate risk and performance is disconnected from the new levers of value creation. 12/7/2016 www.SIMMETHOD.blogspot.com 5
  • 6.
    SIMMETHOD What Sank TheTitanic? And… Some Of Our Great Companies • The industrial-era metrics we use to measure risk and performance can not detect risk and identify opportunities in the new industry-agnostic digital economy 8/9/2016 6 www.simmethod.blogspot.com
  • 7.
    SIMMETHOD Problem Definition The CEOLament: • My analytics and business intelligence point North but my business points South 12/7/2016 www.SIMMETHOD.blogspot.com 7
  • 8.
    Why Do BusinessesSucceed Or Fail? SIMMETHOD Premise SIMMETHOD premise is simple: Businesses succeed or fail primarily due to internal decision-making rather than external circumstances beyond management control. 12/7/2016 www.SIMMETHOD.blogspot.com 8
  • 9.
    SIMMETHOD Is Business ForecastingAnd Predictive Analytics Failing Your C-Suite? • Is this the traditional “risk- view” of your C-Suite and Board of Directors? • Risk hidden from internal and historical forecasting and predictive analytics data, based on accounting systems, outdated metrics and existing products 8/9/2016 www.simmethod.blogspot.com 9
  • 10.
    SIMMETHOD Is Business ForecastingAnd Predictive Analytics Failing The C-Suite? • Is this the traditional “opportunity-view” of your C- Suite and the Board of Directors? • Opportunities hidden from internal and historical forecasting and predictive analytics data, based on accounting systems, outdated metrics and existing products 8/9/2016 www.simmethod.blogspot.com 10
  • 11.
    SIMMETHOD Unique Value Proposition SIMMETHOD UNIQUEVALUE PROPOSITIONS Missing link between predictive analytics, business intelligence and the C-suite Missing link between analytics, business intelligence and performance Industrial era metrics and KPIS disconnected from the new levers of value creation Silo-Metrics unable to holistically measure and predict strategy and execution Lack of C-level early warning risk alerts linked to a crowd- sourced success metrics database 12/7/2016 www.SIMMETHOD.blogspot.com 11
  • 12.
    SIMMETHOD Unique ValueProposition Early Warning Detection Of Risks And Opportunities 0 1 2 3 4 5 6 7 8 Period 1 Period 2 Period 3 Period 4 You New disrupting business Market Best In Class 8/9/2016 www.simmethod.blogspot.com 12 SIMMETHOD leverages the forecasting wisdom and predictive analytics of the market Best-In- Class and identifies where most value is being created SIMMETHOD risk alerts (hidden gap to the B-I-C and new disrupting competitors)
  • 13.
    SIMMETHOD Creation and updateof the risk and performance database with a curated group of companies Apply 7 Laws of growth & value creation Apply SIMMETHOD algorithms Calculate performance predictive indices Calculate Best In Class profiles Apply correlations to industry agnostic indices Financial data Operational data HR data Crowd sourced business data Social media presentations Updated historical risk & performance database Industry and business risk alerts
  • 14.
    SIMMETHOD Creation and updateof the risk and performance database with a curated group of companies Why SIMMETHOD uses a curated global industry agnostic database and crowd-sourced data to build its predictive index? • “Data rarely come prepackaged in a form that is useful for making predictions about the outcomes you care about”. Prof. Vasant Dhar, Stern School of Business 8/9/2016 www.simmethod.blogspot.com 14
  • 15.
    SIMMETHOD Benchmarking Your RiskAnd Performance And Setting Up Your Risk Alerts Against The Best In Class Apply 7 Laws of growth & value creation Apply SIMMETHOD algorithms Calculate your predictive indices Calculate your gap to the Best In Class Apply predictive correlations to your performance indices Your financial data Your operational data Your HR data Set up your risk alerts targets against the Best In Class database Visualization interface Updated historical risk & performance database Risk alerts: gap to BIC & peers, predictive trends Calculate your risk alerts
  • 16.
    The 4 PhasesOf The SIMMETHOD Value Creation Process • Your gap to the B-I-C & risk profiles • Your C-level risk & opportunity alerts • Your index determines your position in the B-I-C league table • Crowd sourced holistic, context, industry agnostic metrics 7 Laws convert your data into index 7 Laws calculate league table 7 Laws calculate B-I-C & risk profiles 7 Laws C- level risk alerts 12/7/2016 16 www.simmethod.blogspot.com
  • 17.
    SIMMETHOD’s C-Level Trends2015-2016 Twitter, Yahoo and the Best-In-Class • When the Best-In-Class and your SIMMETHOD C-Level indices are moving in opposite directions, your ability to compete weakens in proportion to your widening gap to the Best-In-Class. 8/9/2016 www.simmethod.blogspot.com 17
  • 18.
    SIMMETHOD’s C-Level Trends2015-2016 Twitter and the Best-In-Class 8/9/2016 www.simmethod.blogspot.com 18 -15 -10 -5 0 5 10 15 20 Twitter 2015 Twitter 2016 Twitter has many positive trends: the Sales Index, the Management Effectiveness Index and the Risk Index. The Business Model Index continues to be a source of trouble
  • 19.
    SIMMETHOD Twitter and theBest-In-Class 8/9/2016 www.simmethod.blogspot.com 19 0 5 10 15 20 25 30 35 2015 2016 Average B-I-C SIMMETHOD Strategy/ Execution Performance Predictive Index Twitter SIMMETHOD Strategy/ Execution Performance Predictive index Improved Strategy & Execution Performance Predictive Index vs. the Best In Class as predictor of future performance
  • 20.
    SIMMETHOD Twitter and theBest-In-Class 8/9/2016 www.simmethod.blogspot.com 20 0 2 4 6 8 10 12 14 16 2015 2016 Avg. B-I-C SIMMETHOD Management Controllable Resources Index Twitter SIMMETHOD Management Controllable Resources Index Improved Management Effectiveness Index correlates to future improvements in the Value Creation Index
  • 21.
    SIMMETHOD Twitter and theBest-In-Class 8/9/2016 www.simmethod.blogspot.com 21 0 2 4 6 8 10 12 14 16 18 2015 2016 Avg. B-I-C SIMMETHOD Value Creation Index Twitter SIMMETHOD Value Creation Index Although the Value Creation Index is on a negative trend, it is positive and the strong Management Effectiveness Index predicts further improvements
  • 22.
    SIMMETHOD Twitter and theBest-In-Class 8/9/2016 www.simmethod.blogspot.com 22 0 2 4 6 8 10 12 2015 2016 Avg. B-I-C SIMMETHOD Cash/Debt Index Twitter SIMMETHOD Cash/ Debt Index Although the Cash/Debt Index has decreased, it is still at Best In Class levels
  • 23.
    SIMMETHOD’s Twitter and theBest-In-Class 8/9/2016 www.simmethod.blogspot.com 23 -4 -3 -2 -1 0 1 2 3 2015 2016 Avg. B-I-C SIMMETHOD Sales Index Twitter SIMMETHOD Sales Index Twitter’s Sales Index has improved to Best in Class levels showing the many hidden opportunities available to the business
  • 24.
    SIMMETHOD Twitter and theBest-In-Class 8/9/2016 www.simmethod.blogspot.com 24 -4 -3 -2 -1 0 1 2 3 4 5 6 7 2015 2016 Avg. B-I-C SIMMETHOD Risk Index Twitter SIMMETHOD Risk Index Twitter has improved its Risk Index to positive levels as a sign of business strength and added value to its value chain
  • 25.
    SIMMETHOD Twitter and theBest-In-Class 8/9/2016 www.simmethod.blogspot.com 25 -10 -8 -6 -4 -2 0 2 4 2015 2016 Avg. B-I-C Overheads Index Twitter SIMMETHOD Overheads Index The Overheads Index has improved to positive levels versus the Best In Class
  • 26.
    SIMMETHOD Twitter and theBest-In-Class 8/9/2016 www.simmethod.blogspot.com 26 0 0.5 1 1.5 2 2.5 3 3.5 2015 2016 Avg. B-I-C SIMMETHOD HR Index Twitter SIMMETHOD HR Index The sharp drop in the HR Index shows one of the icebergs in the Twitter sea (HR’s ability to add value to the business is diminishing)
  • 27.
    SIMMETHOD’s C-Level Trends2015-2016 Yahoo and the Best-In-Class 8/9/2016 www.simmethod.blogspot.com 27 -10 -5 0 5 10 15 20 25 30 35 40 45 Yahoo 2015 Yahoo 2016 Except the Sales, Assets and Cash/Debt Index, Yahoo’s indices are on a negative trend showing an increased level of business risk and a sharp deterioration in the Business Model Minimum Company Index
  • 28.
    SIMMETHOD Yahoo and theBest-In-Class 8/9/2016 www.simmethod.blogspot.com 28 0 5 10 15 20 25 30 35 40 45 2015 2016 Average B-I-C SIMMETHOD Strategy/ Execution Performance Predictive Index Yahoo SIMMETHOD Strategy/ Execution Performance Predictive index Although still positive, Yahoo’s Strategy & Execution Performance Predictive Index is on a negative trend
  • 29.
    SIMMETHOD Yahoo and theBest-In-Class 8/9/2016 www.simmethod.blogspot.com 29 0 2 4 6 8 10 12 14 16 18 20 2015 2016 Avg. B-I-C SIMMETHOD Management Controllable Resources Index Yahoo SIMMETHOD Management Controllable Resources Index Best In Class Management Effectiveness Index correlates to future strong business value creation
  • 30.
    SIMMETHOD Yahoo and theBest-In-Class 8/9/2016 www.simmethod.blogspot.com 30 0 5 10 15 20 25 2015 2016 Avg. B-I-C SIMMETHOD Value Creation Index Yahoo SIMMETHOD Value Creation Index Although the Value Creation Index is trending negative, the Best In Class Management Effectiveness Index correlates to a positive Business Value Creation Index
  • 31.
    SIMMETHOD Yahoo and theBest-In-Class 8/9/2016 www.simmethod.blogspot.com 31 0 2 4 6 8 10 12 14 2015 2016 Avg. B-I-C SIMMETHOD Cash/Debt Index Yahoo SIMMETHOD Cash/ Debt Index SIMMETHOD Cash/Debt Index above Best In Class average
  • 32.
    SIMMETHOD Yahoo and theBest-In-Class 8/9/2016 www.simmethod.blogspot.com 32 -1.5 -1 -0.5 0 0.5 1 1.5 2 2.5 2015 2016 Avg. B-I-C SIMMETHOD Sales Index Yahoo SIMMETHOD Sales Index The Sales Index has changed from negative to positive strengthening Yahoo’s competitive advantage
  • 33.
    SIMMETHOD Yahoo and theBest-In-Class 8/9/2016 www.simmethod.blogspot.com 33 0 1 2 3 4 5 6 7 2015 2016 Avg. B-I-C SIMMETHOD Risk Index Yahoo SIMMETHOD Risk Index Although still positive, Yahoo’s level of risk has increased versus the SIMMETHOD Best In Class
  • 34.
    SIMMETHOD Yahoo and theBest-In-Class 8/9/2016 www.simmethod.blogspot.com 34 0 0.5 1 1.5 2 2.5 2015 2016 Avg. B-I-C Overheads Index Yahoo SIMMETHOD Overheads Index Yahoo’s Overheads Index trending negative is one more iceberg on Yahoo’s sea
  • 35.
    SIMMETHOD Yahoo and theBest-In-Class 8/9/2016 www.simmethod.blogspot.com 35 0 1 2 3 4 5 6 7 8 2015 2016 Avg. B-I-C SIMMETHOD HR Index Yahoo SIMMETHOD HR Index Although it is on a negative trend, Yahoo’s HR Index is above the SIMMETHOD Best in Class average, showing a strong contribution to business value creation
  • 36.
    SIMMETHOD Why Your SIMMETHODRisk Index Is So Important To You, Your Prospects And Your Customers? • As a cloud vendor, your business risk is embedded in your products and services and is likely to be transferred to your customers and value chain 8/9/2016 www.simmethod.blogspot.com 36
  • 37.
    SIMMETHOD Linking Your SalesTo Business Value Creation • When the link between your sales, your risk and your value creation is broken and your gap to the SIMMETHOD Best In Class is widening your competitors will determine your future 8/9/2016 www.simmethod.blogspot.com 37
  • 38.
    SIMMETHOD Competitive Intelligence RiskAlerts 8/9/2016 www.simmethod.blogspot.com 38 -10 -5 0 5 10 15 20 25 Yahoo 2015 Yahoo 2016 Twitter 2015 Twitter 2016 SIMMETHOD Profit Index SIMMETHOD Cash Debt Index SIMMETHOD Value Creation Index Some of the 2015-2016 trends
  • 39.
    SIMMETHOD Competitive Intelligence RiskAlerts 8/9/2016 www.simmethod.blogspot.com 39 -10 -5 0 5 10 15 20 25 30 35 40 45 Yahoo 2015 Yahoo 2016 Twitter 2015 Twitter 2016 SIMMETHOD Strategy Execution Performance Predictive Index Index SIMMETHOD Risk Index While Yahoo is on a negative risk and performance trend, Twitter is in a positive risk and performance trend
  • 40.
    SIMMETHOD Unique ValueProposition Early Warning Detection Of Risks And Opportunities 8/9/2016 www.simmethod.blogspot.com 40 SIMMETHOD leverages the forecasting wisdom and predictive analytics of the market B-I-C and identifies where the most value is being created 7 laws of growth & value creation Gap to market Best In Class Success & Risk Predictive algorithms
  • 41.
    The SIMMETHOD AlgorithmsAre Based On The 7 Laws Of Predictive Growth And Value Creation SIMMETHOD 7 Laws Integration /alignment Crowd analytics inside/outside your industry Growth & value creation Resource contribution to objectives C-level Predictive performance & risk Averages & positive trends Minimum company /business model 8/9/2016 www.simmethod.blogspot.com 41
  • 42.
    Twitter And TheSIMMETHOD 7 Laws Of Predictive Growth And Value Creation Index Index Value And At BIC levels? Index Trend Index Trend Vs. BIC 7 Laws Compliance Sales Pos, Yes Pos Pos Yes HR Pos, No Neg Neg No Management Controllable Resources Pos, Yes Pos Pos Yes Value Creation Pos, No Neg Neg No Business Model Neg, No Pos Neg No Strategy & Execution Performance Predictive Pos, Yes Neg Pos Yes Risk Pos, No Pos Pos Yes 8/9/2016 www.simmethod.blogspot.com 42
  • 43.
    Yahoo And TheSIMMETHOD 7 Laws Of Predictive Growth And Value Creation Index Index Value And At BIC Levels? Index Trend Index Trend Vs. BIC 7 Laws Compliance Sales Pos, No Pos Pos Yes HR Pos, Yes Neg Pos Yes Management Controllable Resources Pos, Yes Neg Pos Yes Value Creation Pos, No Neg Neg No Business Model Neg, No Neg Neg No Strategy & Execution Performance Predictive Pos, No Neg Neg No Risk Pos, No Neg Neg No 8/9/2016 www.simmethod.blogspot.com 43
  • 44.
    The SIMMETHOD AlgorithmsAnd The 7 Laws Of Growth And Value Creation • Non-compliance with SIMMETHOD’s 7 Laws Of Growth And Value Creation shows your areas of vulnerability and risk and when applied to your customers, it shows your opportunity to enhance their business value because: 12/7/2016 WWW.SIMMETHOD.BLOGSPOT.COM 44
  • 45.
    The SIMMETHOD AlgorithmsAnd The 7 Laws Of Growth And Value Creation • “The real measure of your products and services is the value they add to your customers”, SIMMETHOD 12/7/2016 WWW.SIMMETHOD.BLOGSPOT.COM 45
  • 46.
    SIMMETHOD Unique ValueProposition Saving “The Titanic” One Company At The Time 8/9/2016 www.simmethod.blogspot.com 46 From company business intelligence to predictive value chain business intelligence: • SIMMETHOD provides predictive competitive intelligence linking the value chain via a common set of metrics enabling partners (suppliers, customers) to align their strategies and synchronize their business models, processes and execution.
  • 47.
    SIMMETHOD Unique ValueProposition Saving “The Titanic” One Company At The Time 8/9/2016 www.simmethod.blogspot.com 47 From internally-focused and historically based risk and performance forecasting to leveraging the forecasting and analytics wisdom of the market Best In Class: • SIMMETHOD risk and performance management global database is based on competitive intelligence measuring of external market forces that will have major risk and opportunities implications for you and your business
  • 48.
    SIMMETHOD Unique ValueProposition Saving “The Titanic” One Company At The Time 8/9/2016 www.simmethod.blogspot.com 48 From internally-focused and historically based risk and performance forecasting and analytics to integrated C-level competitive intelligence predictive analytics: • SIMMETHOD enables Directors and Executives to receive early warning performance and risk alerts linked to global market trends, market Best In Class and predictive correlations based on the 7 Laws Of Growth And Value Creation
  • 49.
    SIMMETHOD’s Disclaimer • Thepurpose of the SIMMETHOD Strategy & Execution Performance Predictive Index and risk and opportunities alerts is not to make a business right or wrong but rather contribute towards the understanding of management actions in comparison to industry’s peers and the SIMMETHOD Best In Class. 8/9/2016 www.simmethod.blogspot.com 49
  • 50.
    SIMMETHOD’s Disclaimer • SIMMETHOD’sGlobal Strategy & Execution Performance Predictive Index and risk and opportunities alerts do not seek to be exact but rather serve as a conduit to ask better questions and seek better answers in the performance improvement, risk minimization and value creation journey. 8/9/2016 www.simmethod.blogspot.com 50
  • 51.
    SIMMETHOD’s Disclaimer • Sometimes,the value of a metric in itself does not provide the greatest of insights, but valuable actionable knowledge is gained from its ability to provide a trend or a common comparison yardstick with other businesses across a range of industries. 8/9/2016 www.simmethod.blogspot.com 51
  • 52.
    SIMMETHOD’s Disclaimer • ThisPresentation is for informational purpose only and SIMMETHOD shall not be liable for the contents of the Presentation or for any damage incurred or alleged to be incurred to any of the businesses included in the Presentation as a result of its content. 8/9/2016 www.simmethod.blogspot.com 52
  • 53.
    SIMMETHOD Makes Your RiskAnd Performance More Predictable SIMMETHOD makes your risk and performance more predictable by aligning your strategy and execution to the: • Market forces where the most value is being created and • Success metrics of your customers in order to directly contribute to their results 8/9/2016 www.simmethod.blogspot.com 53
  • 54.
  • 55.
    Jorge Oscar Tabacman jtabacman@gmail.com TwitterID: SIMMETHOD SIMMETHOD Success Metrics And Risk Alerts The Way You Measure Determines Your Results 8/9/2016 55www.simmethod.blogspot.com