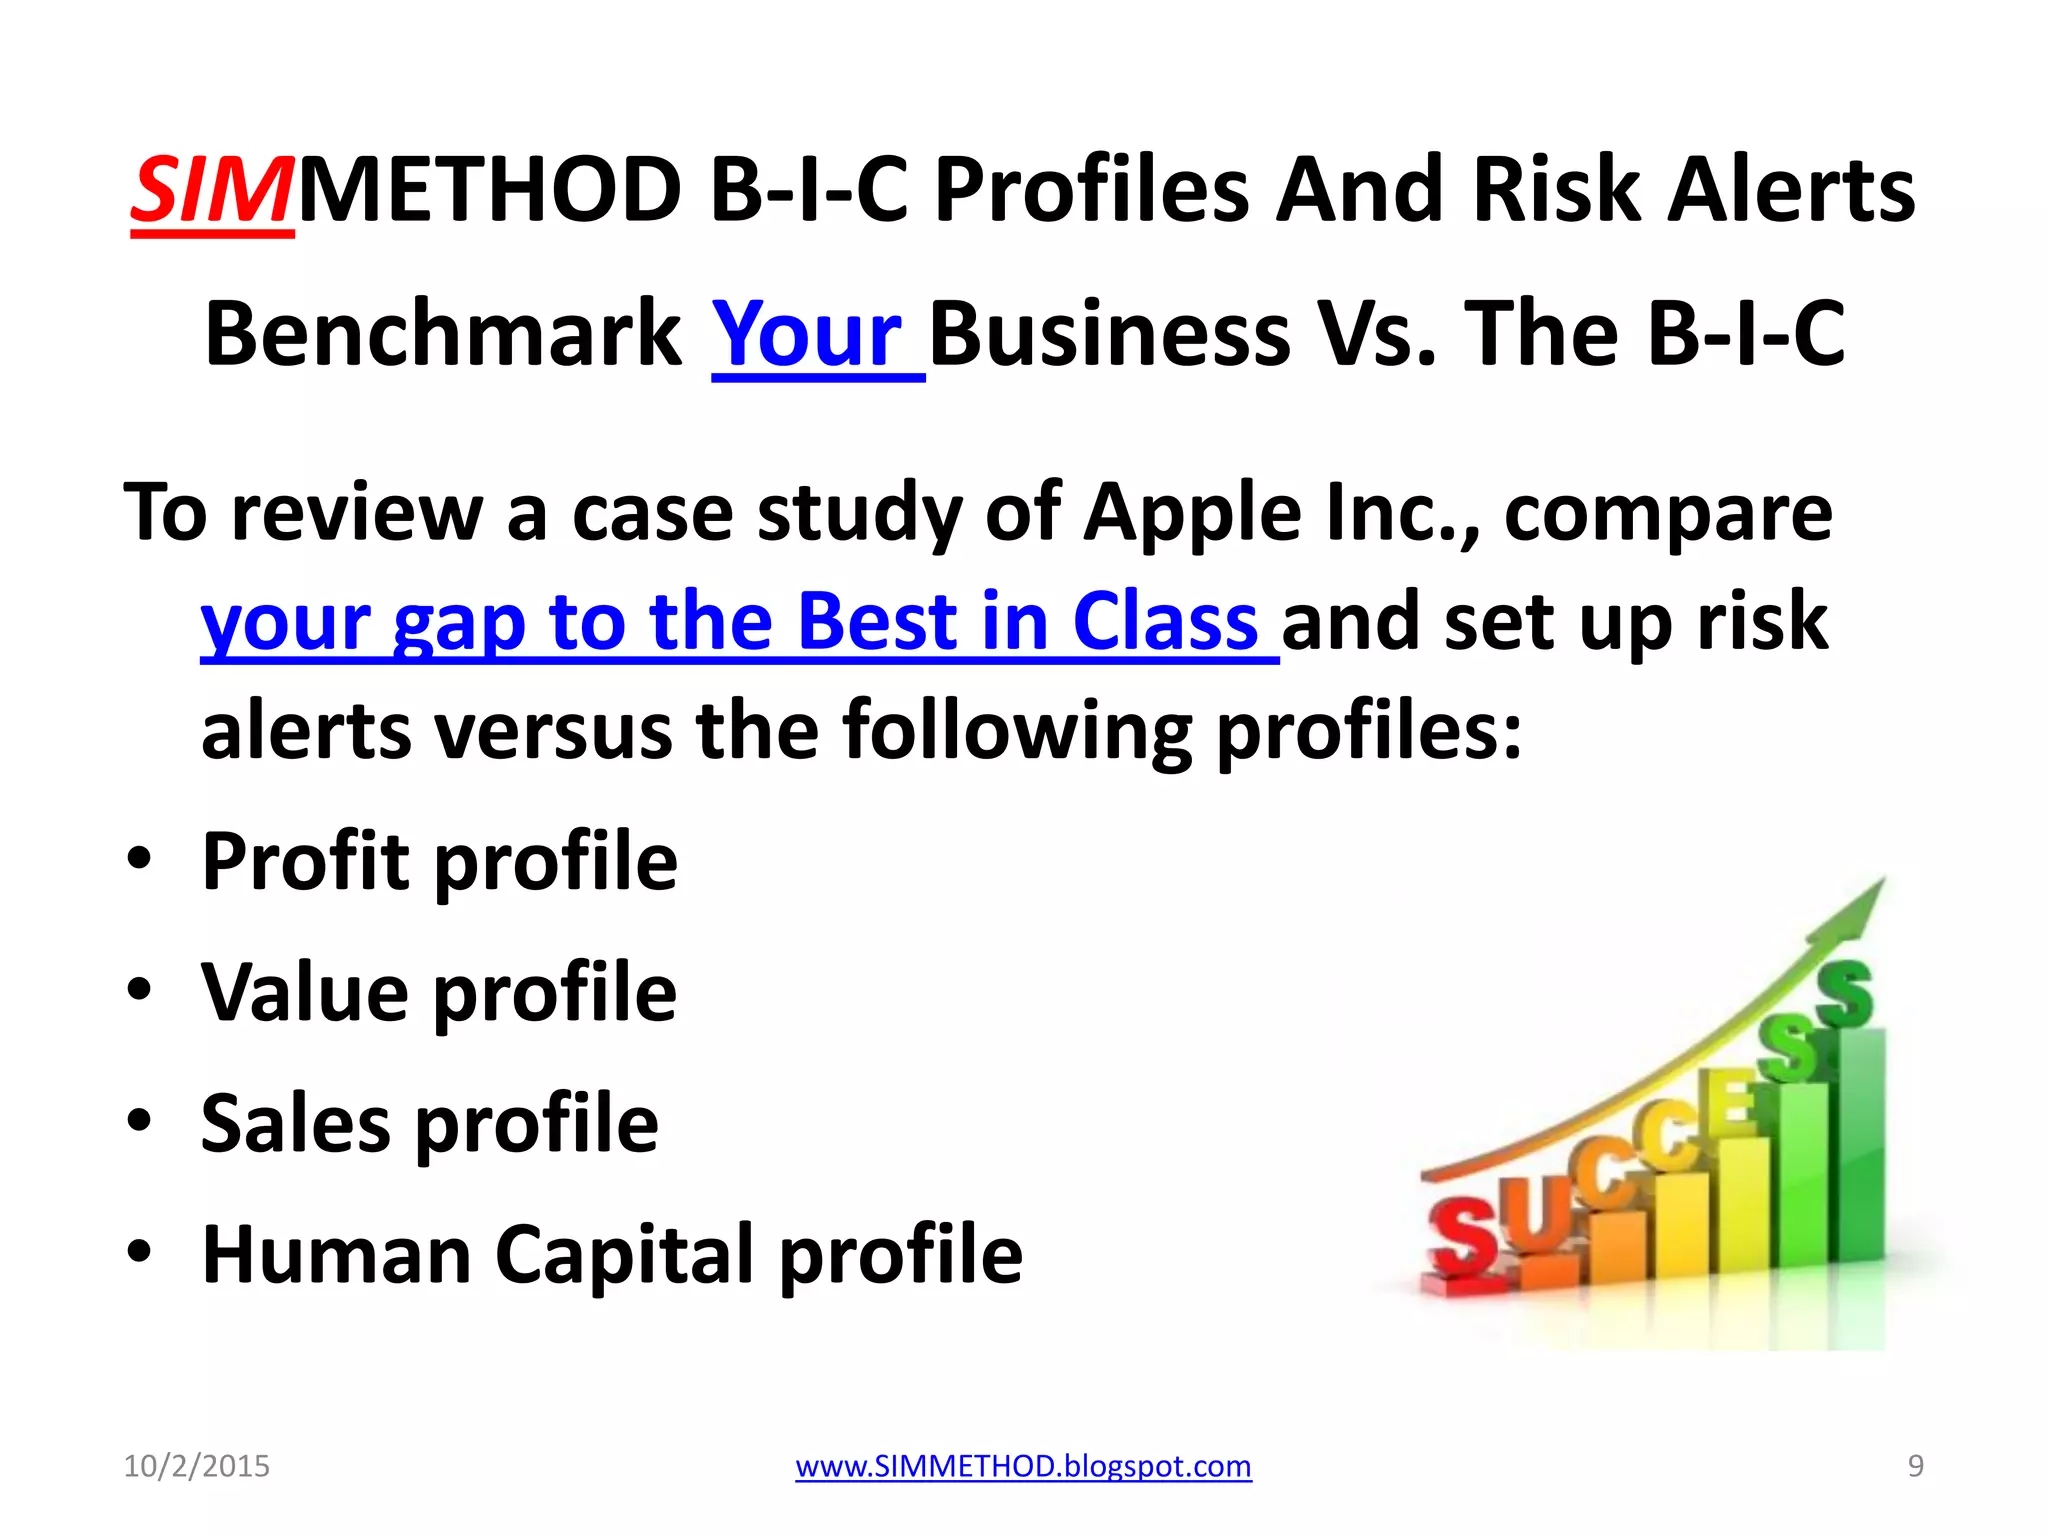
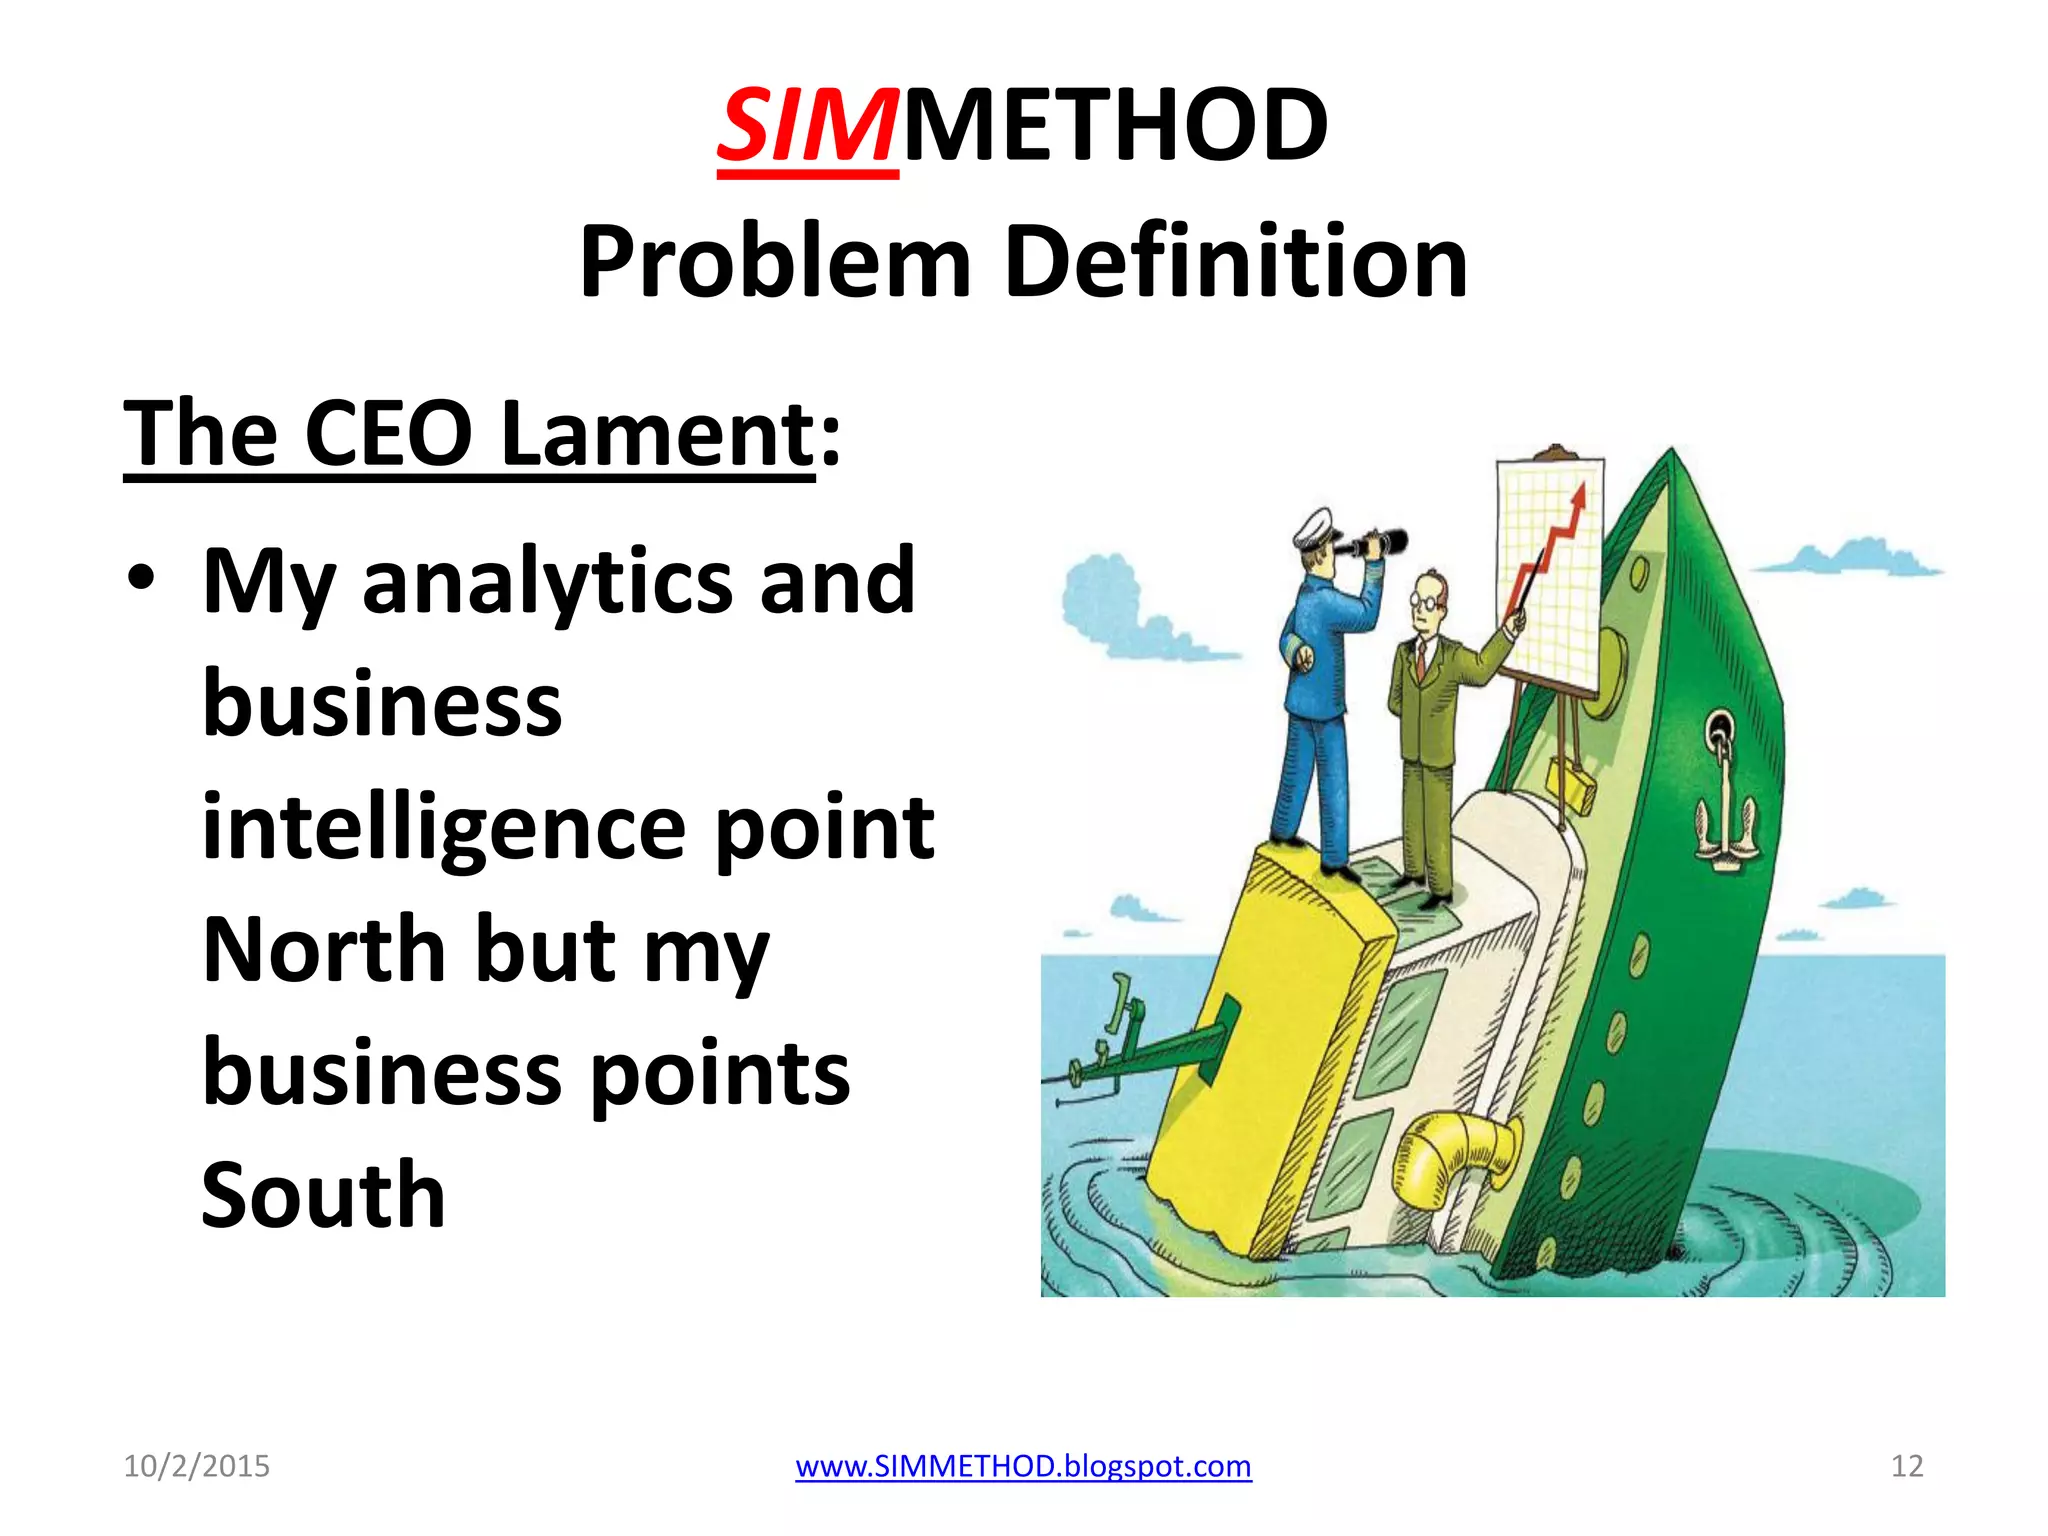
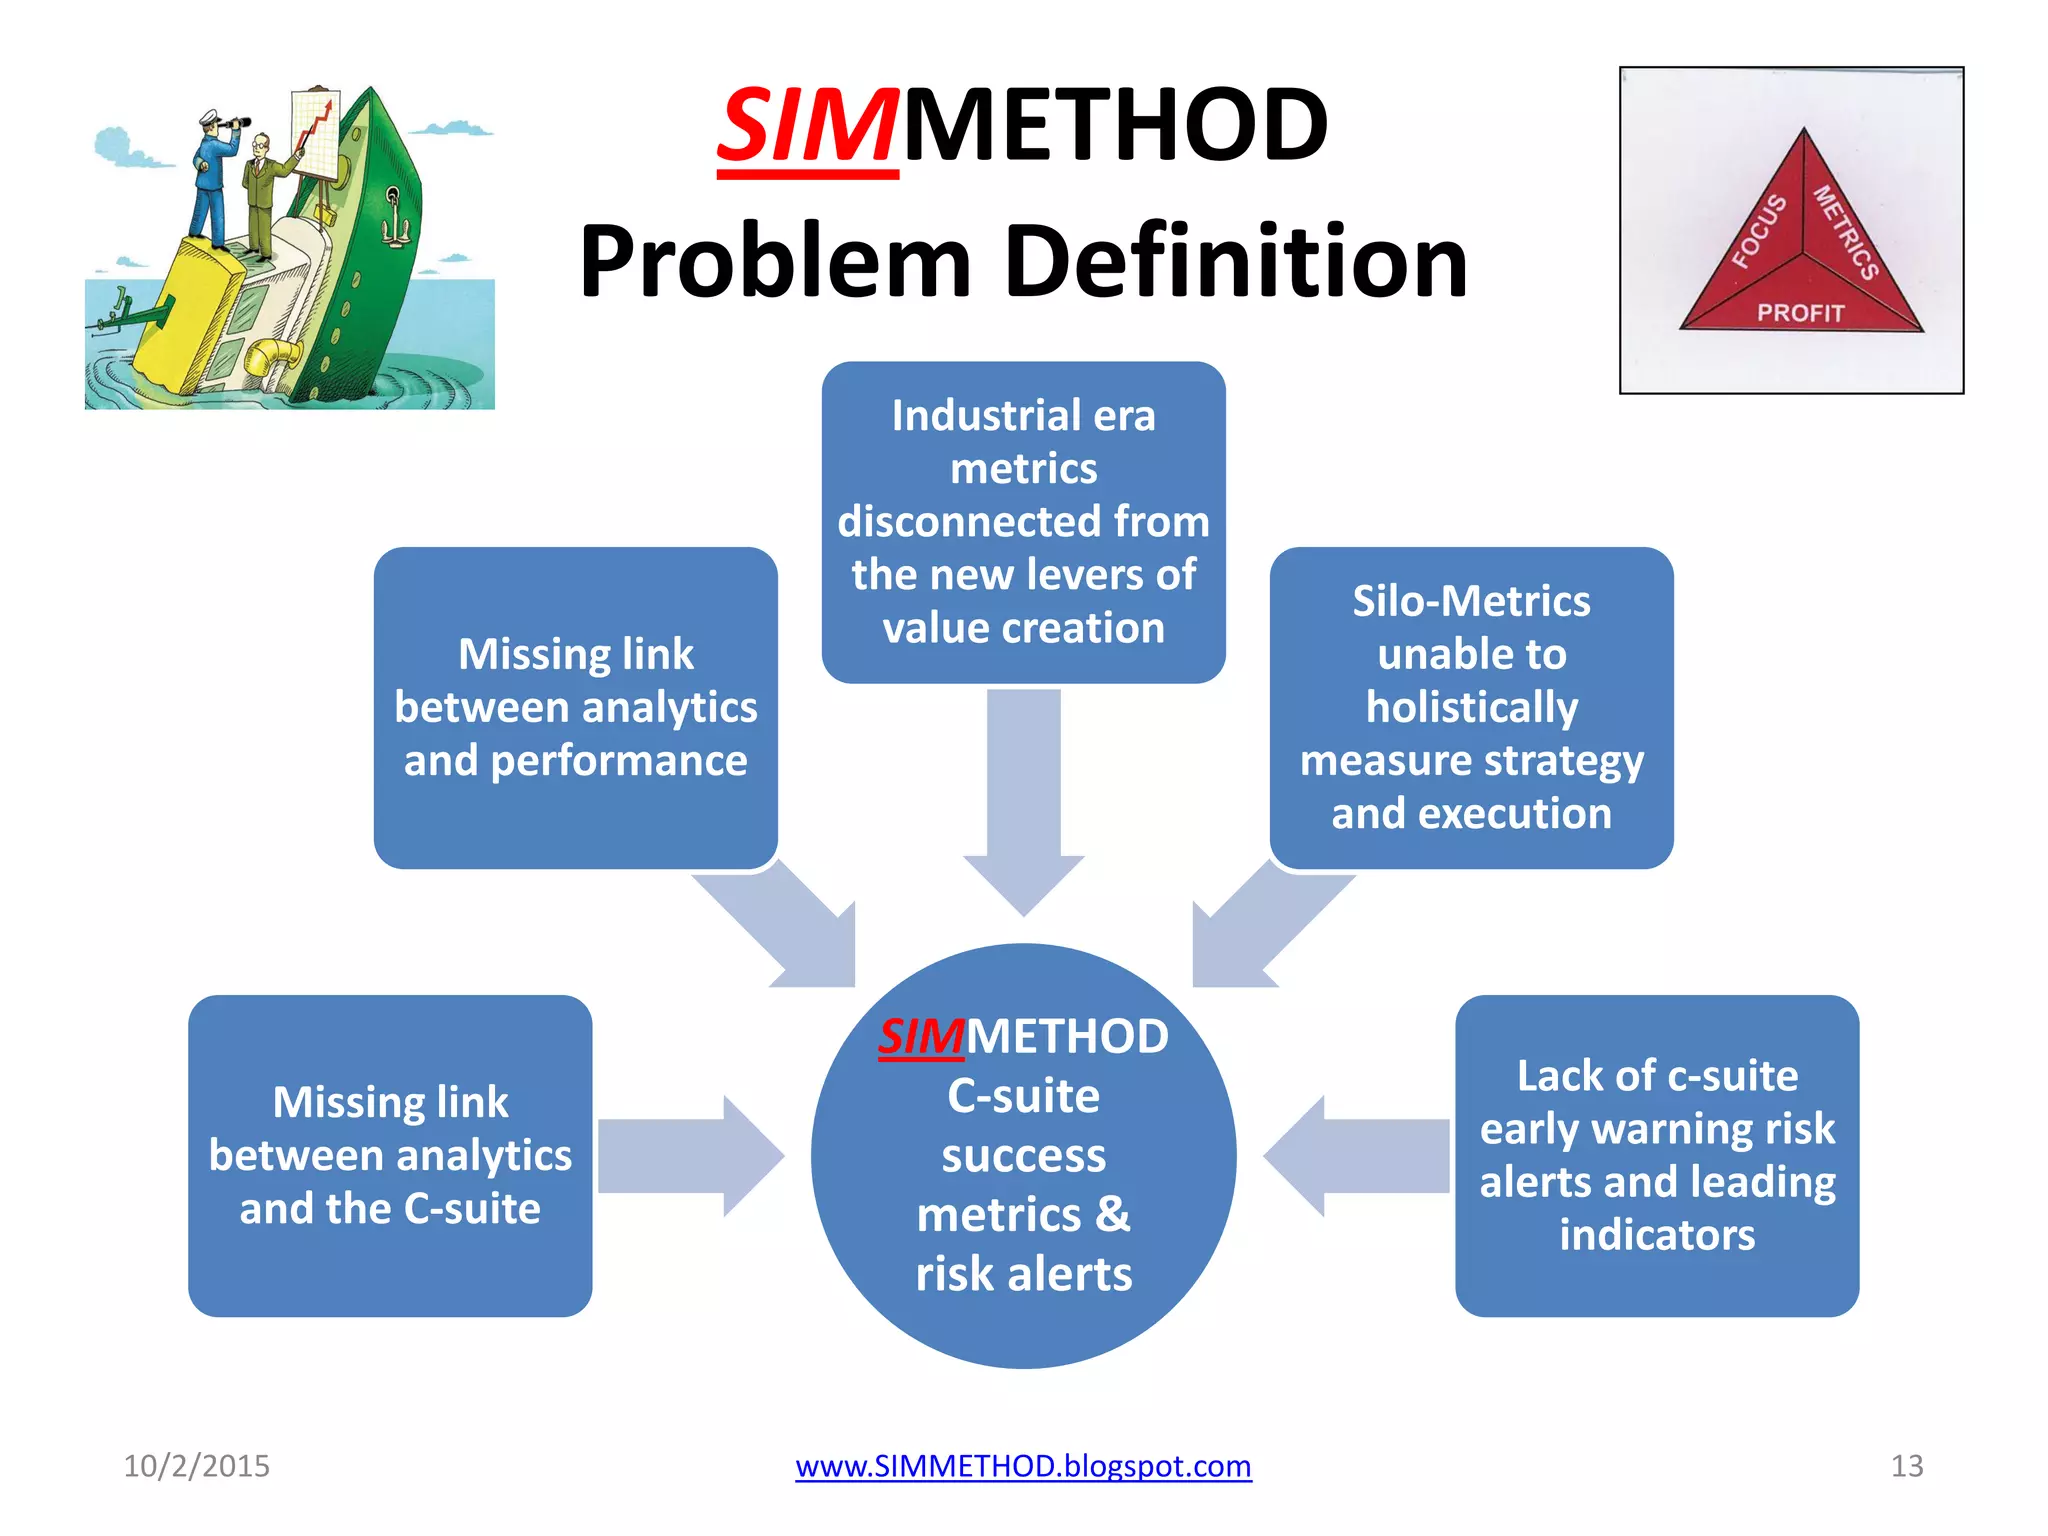
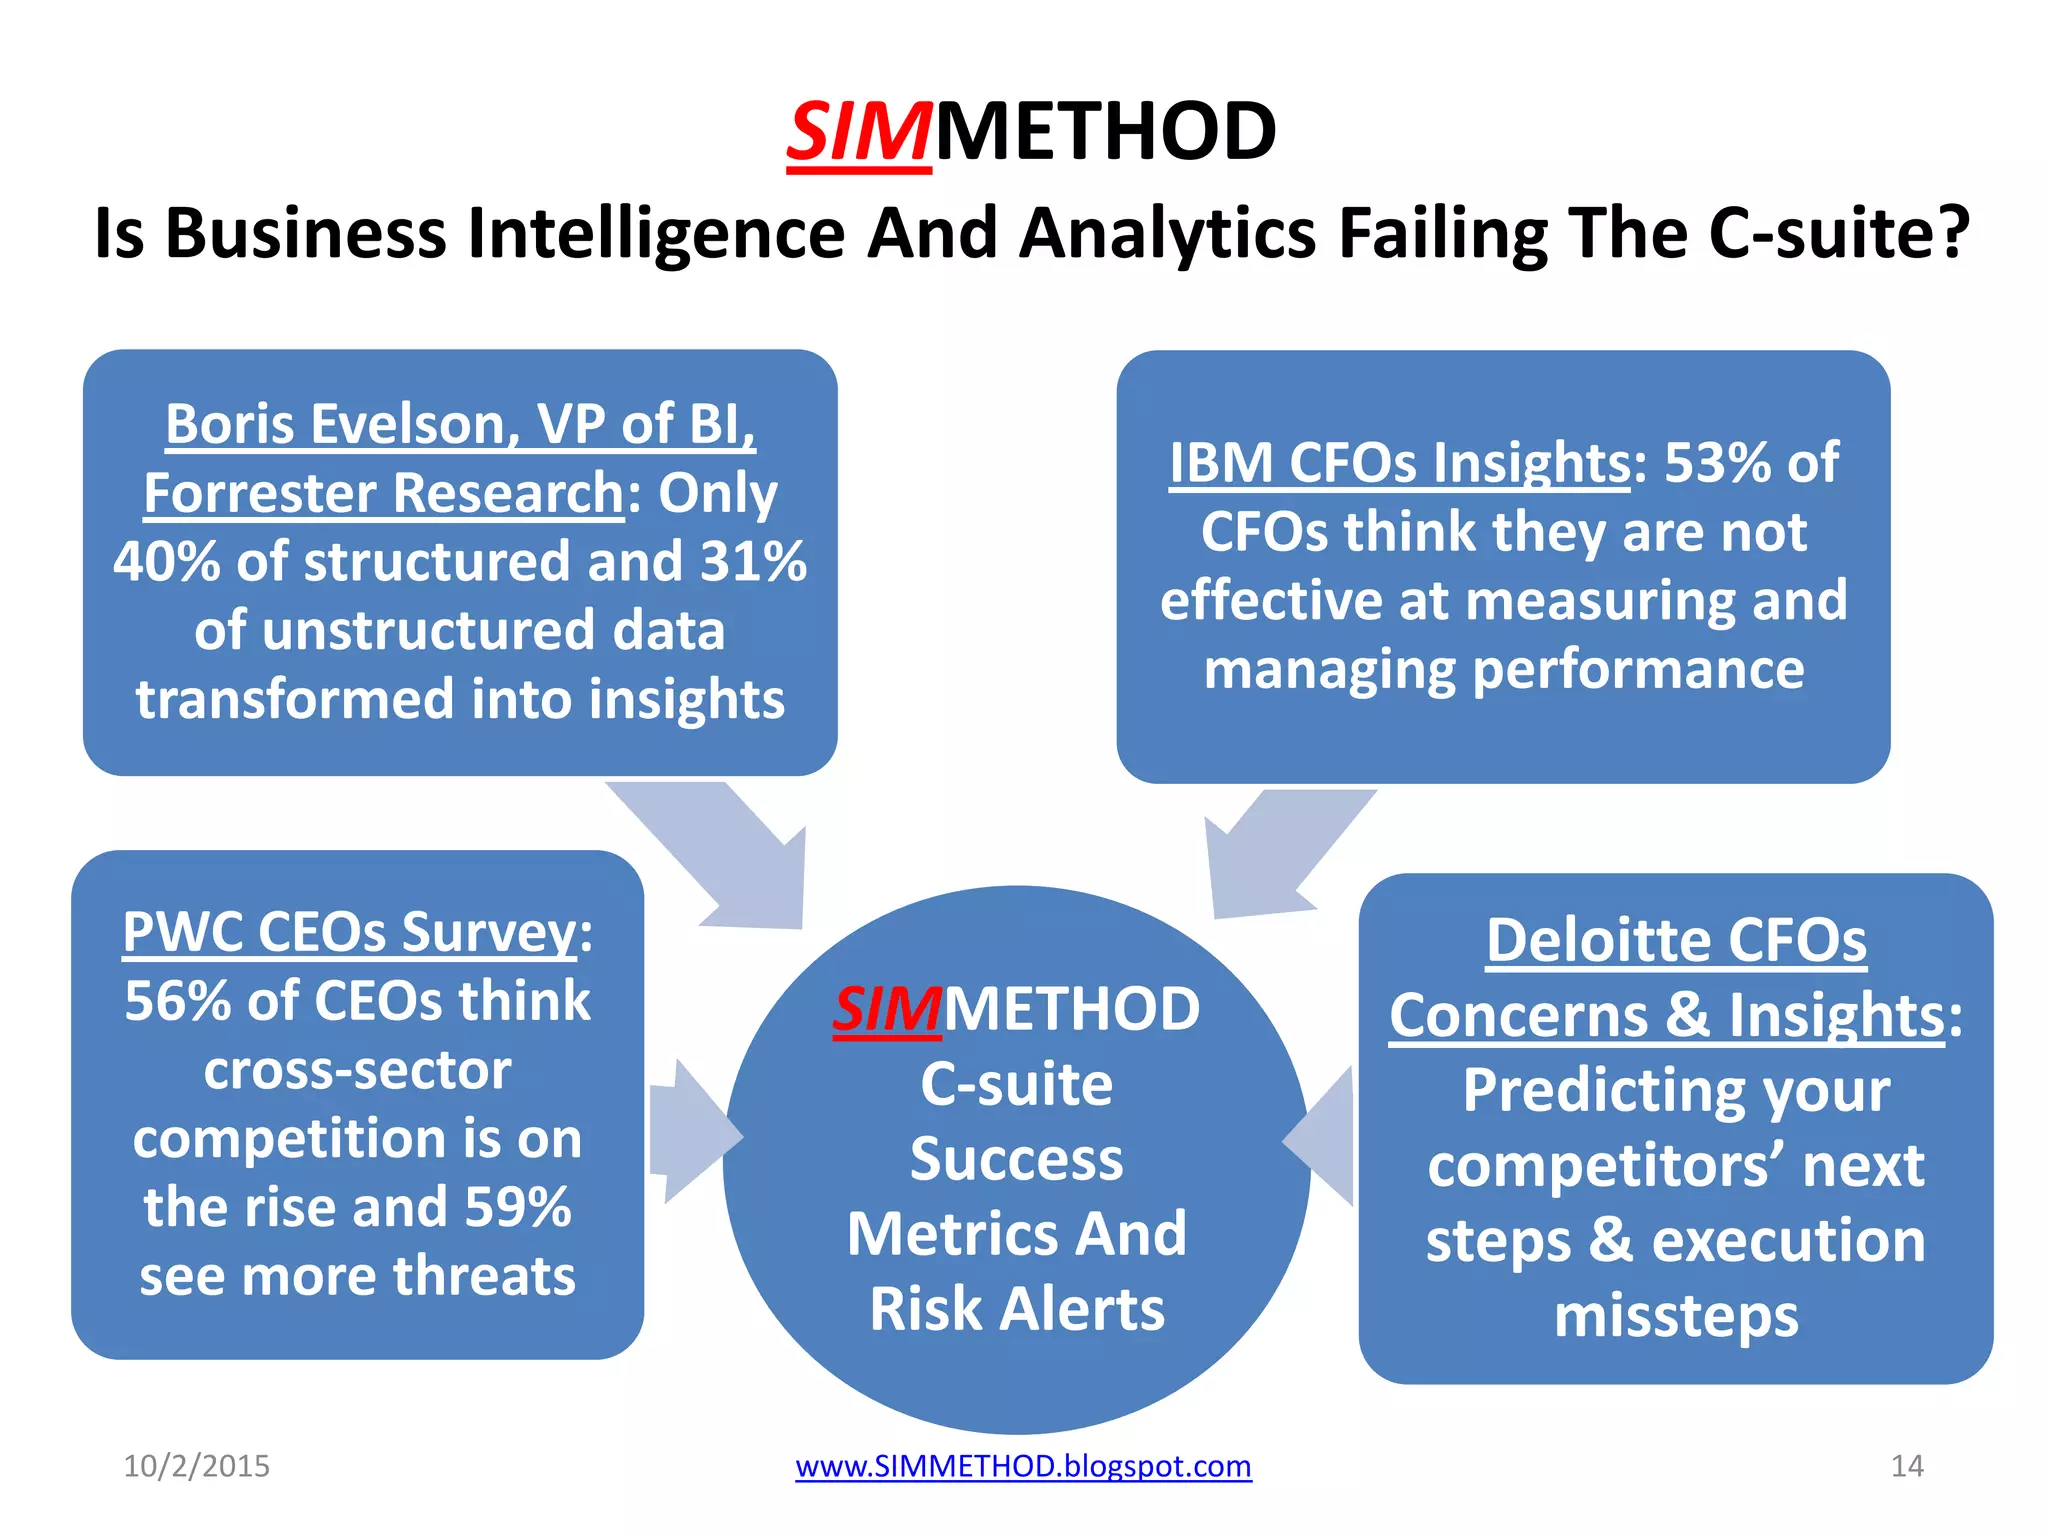
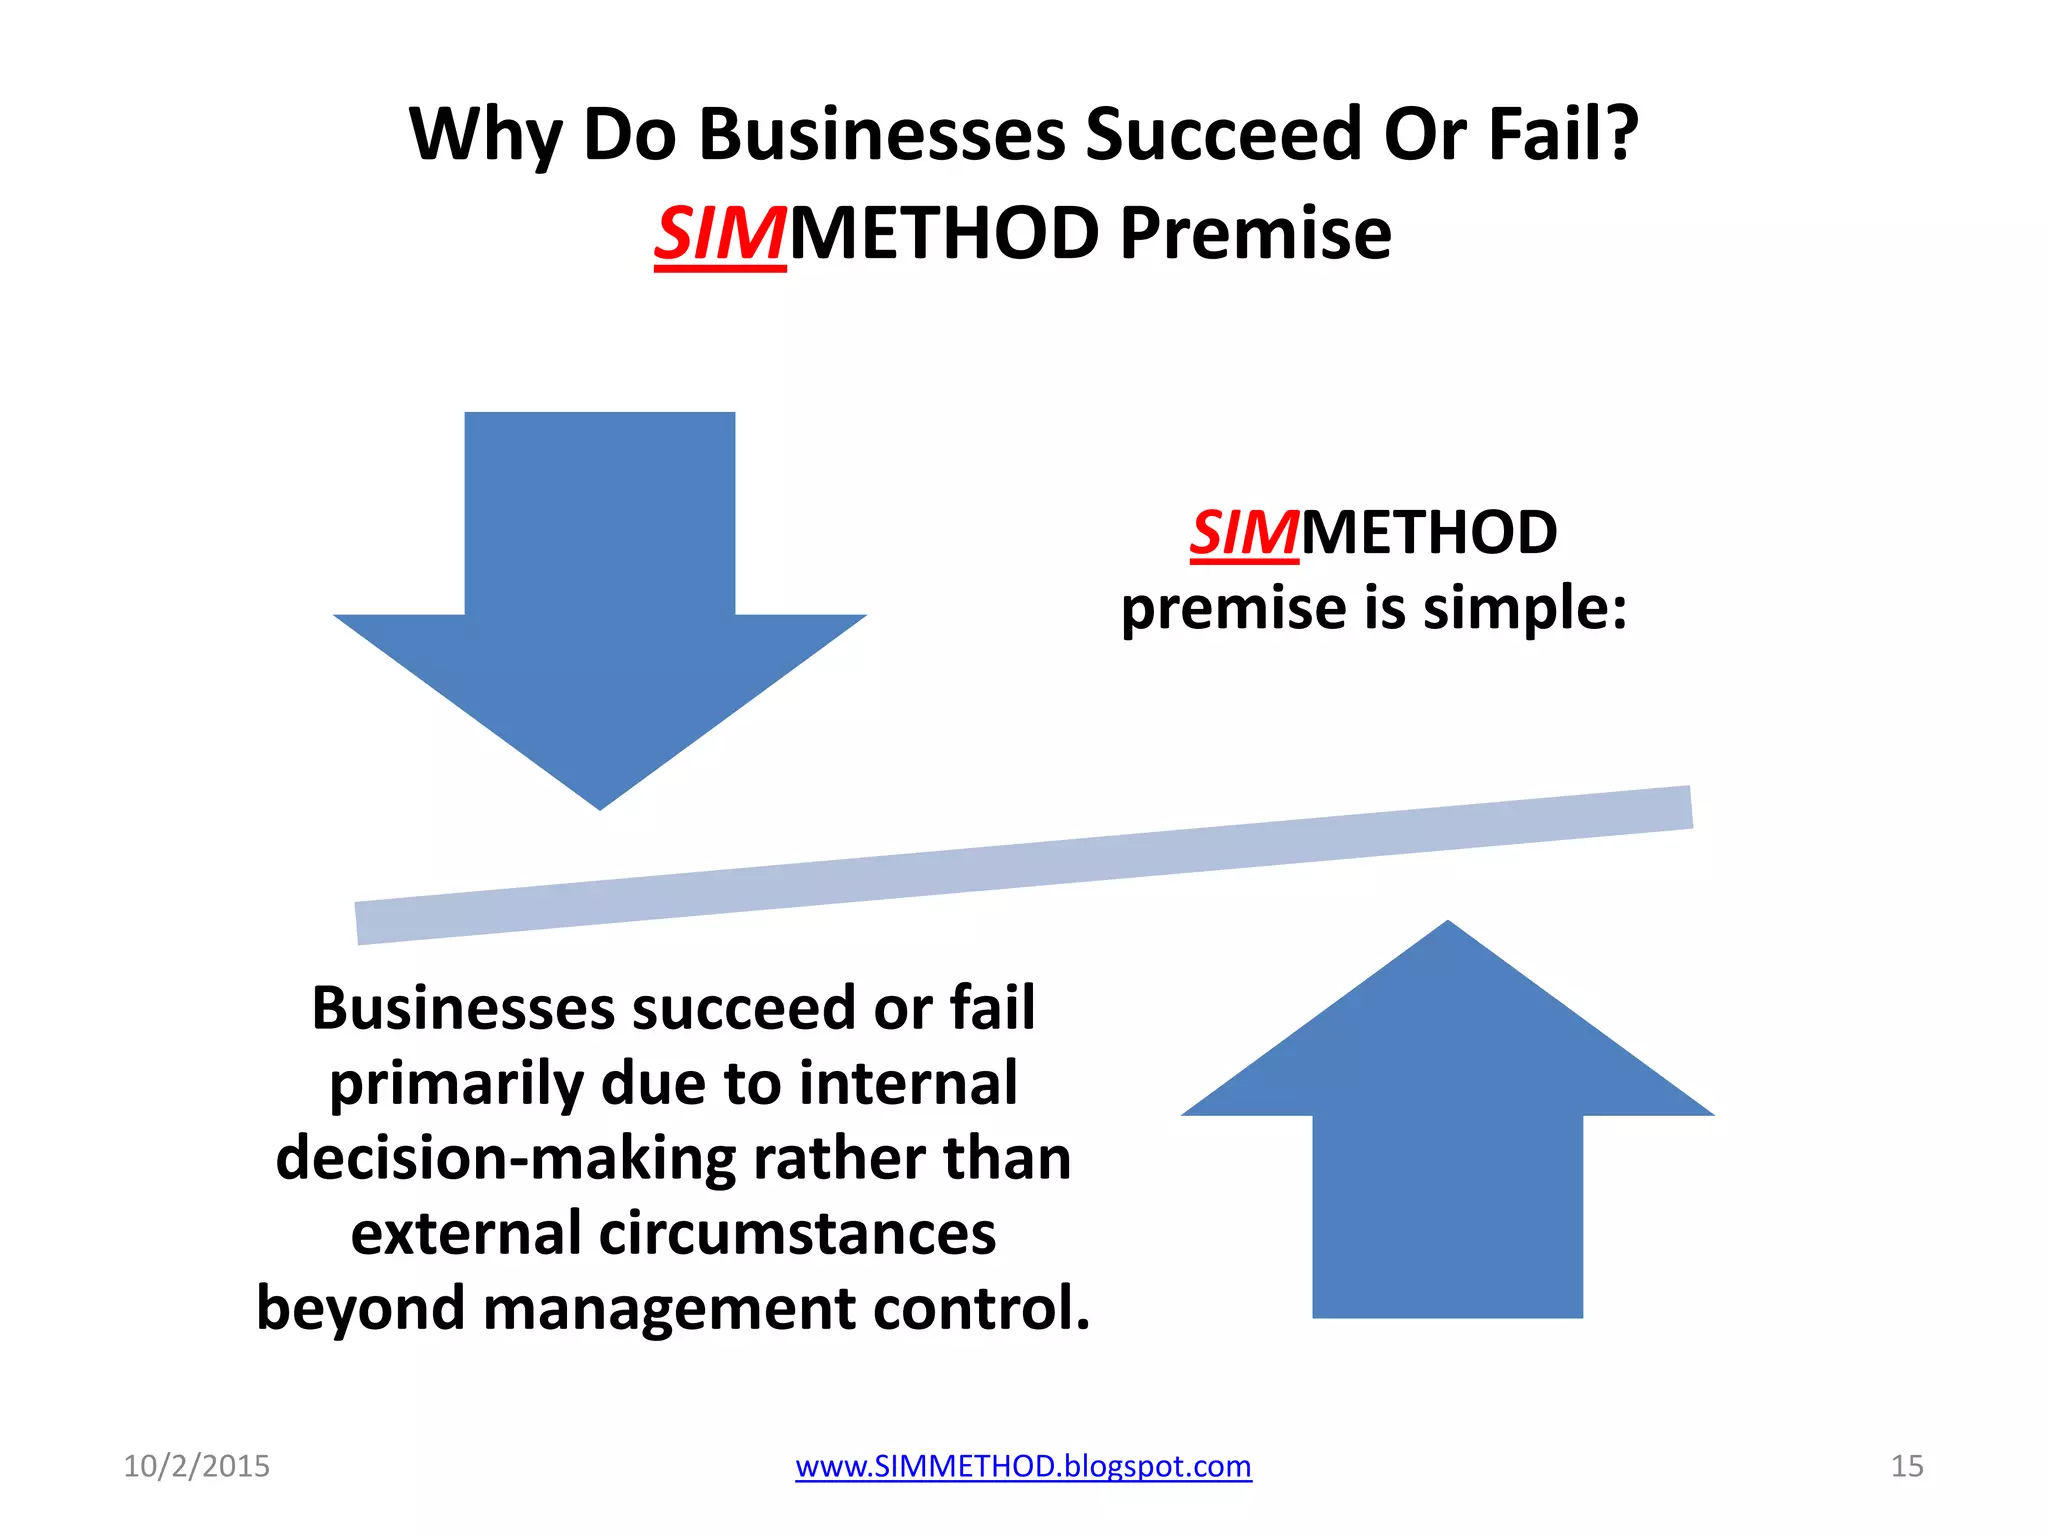
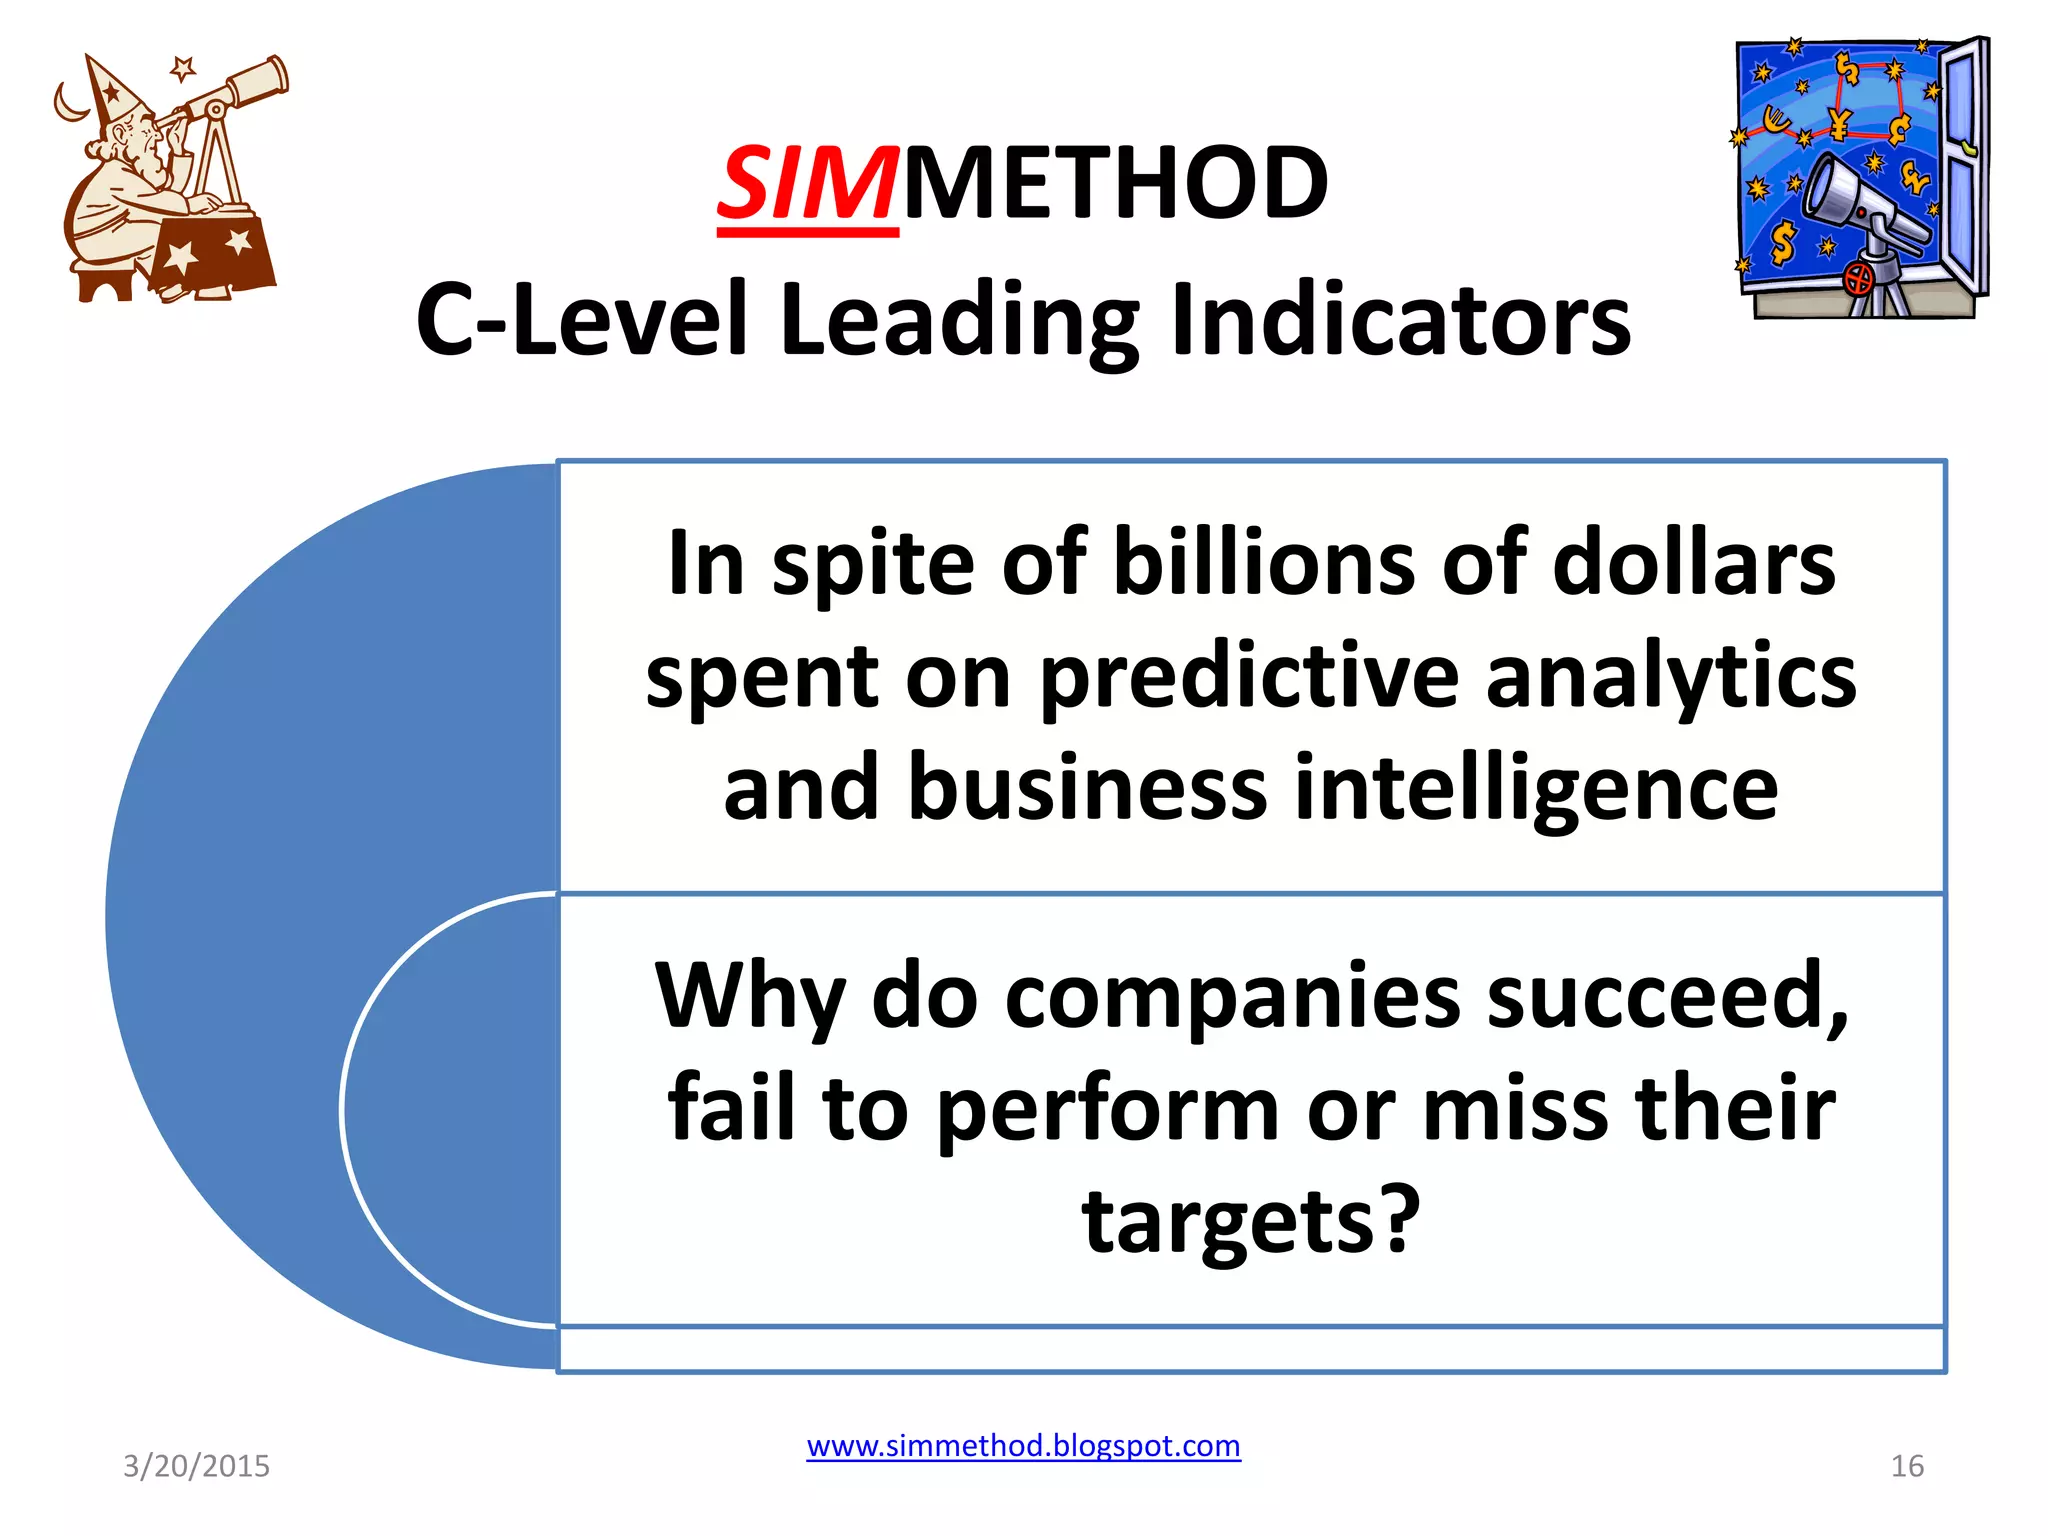
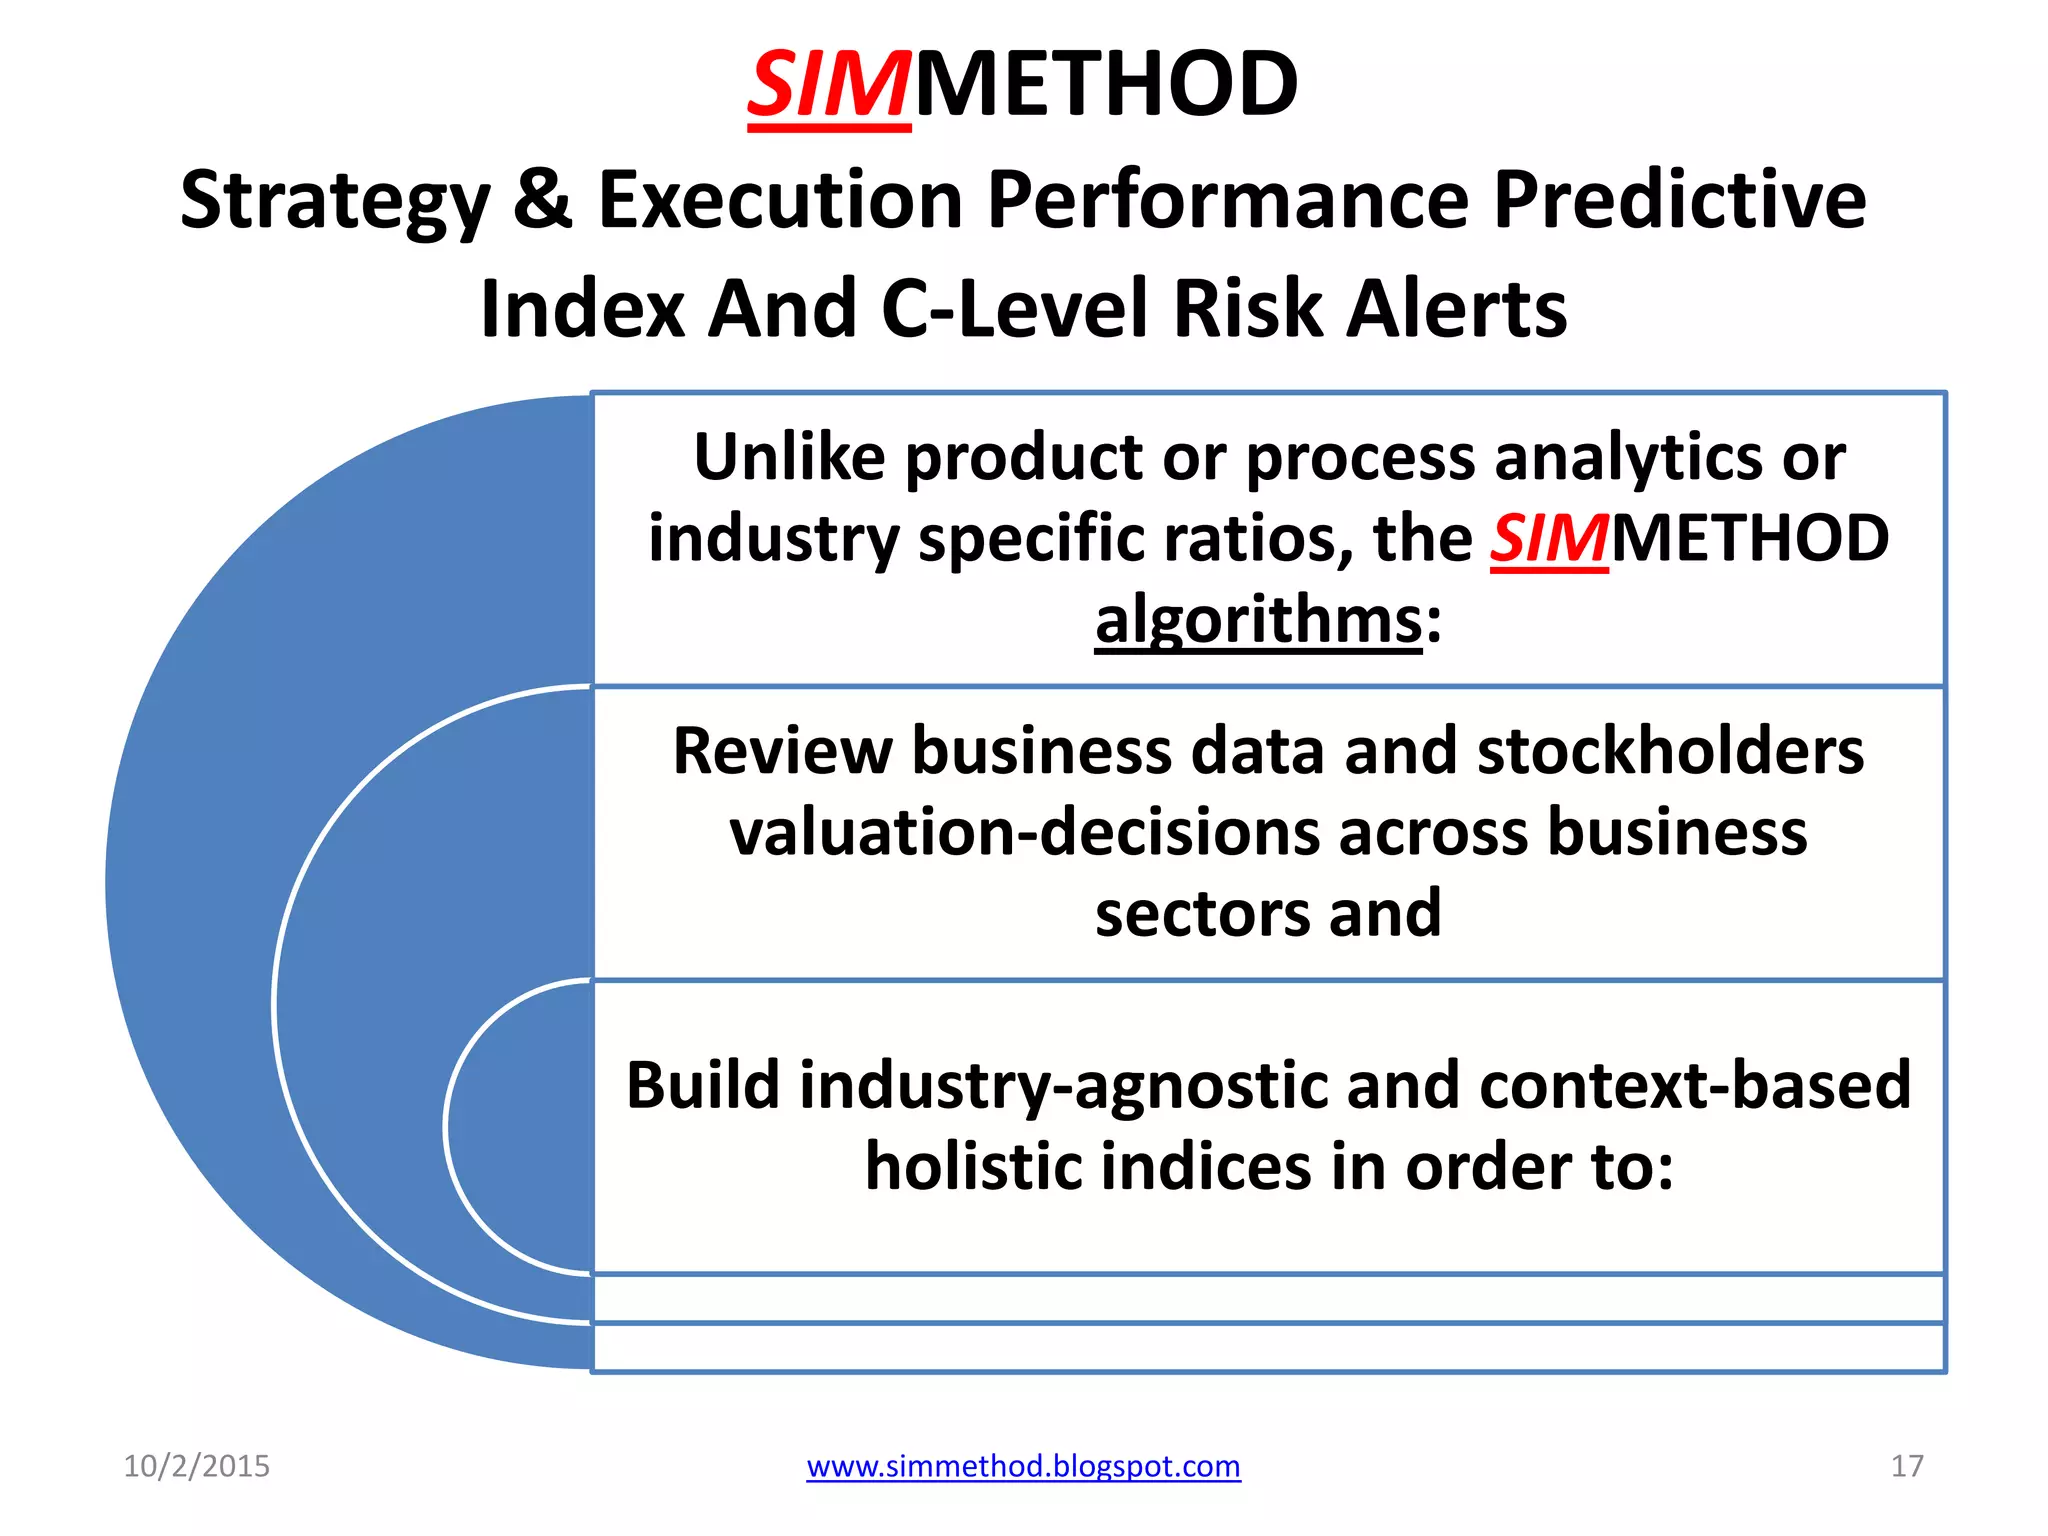
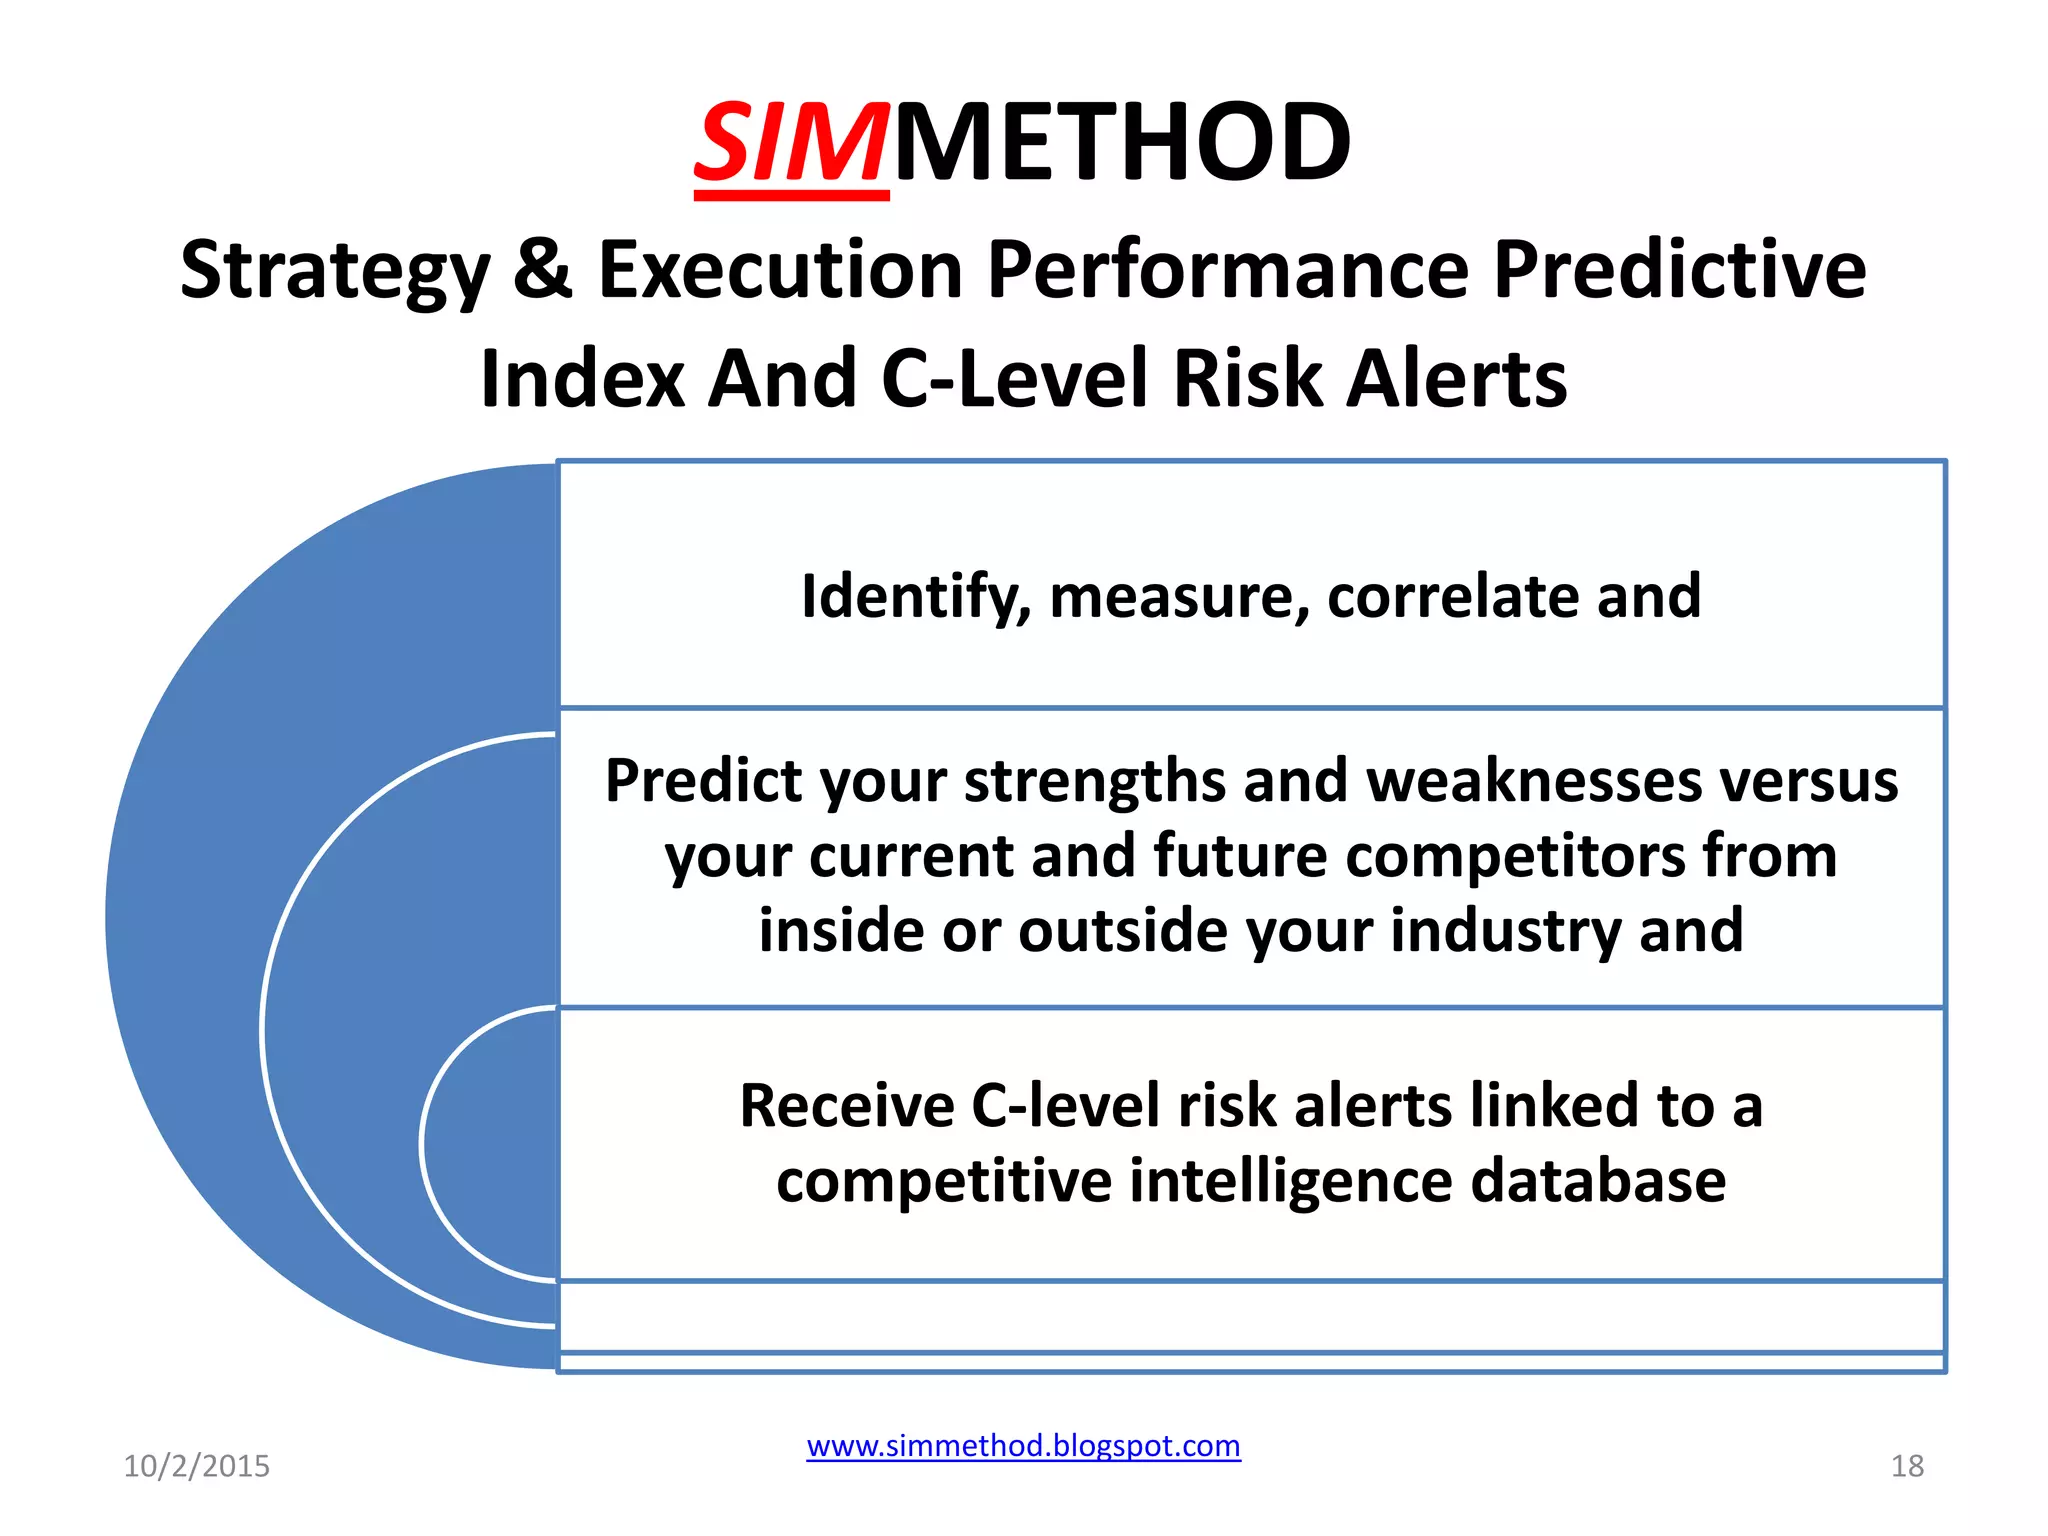
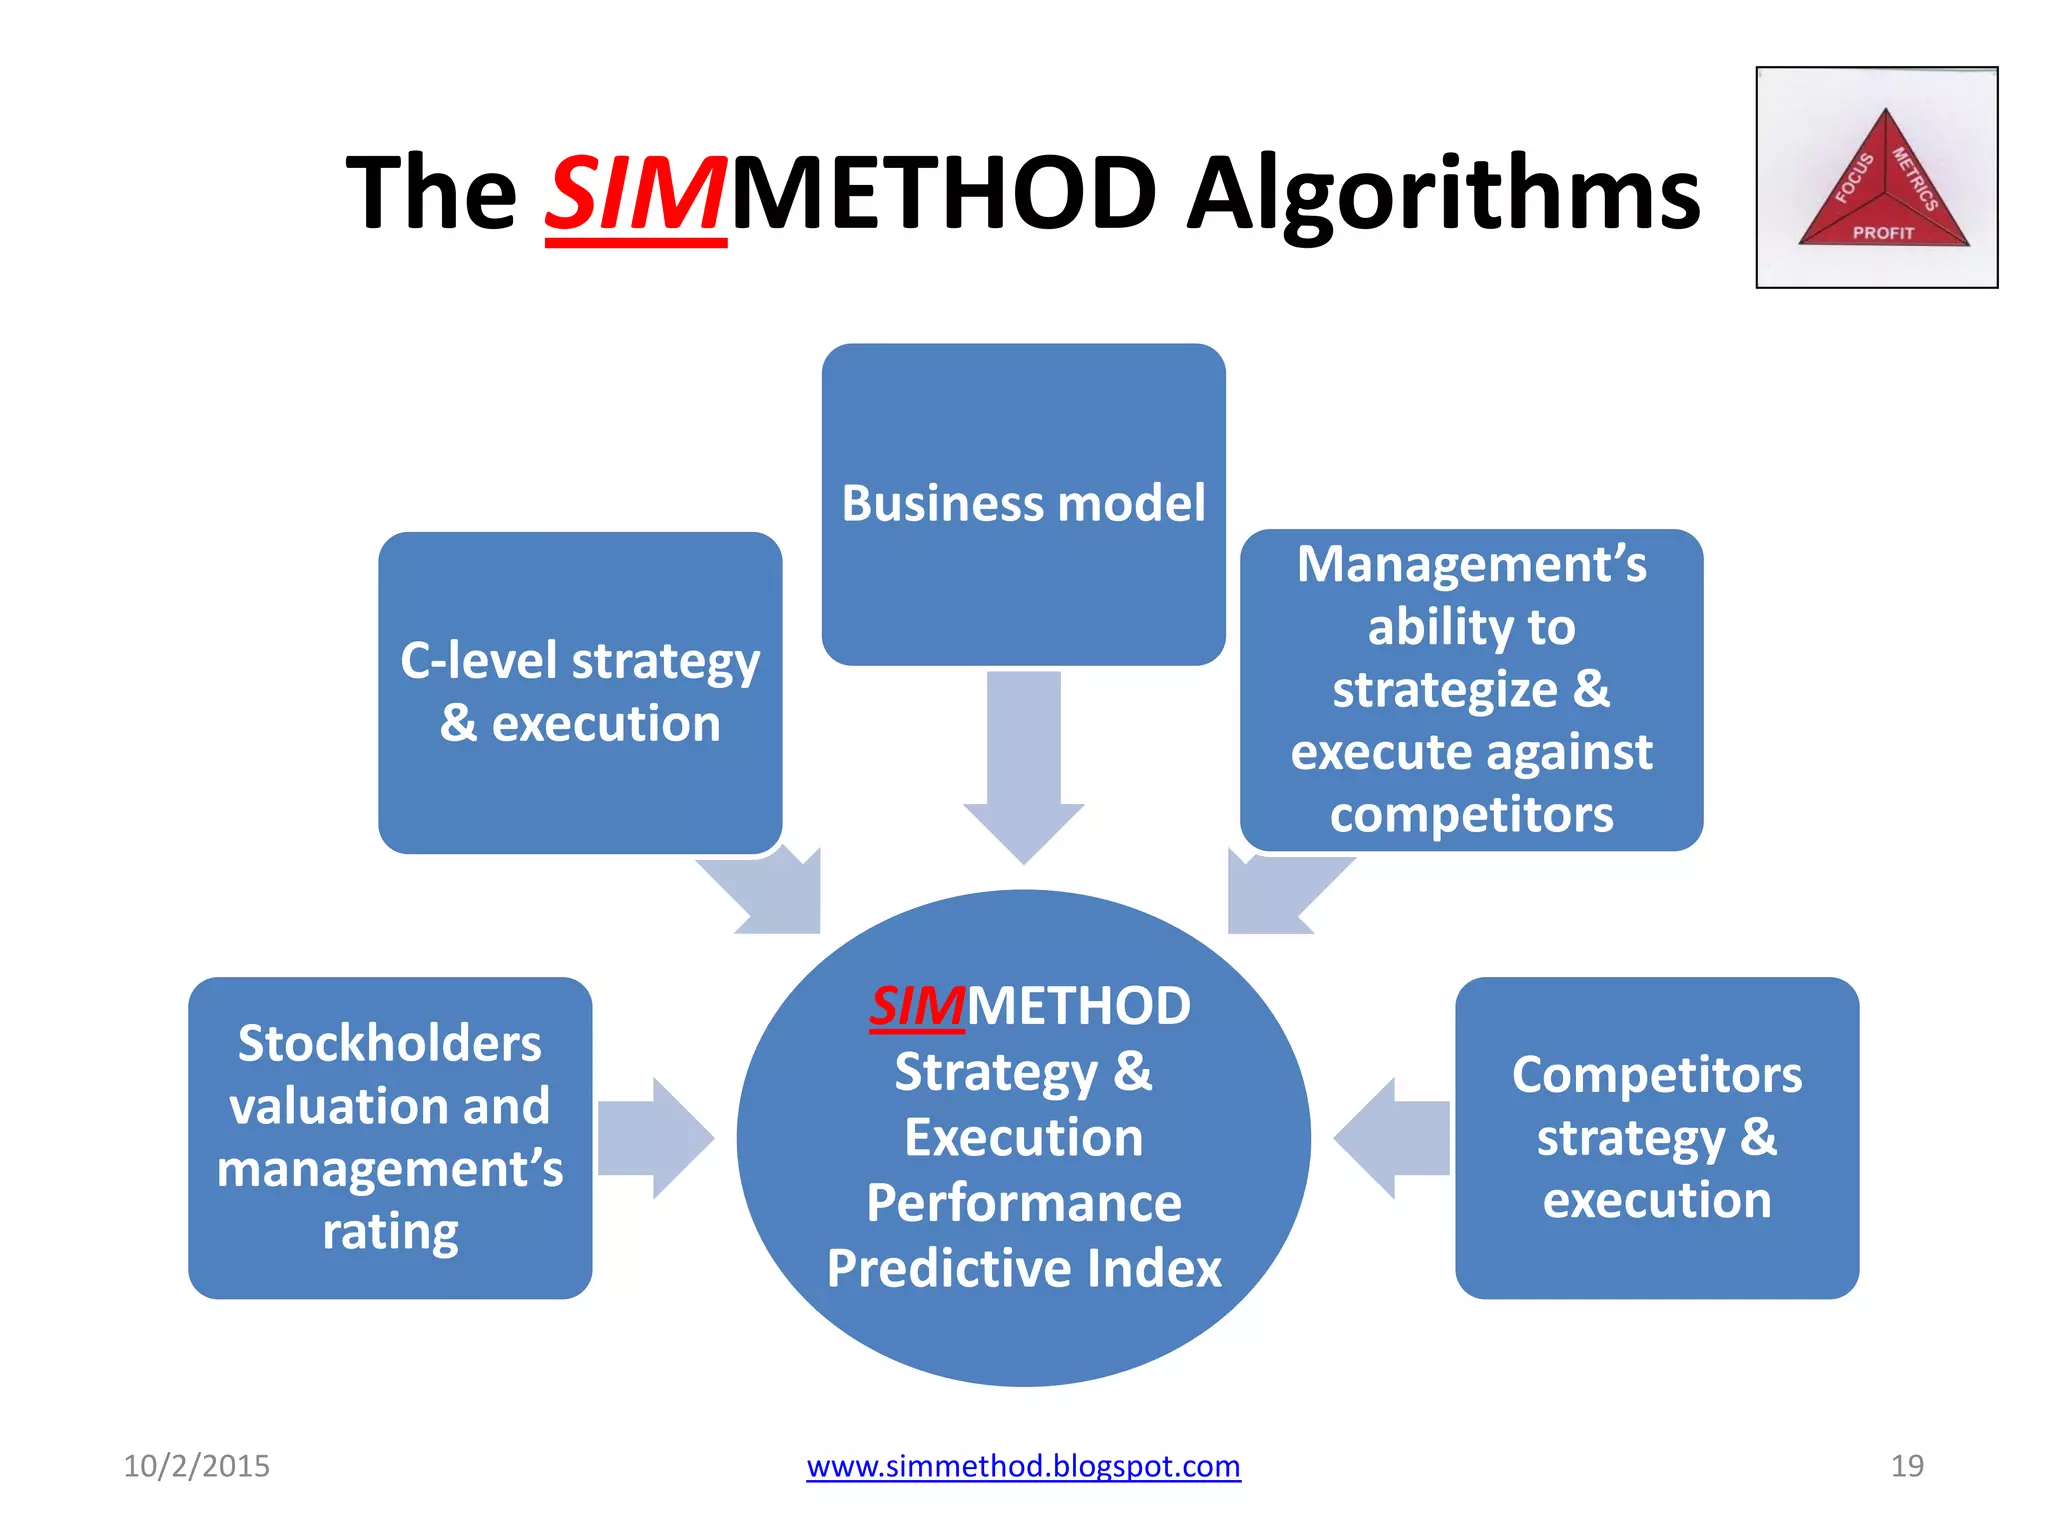
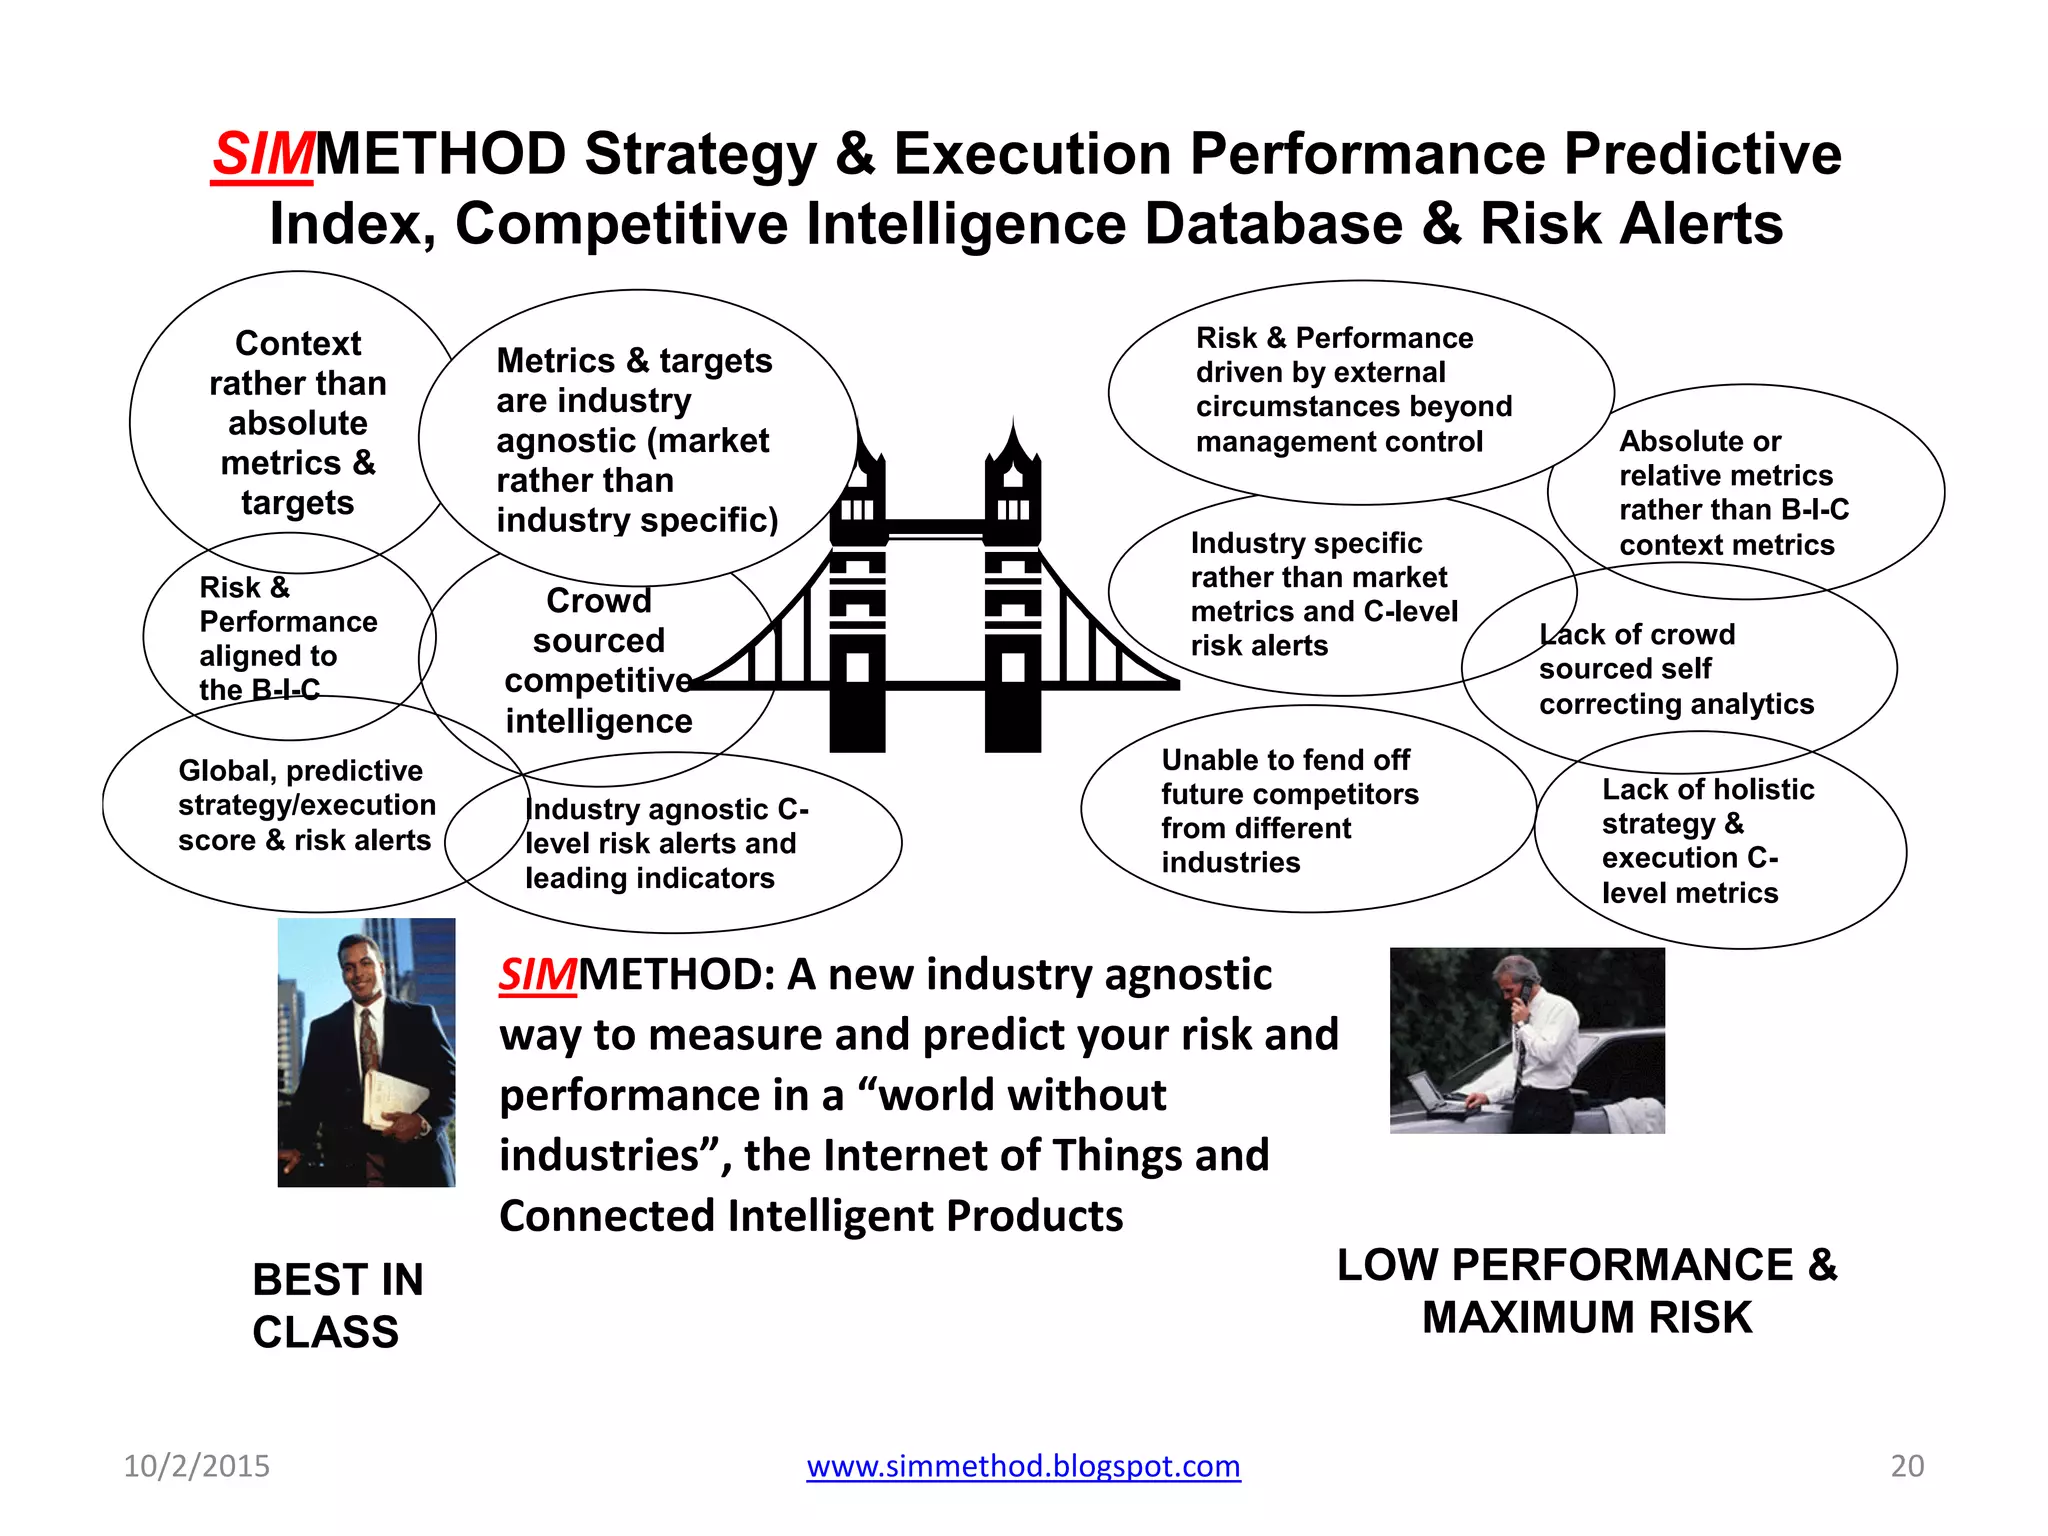
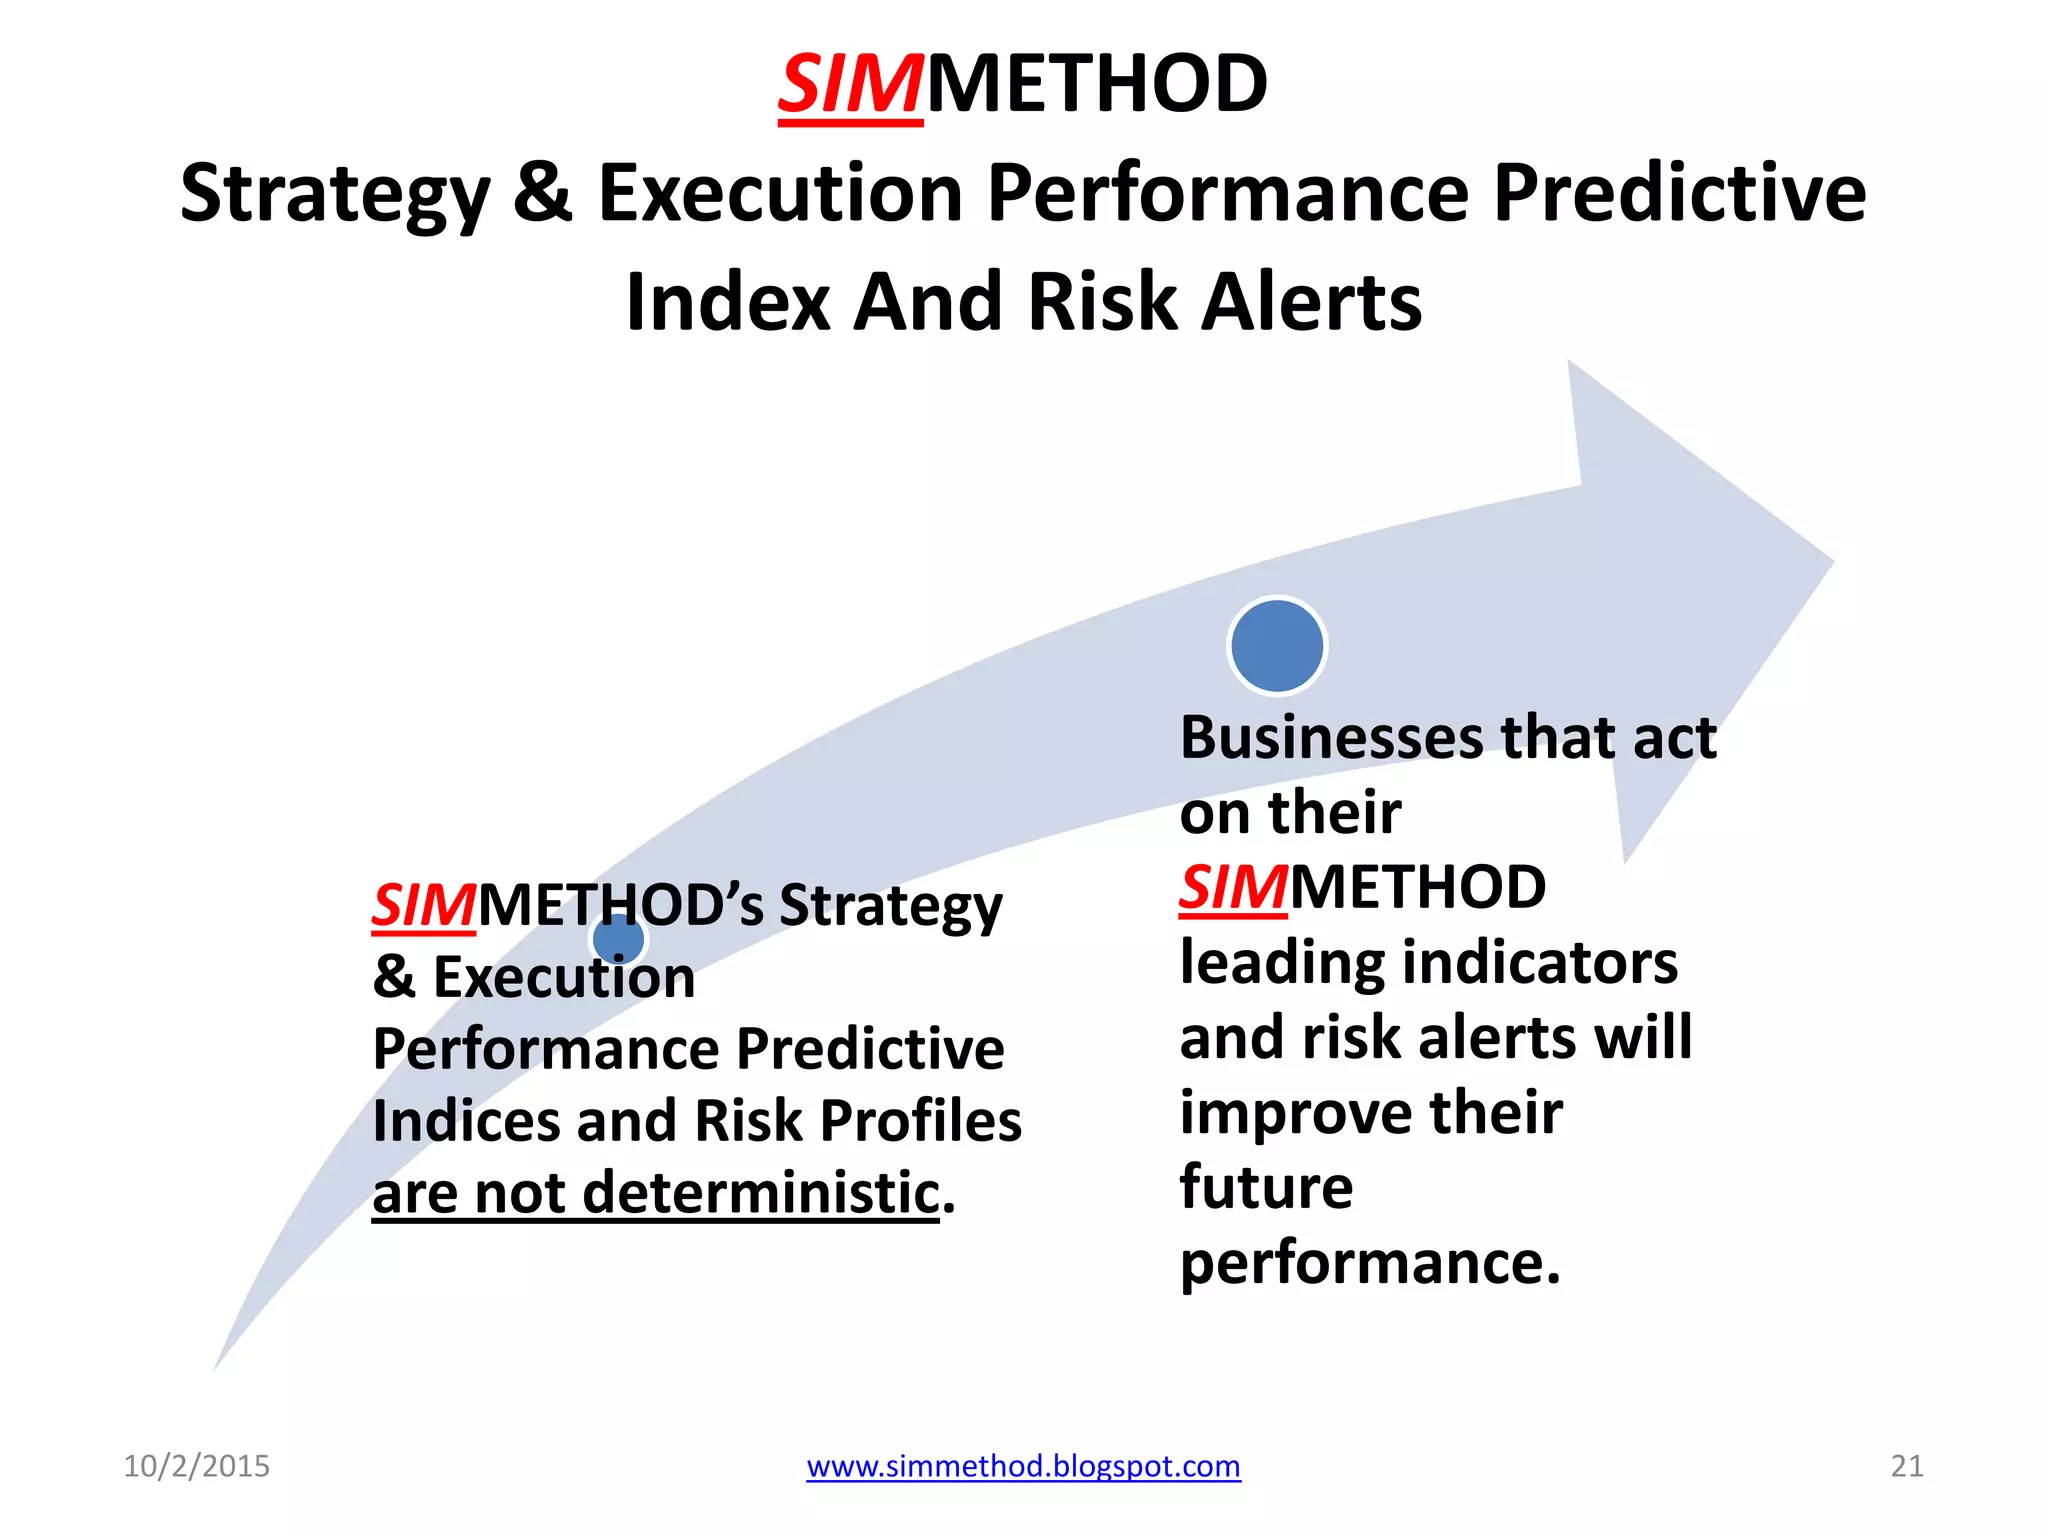
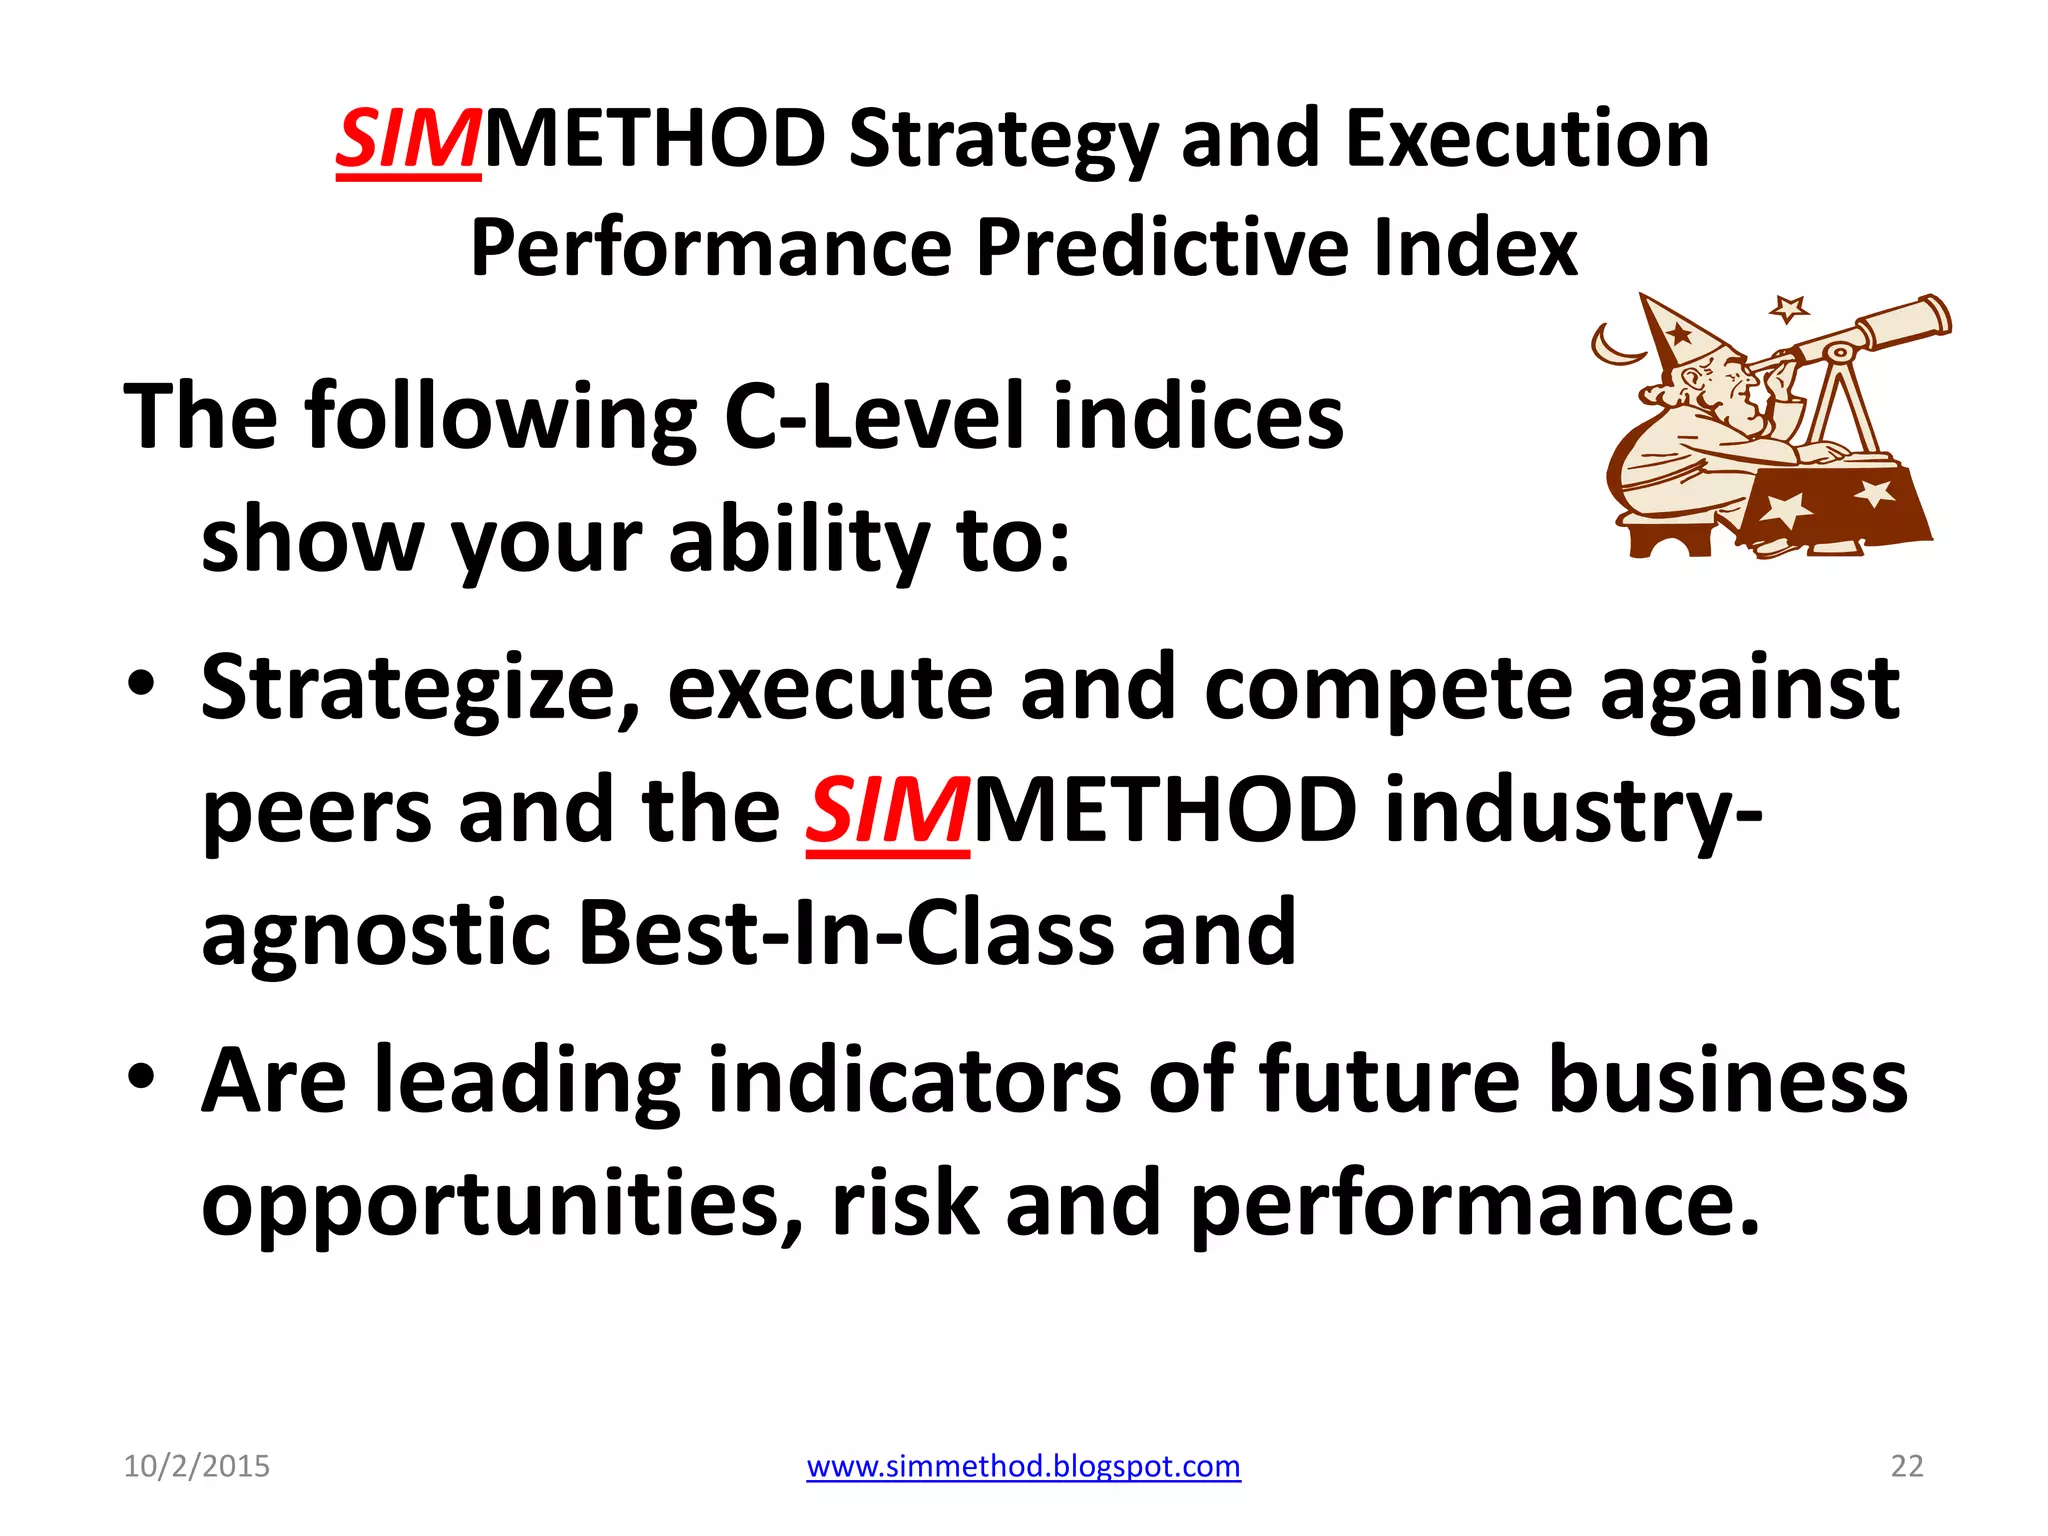
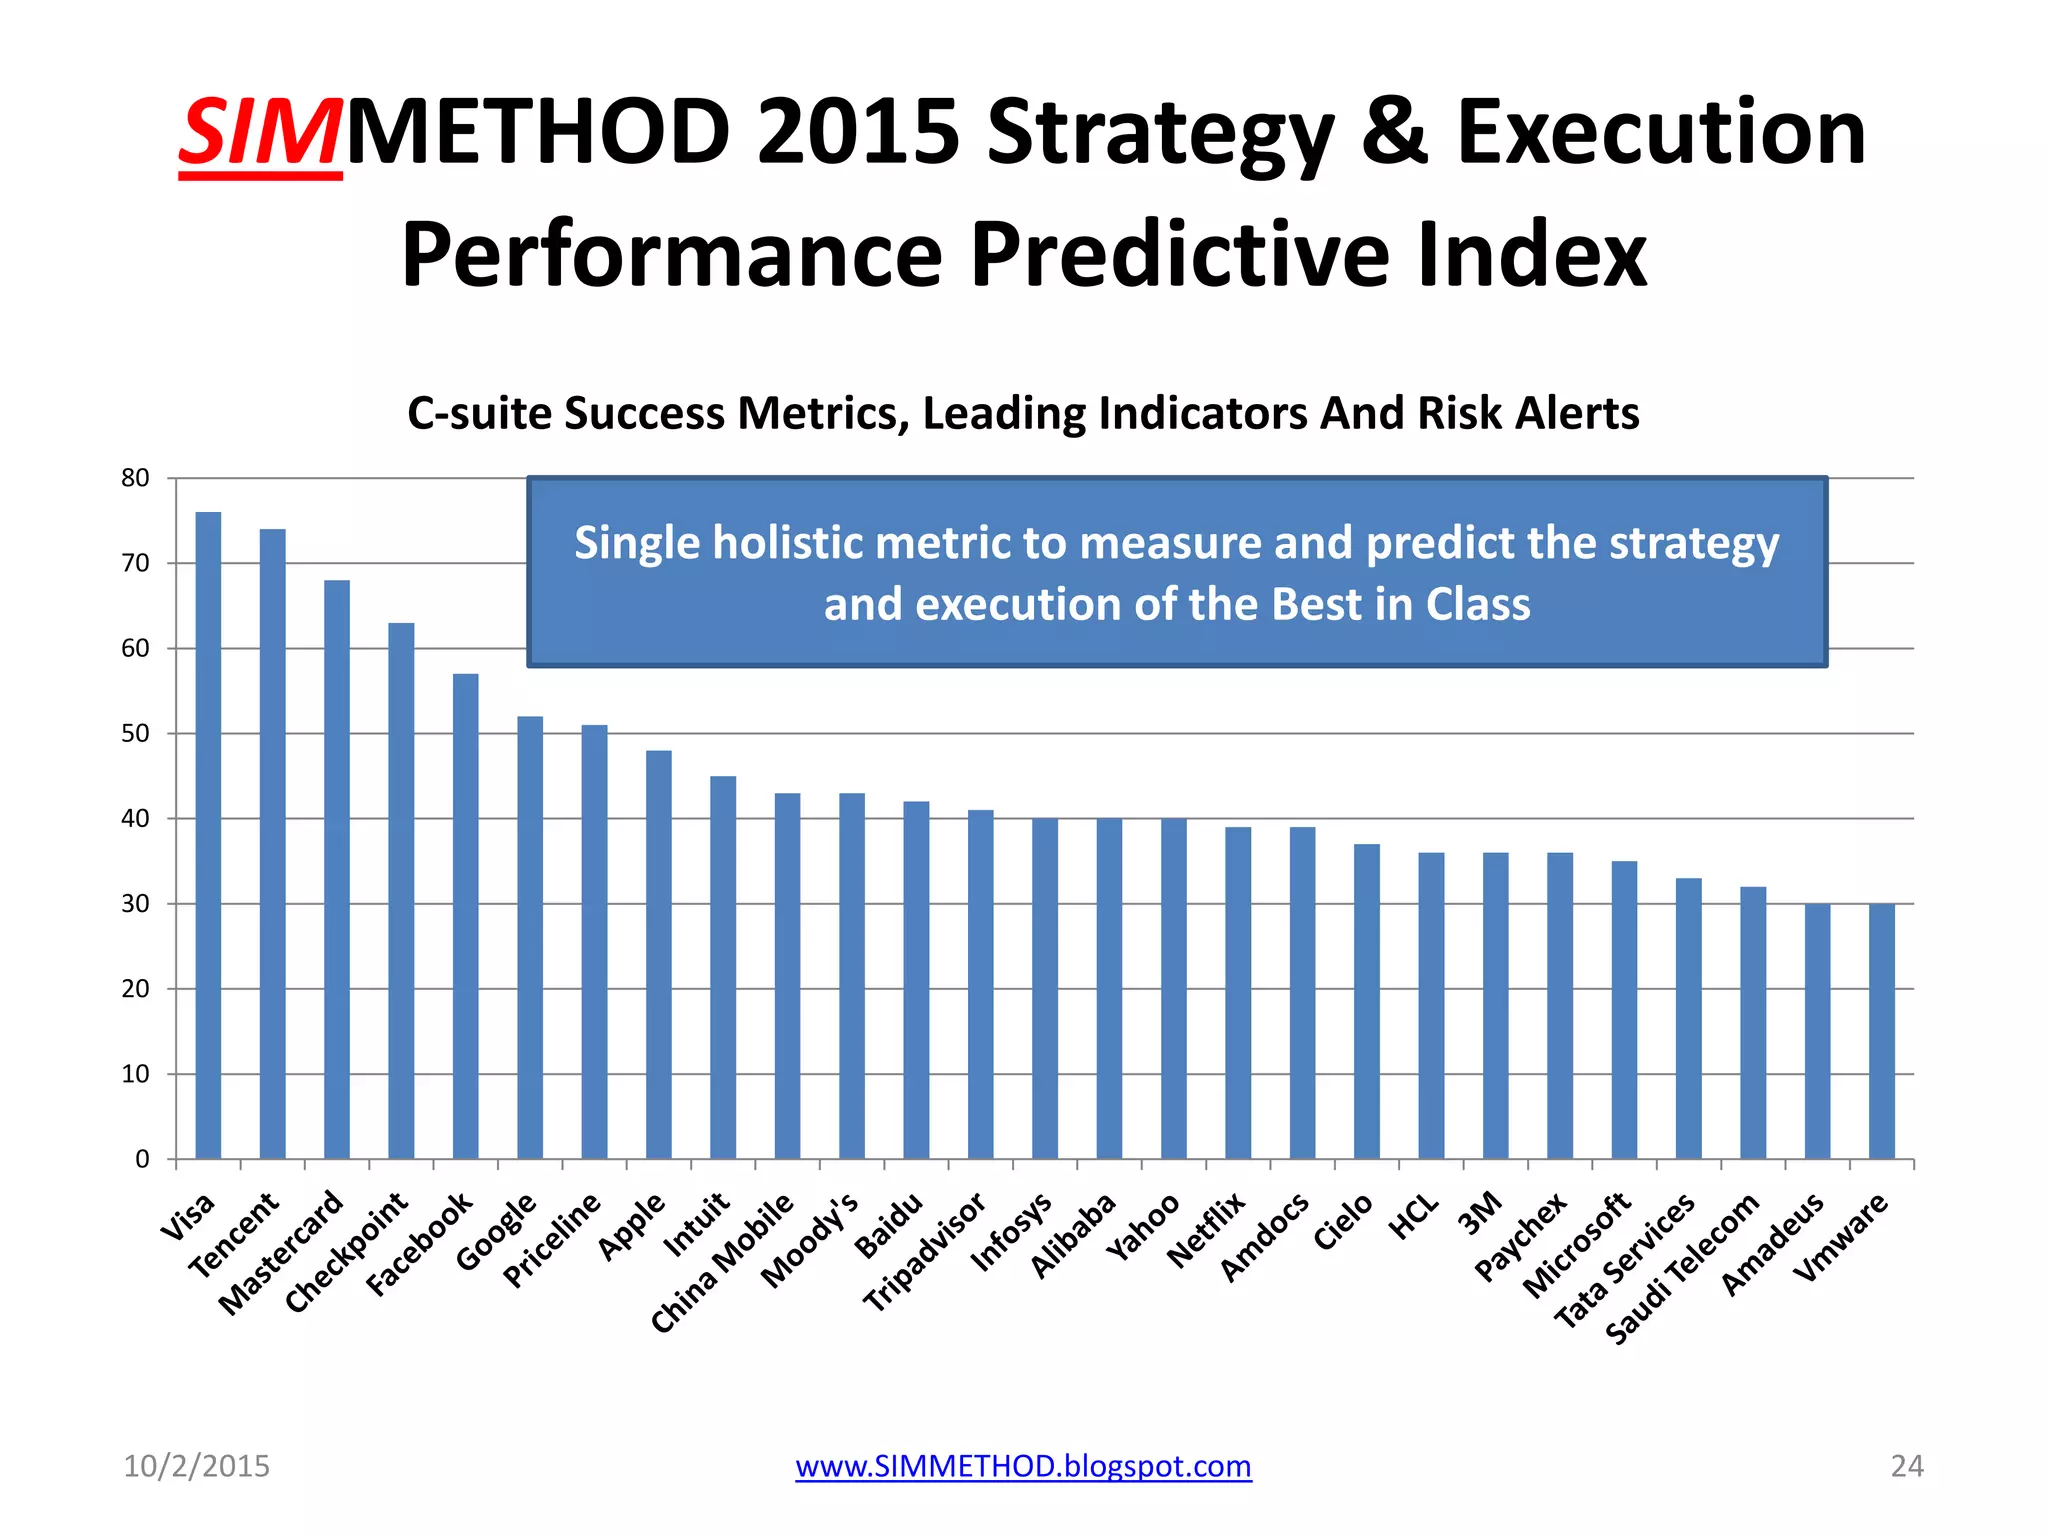
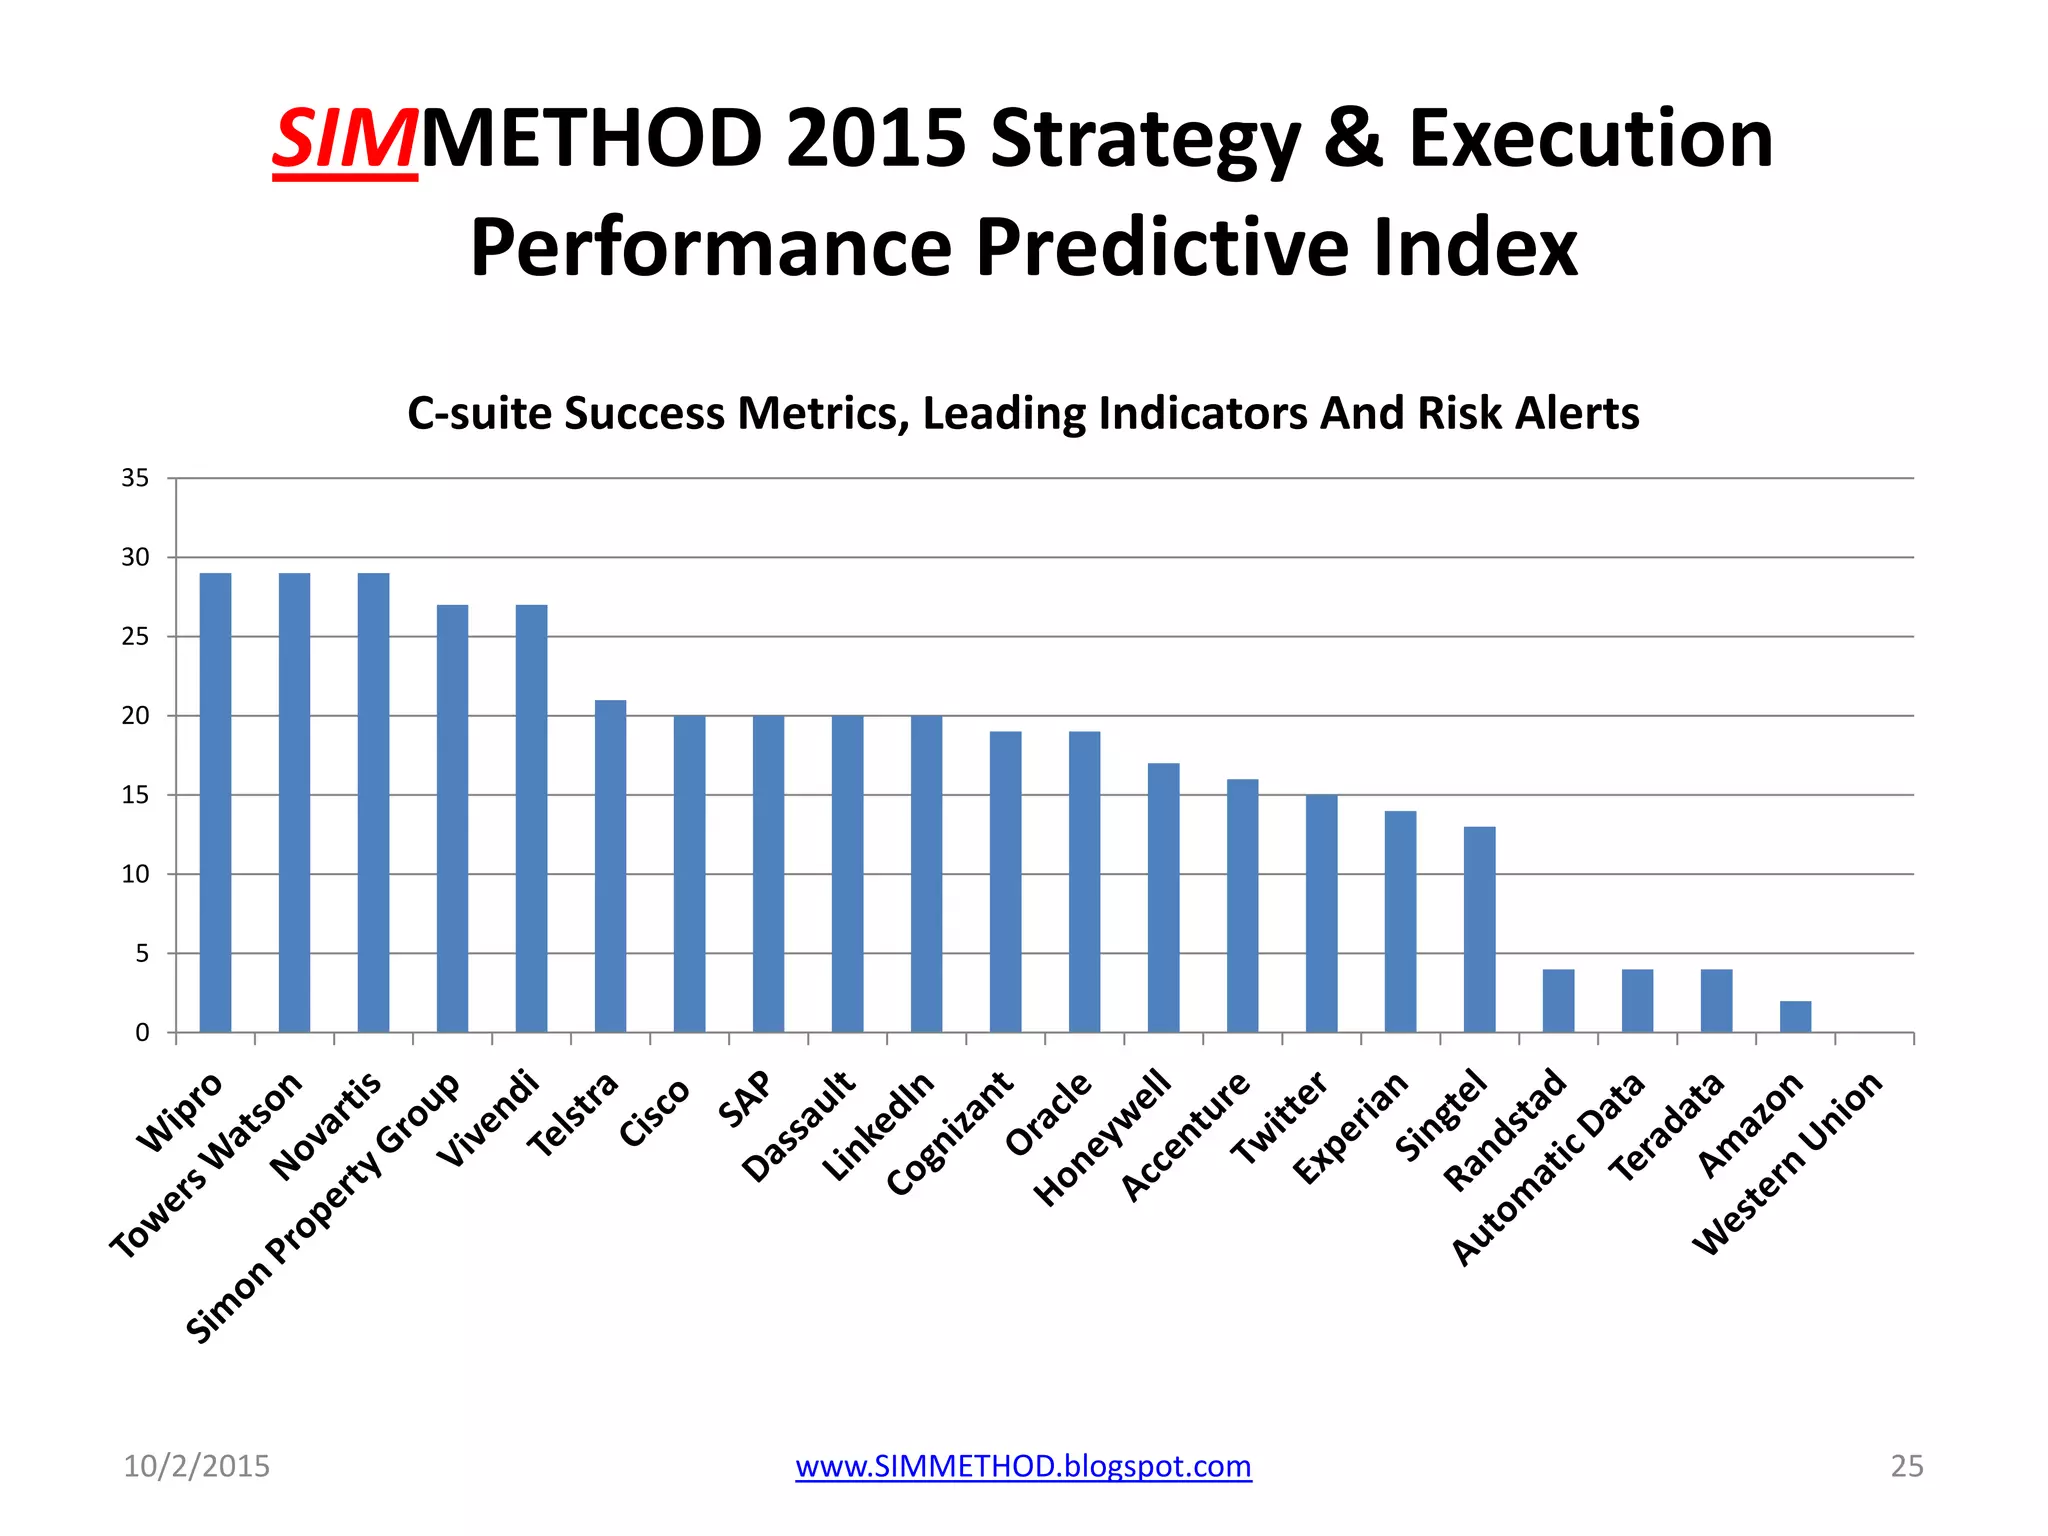
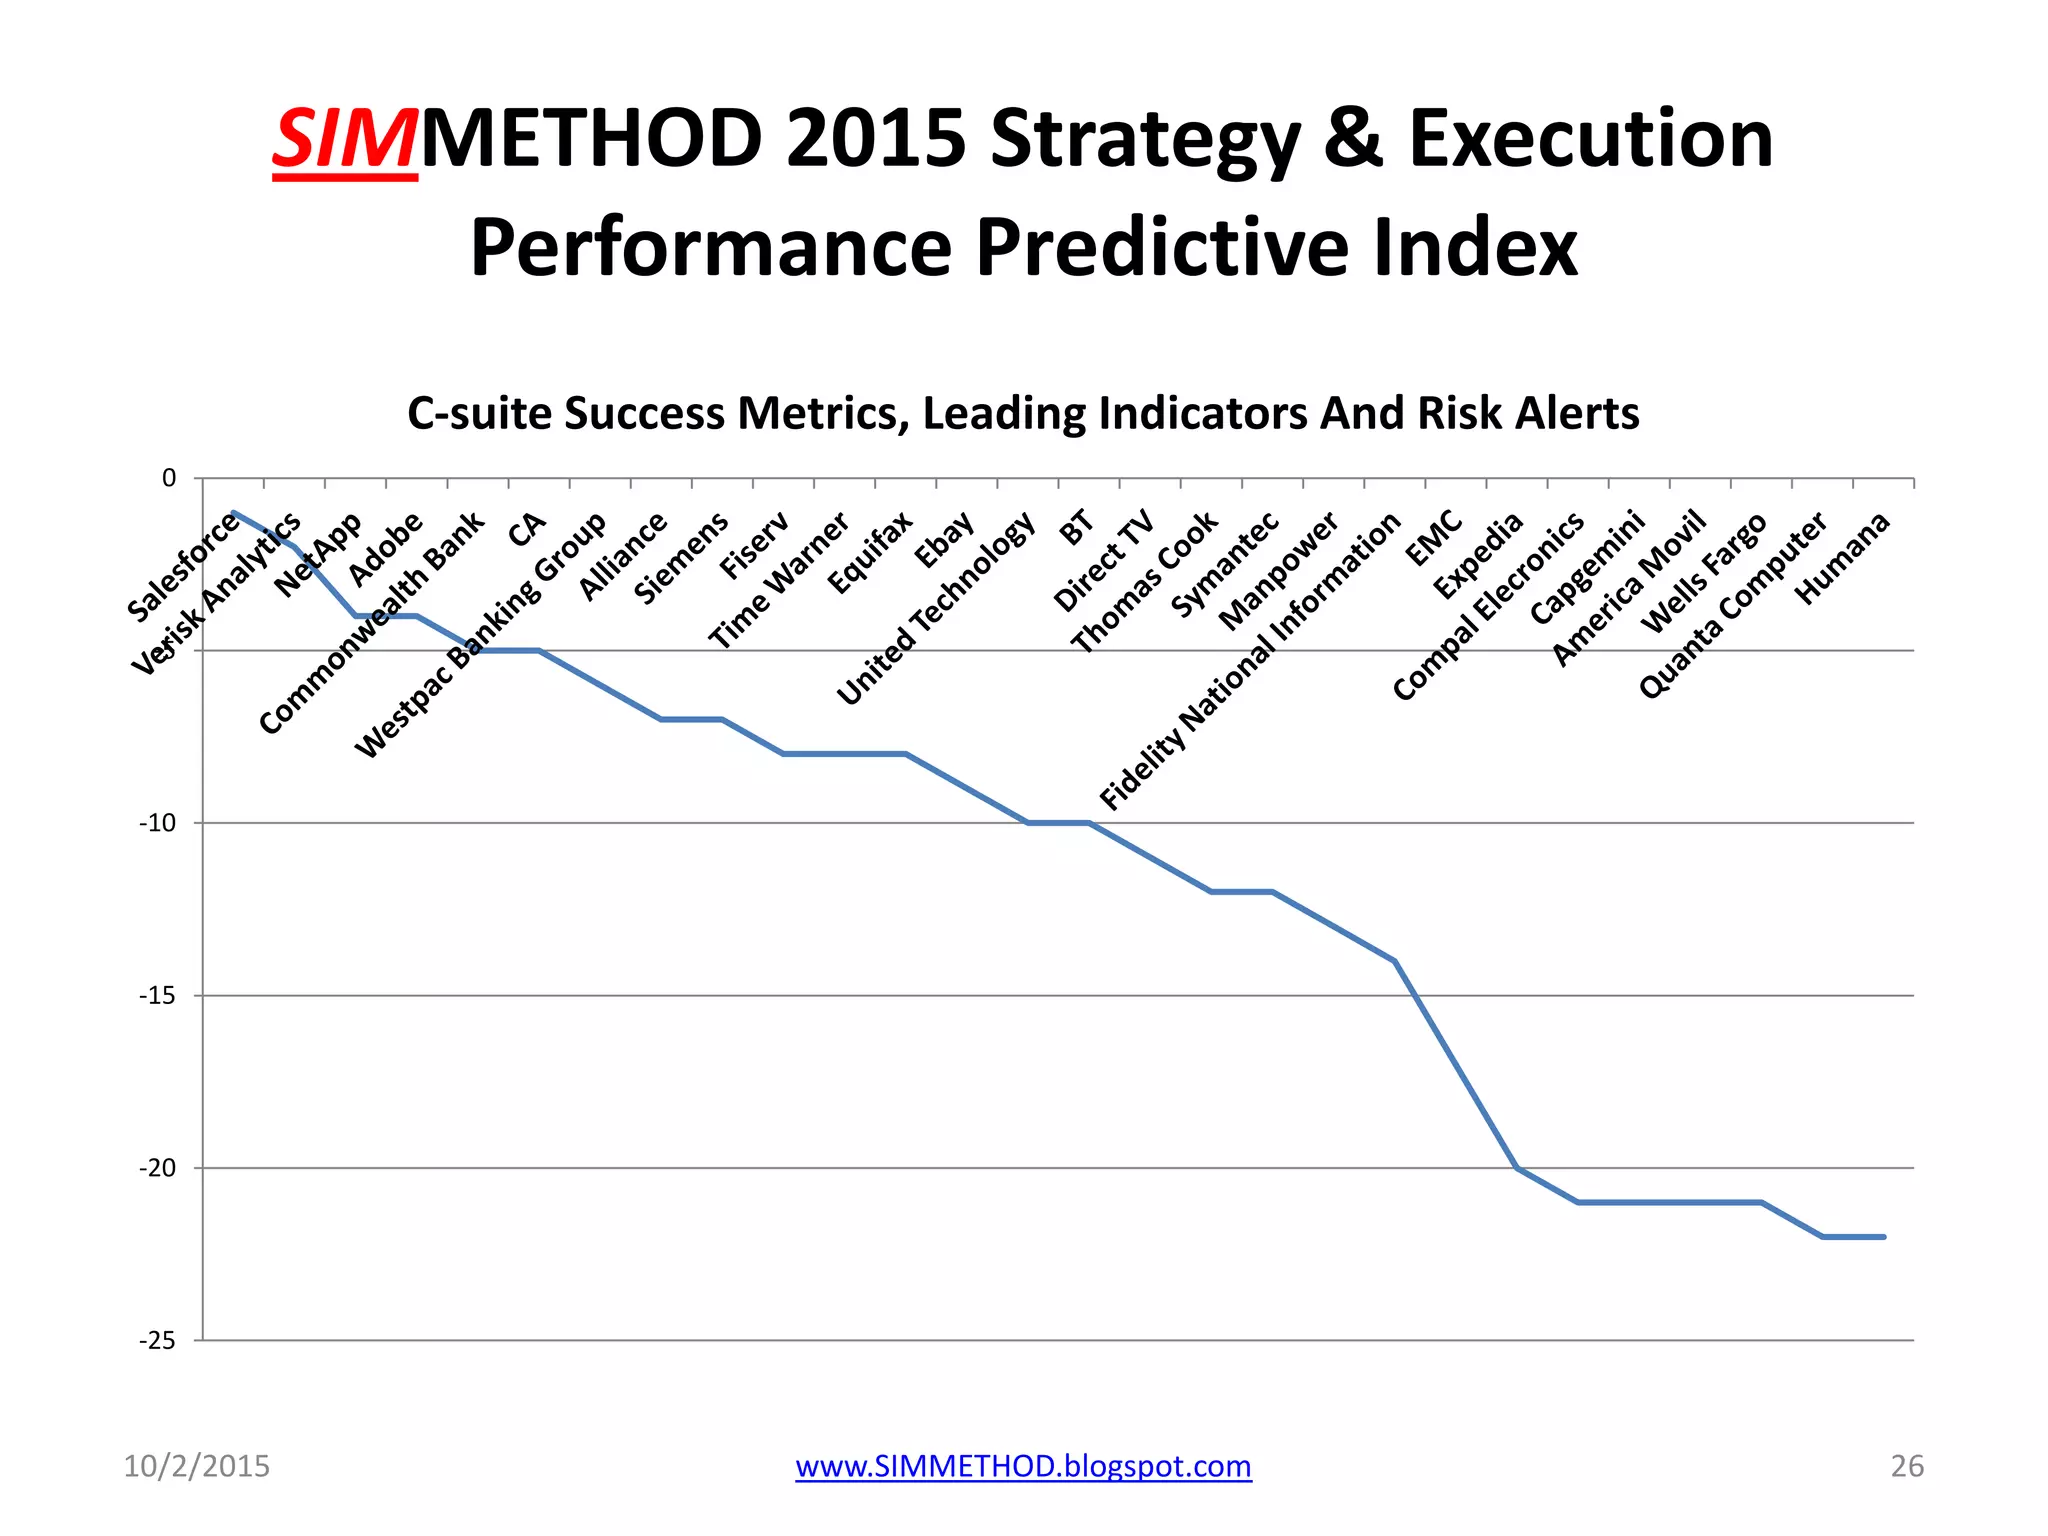
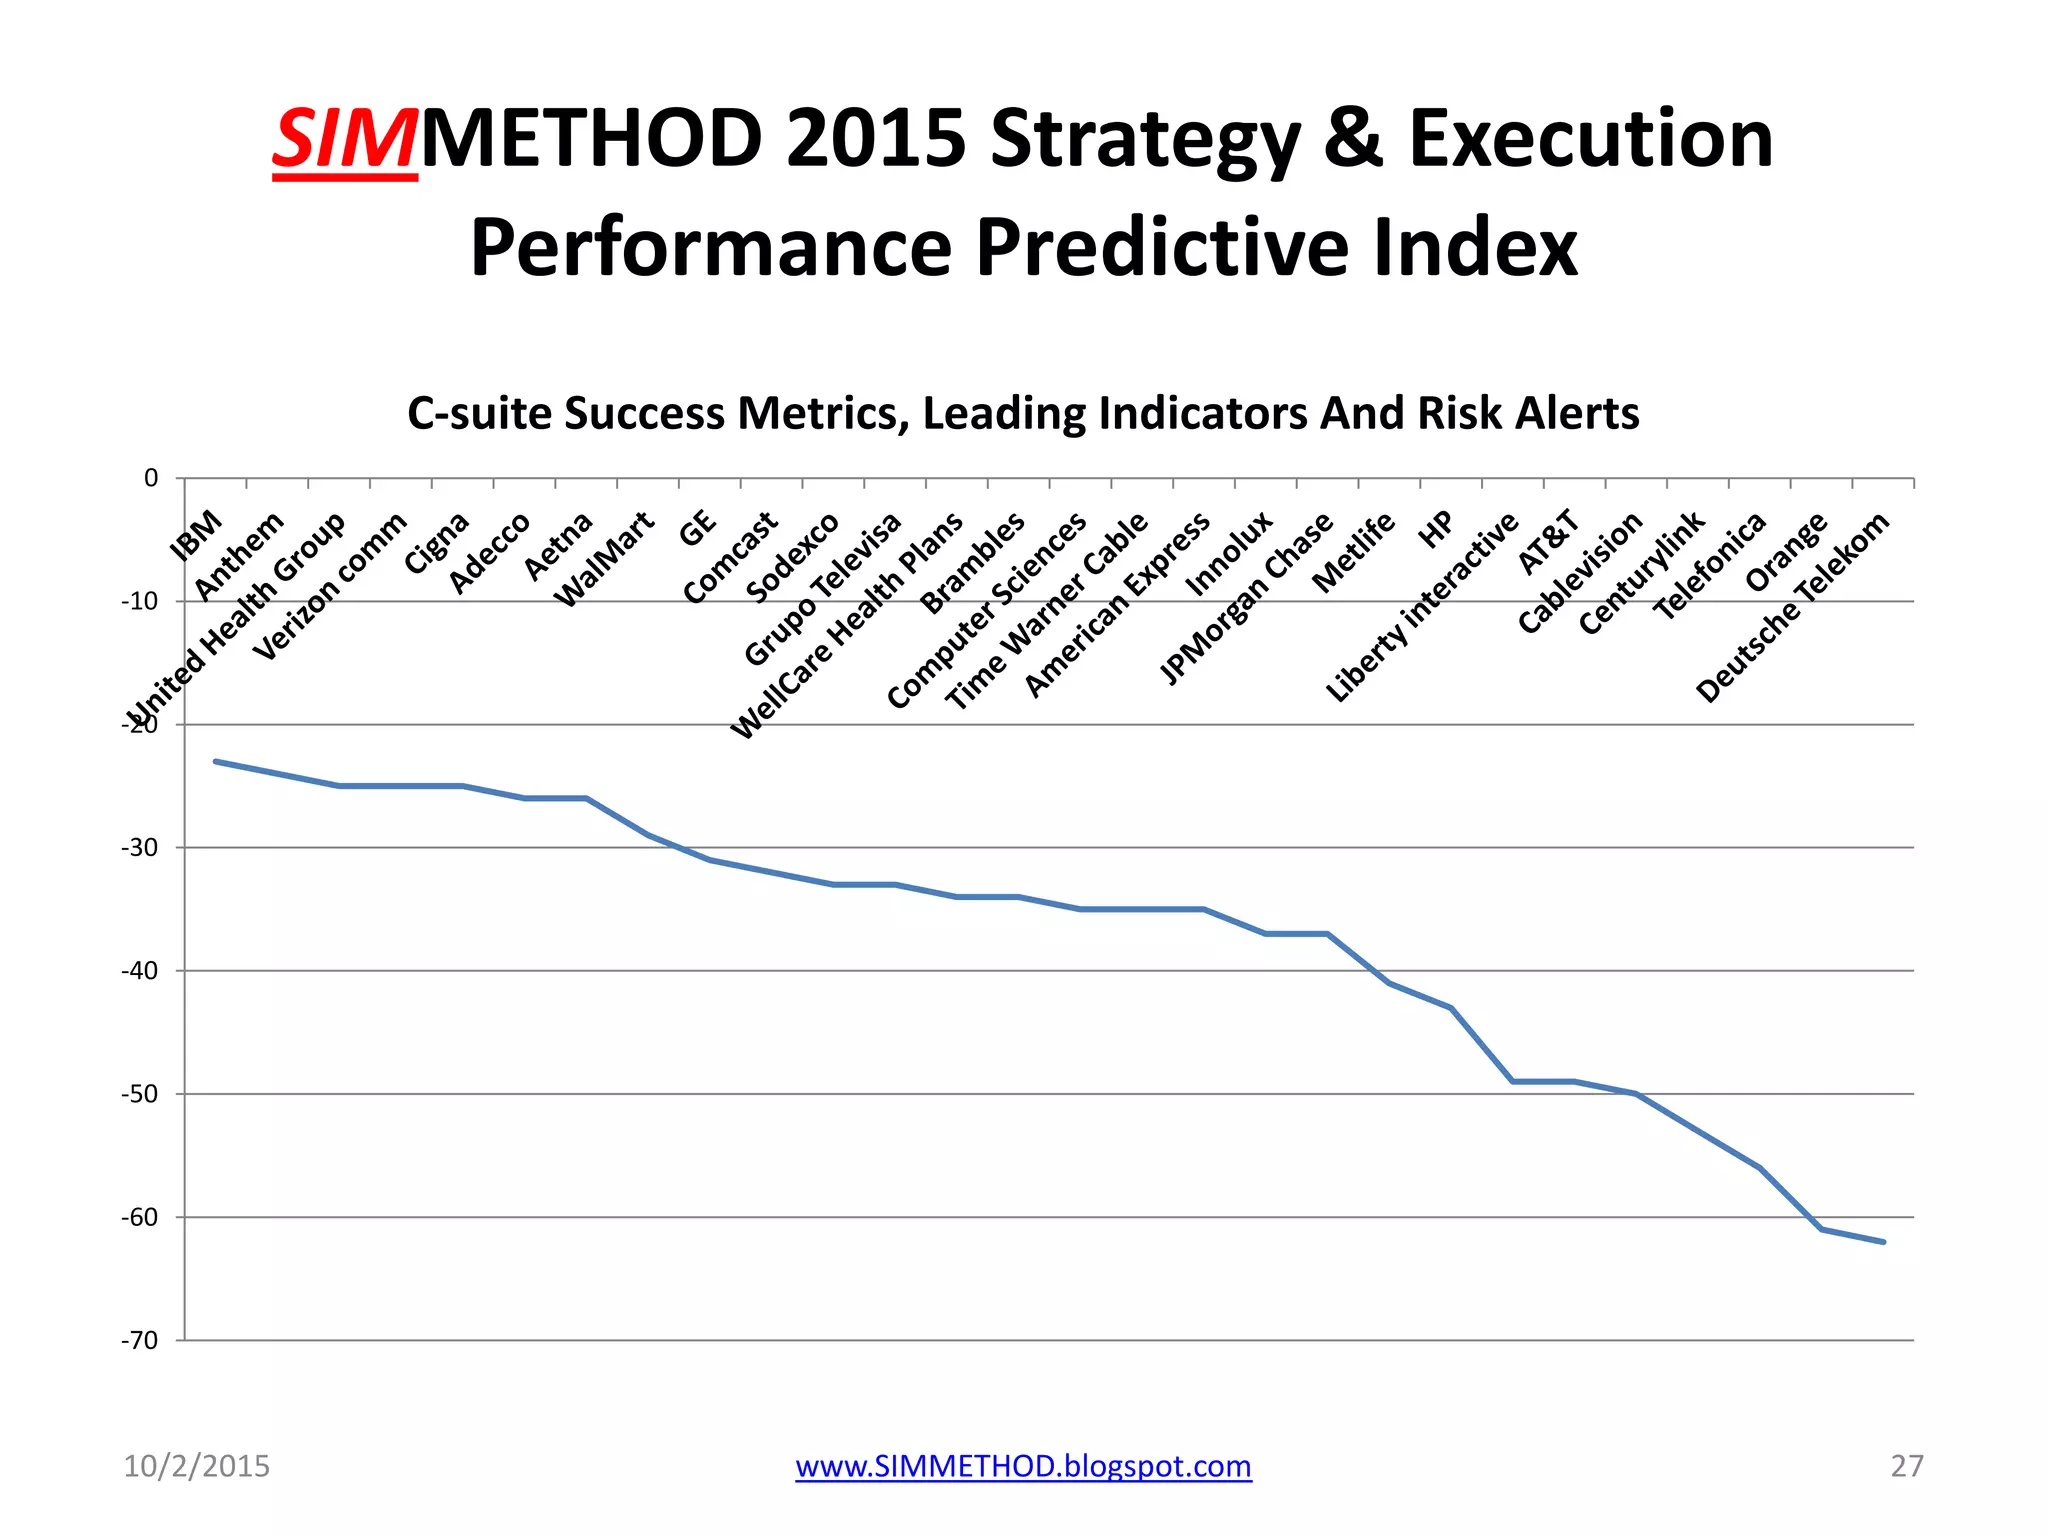
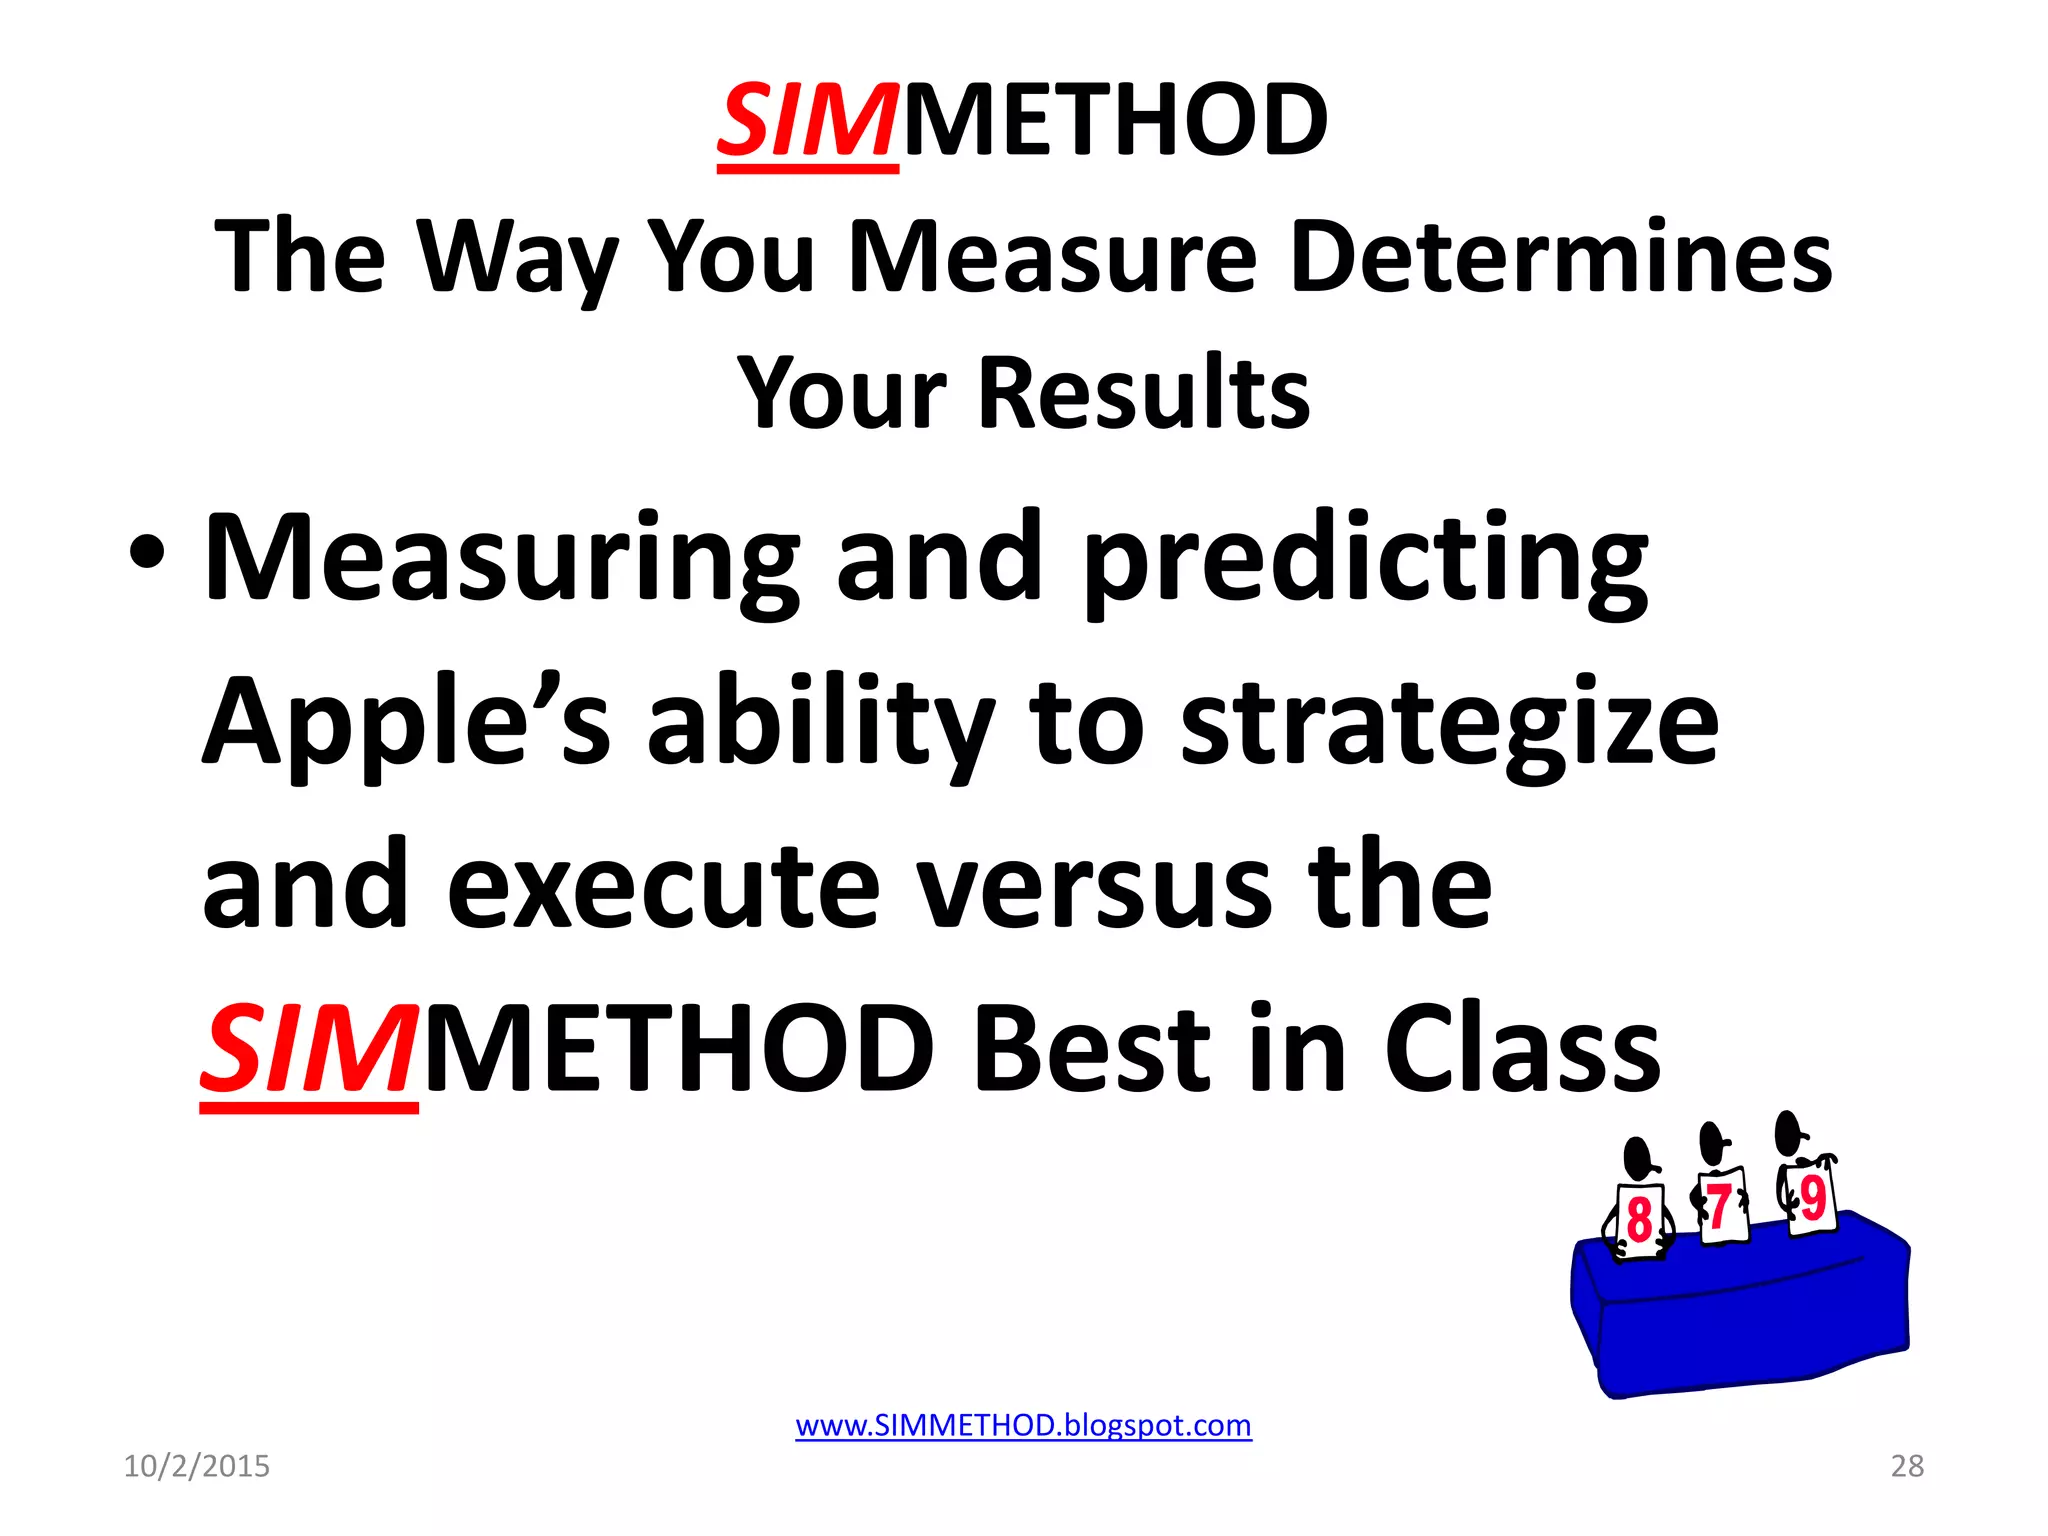
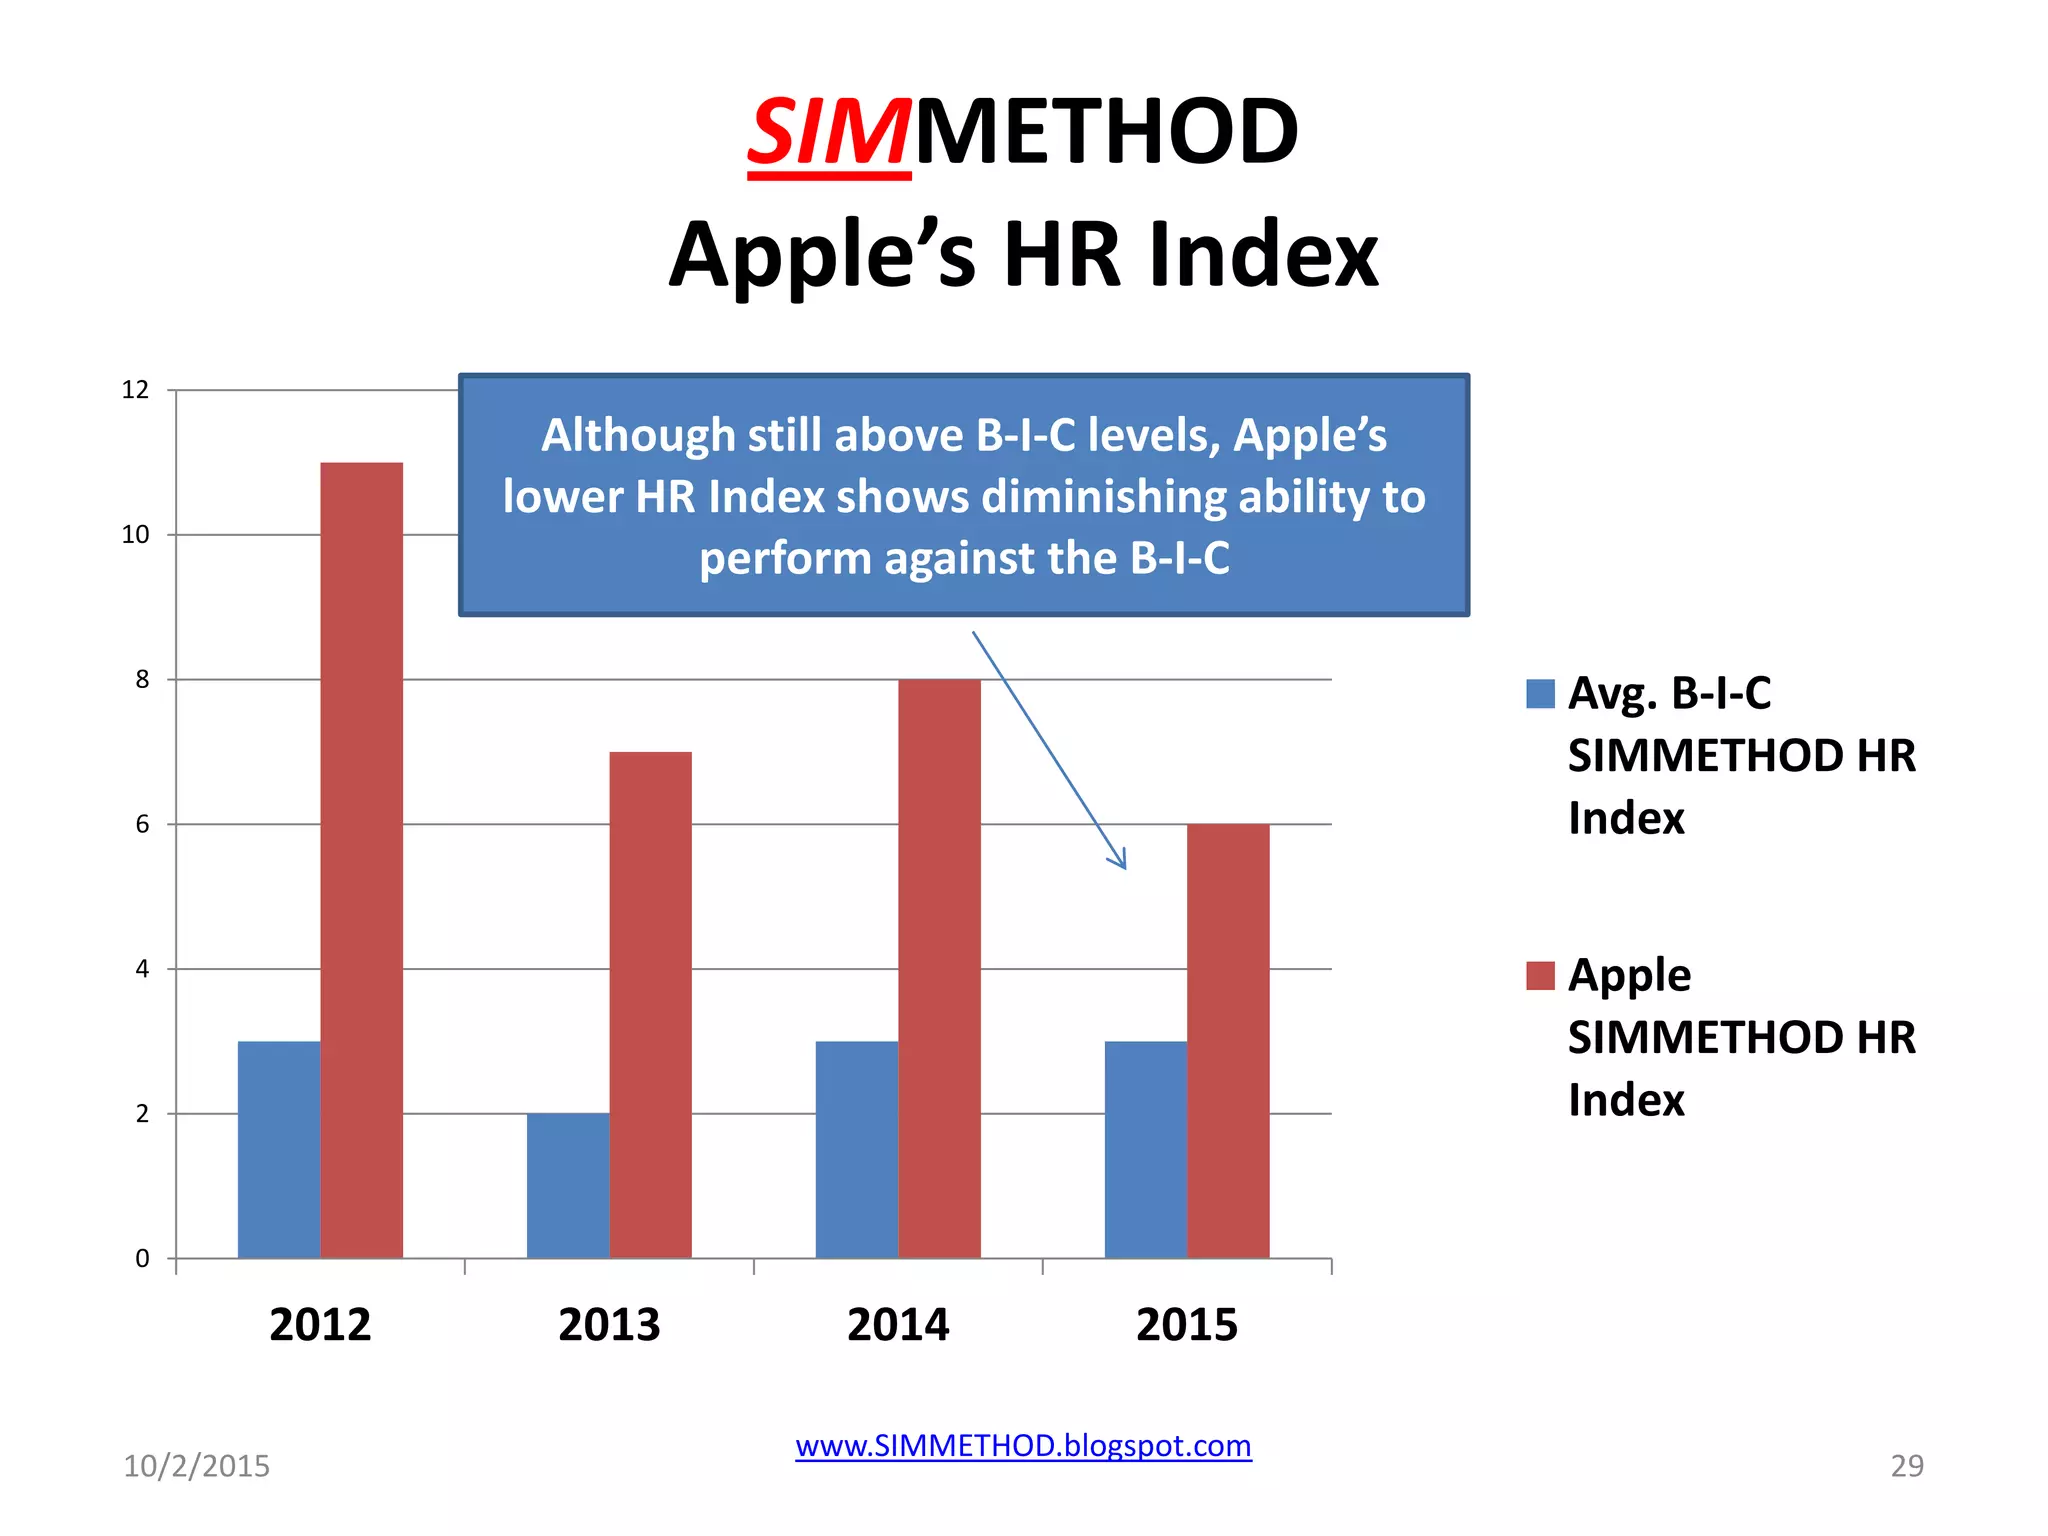
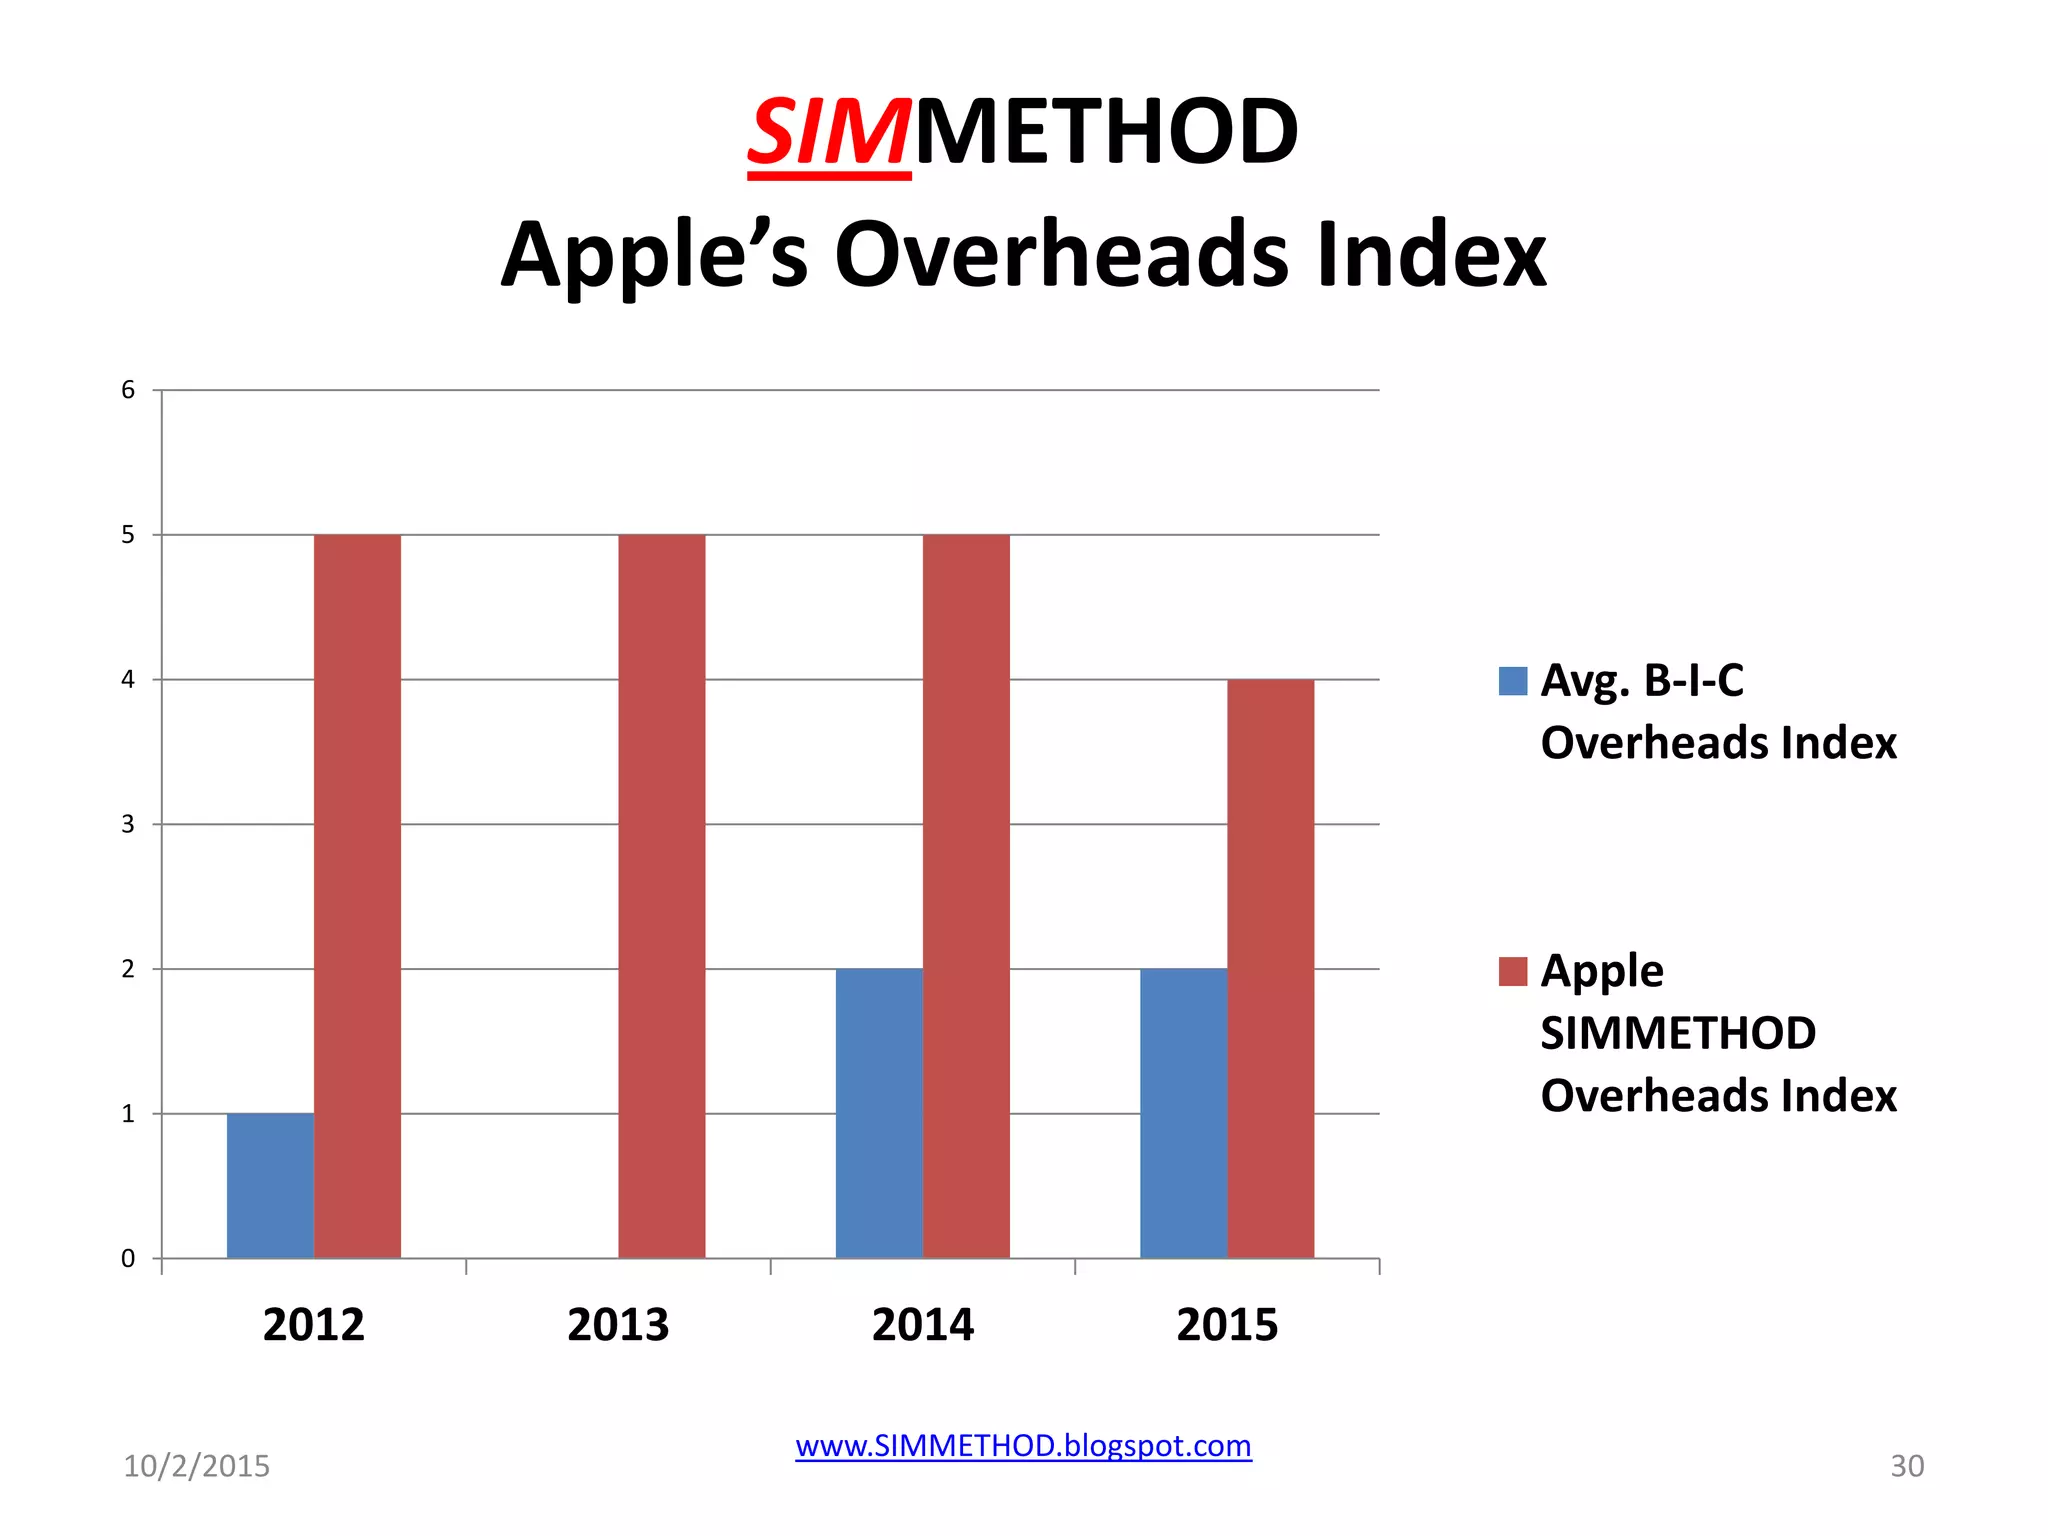
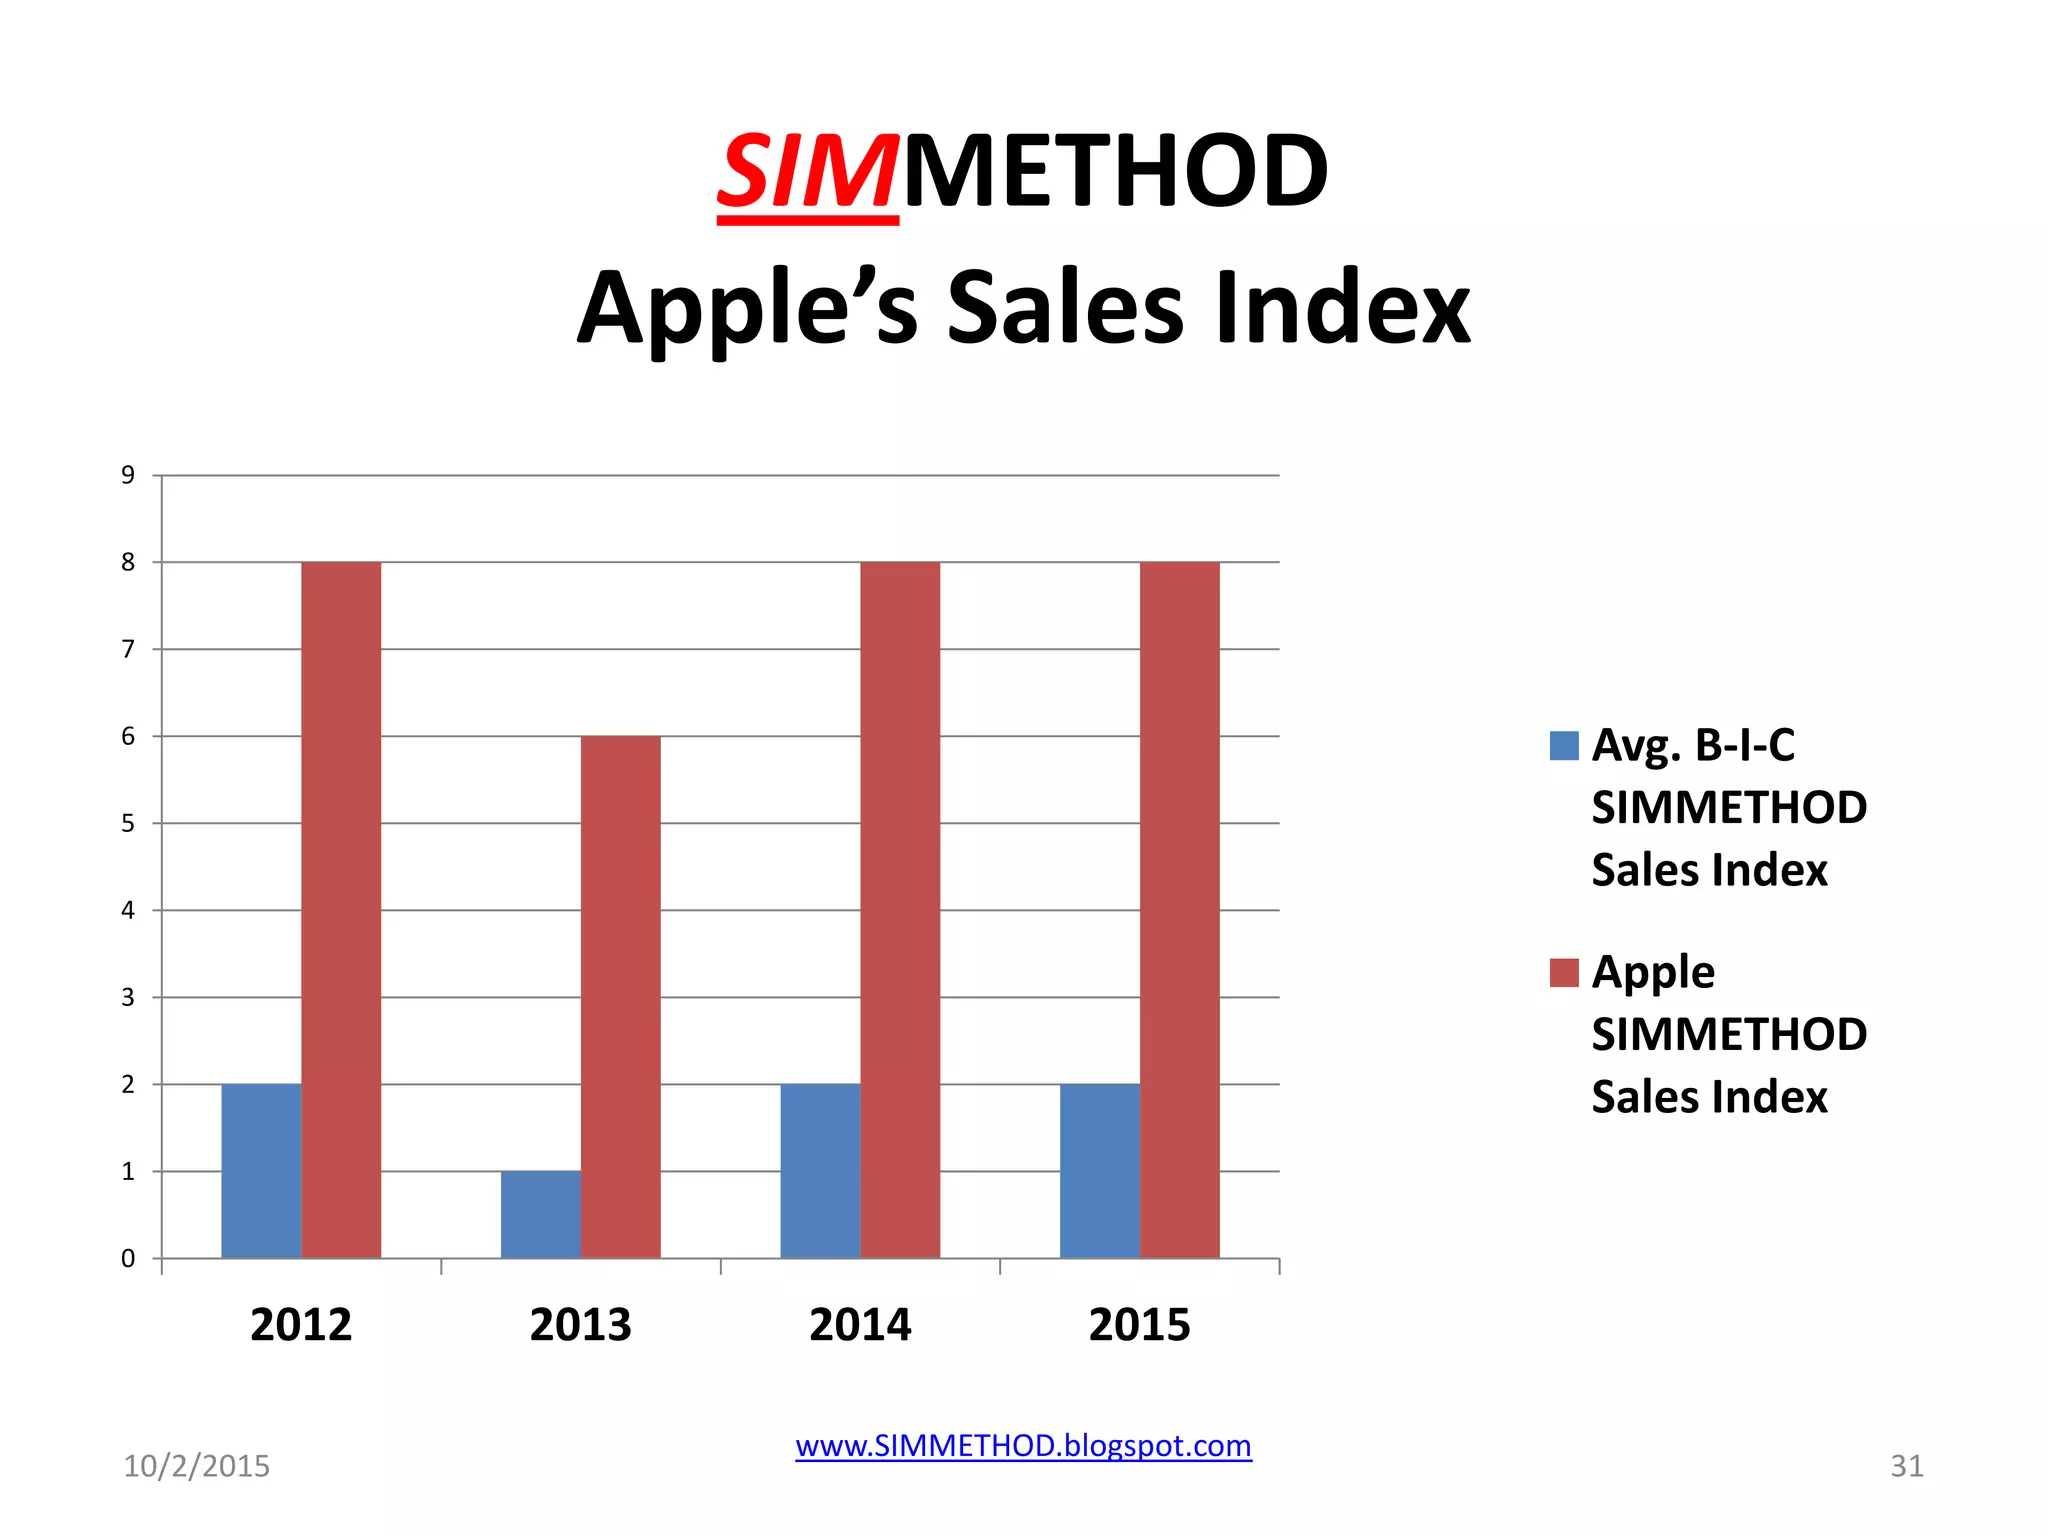
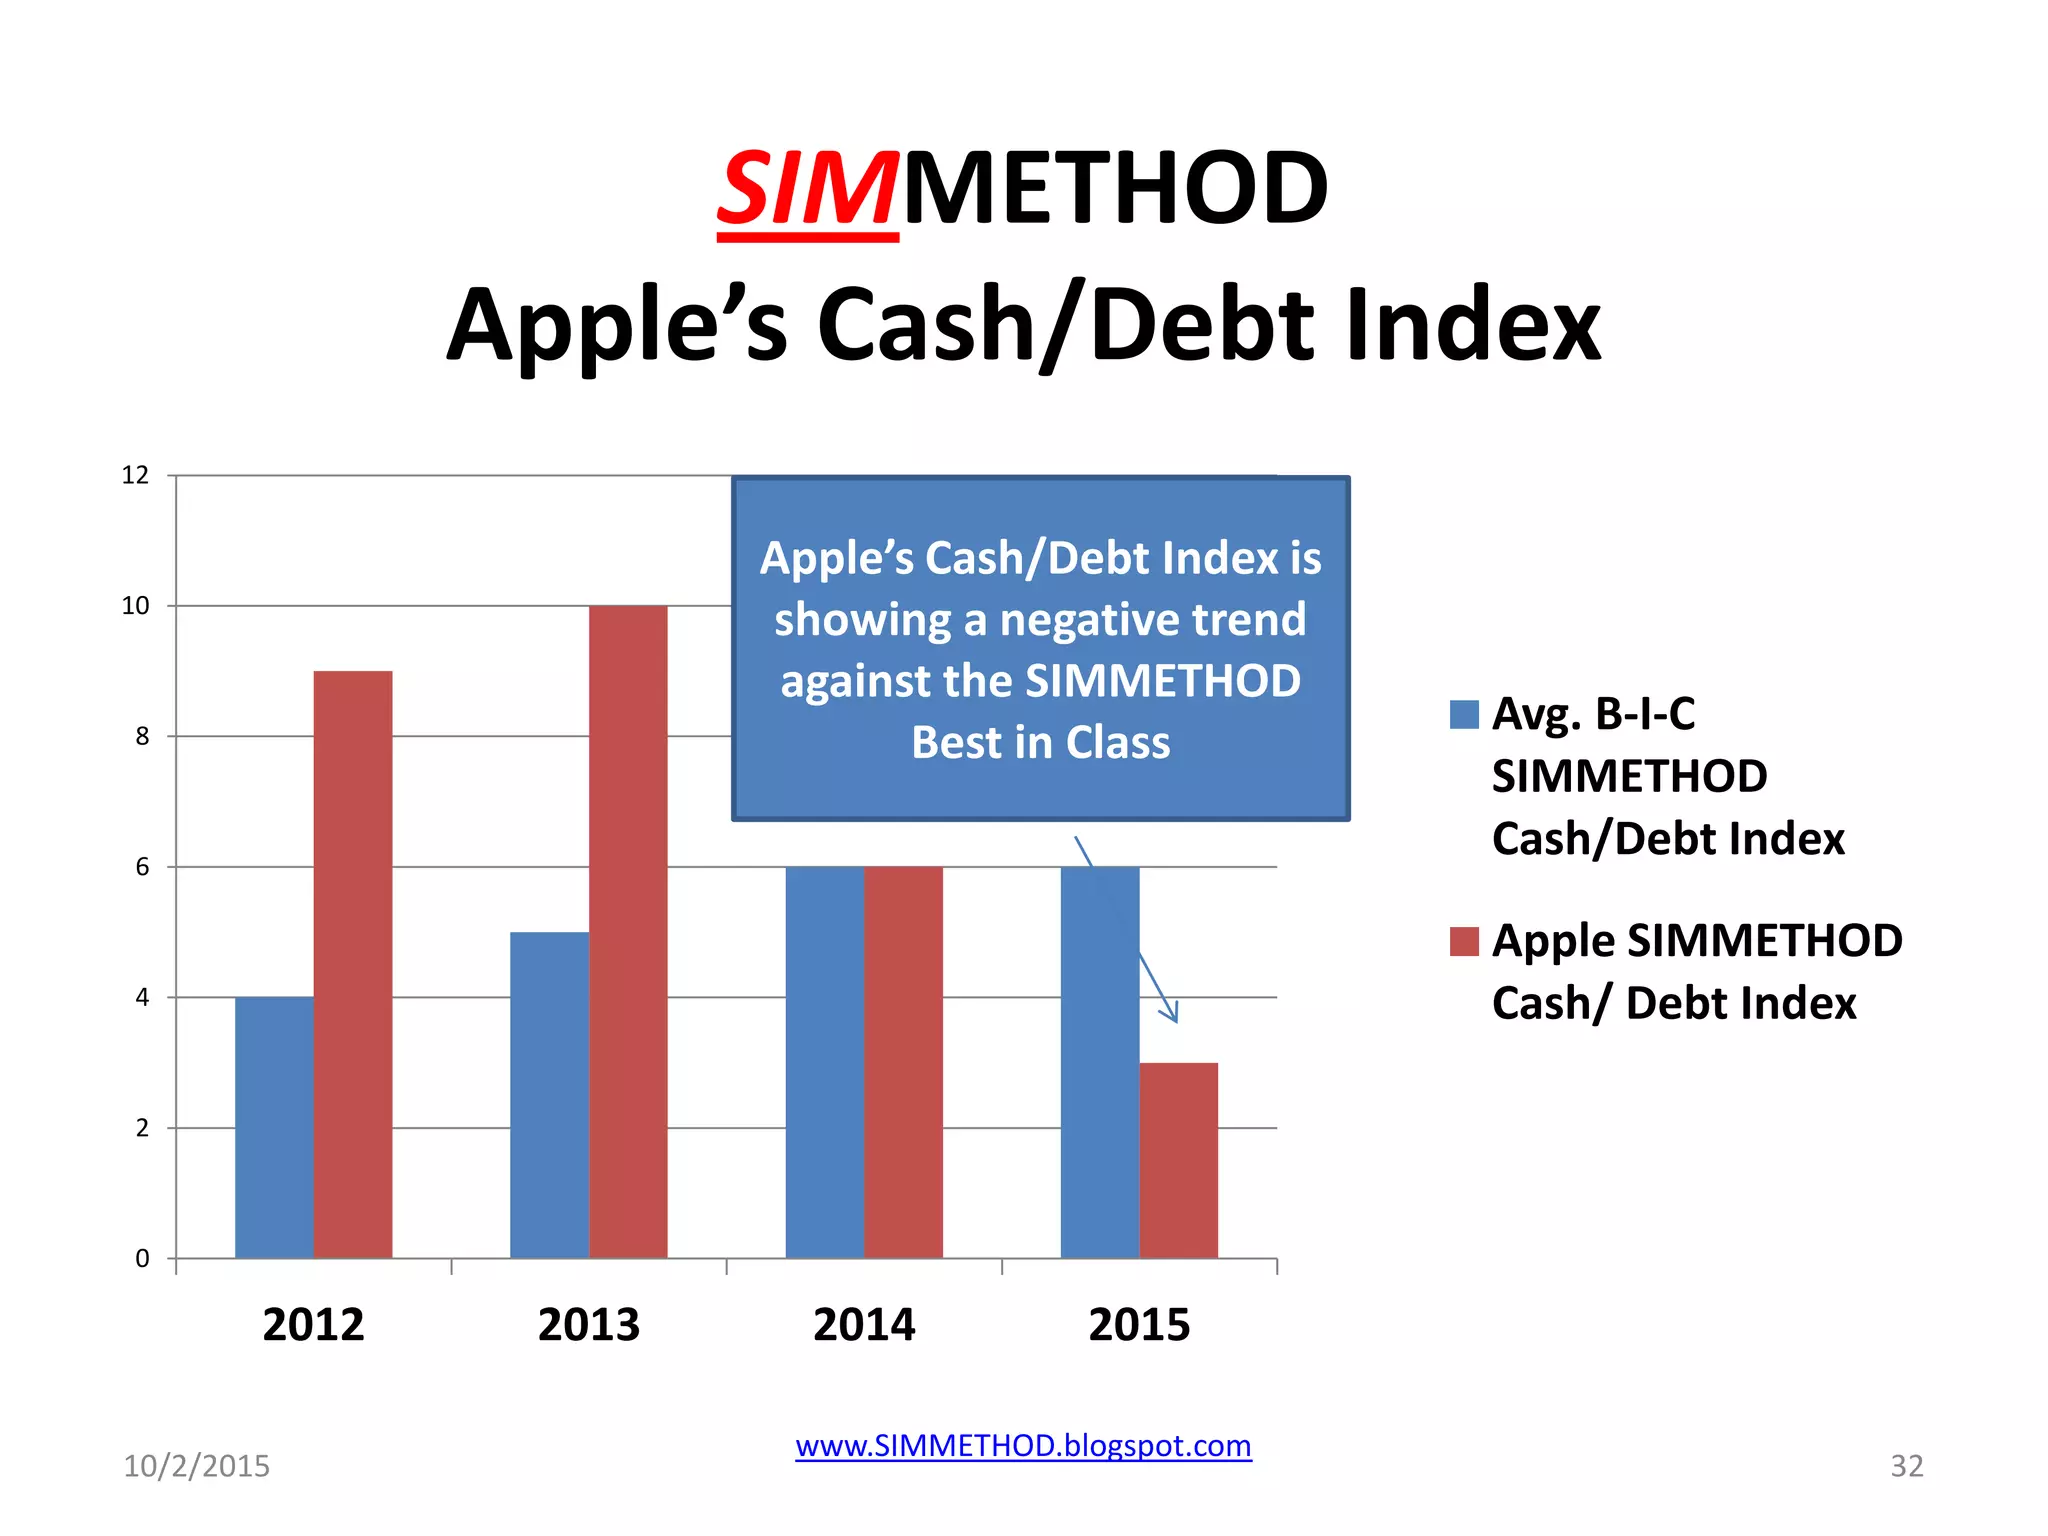
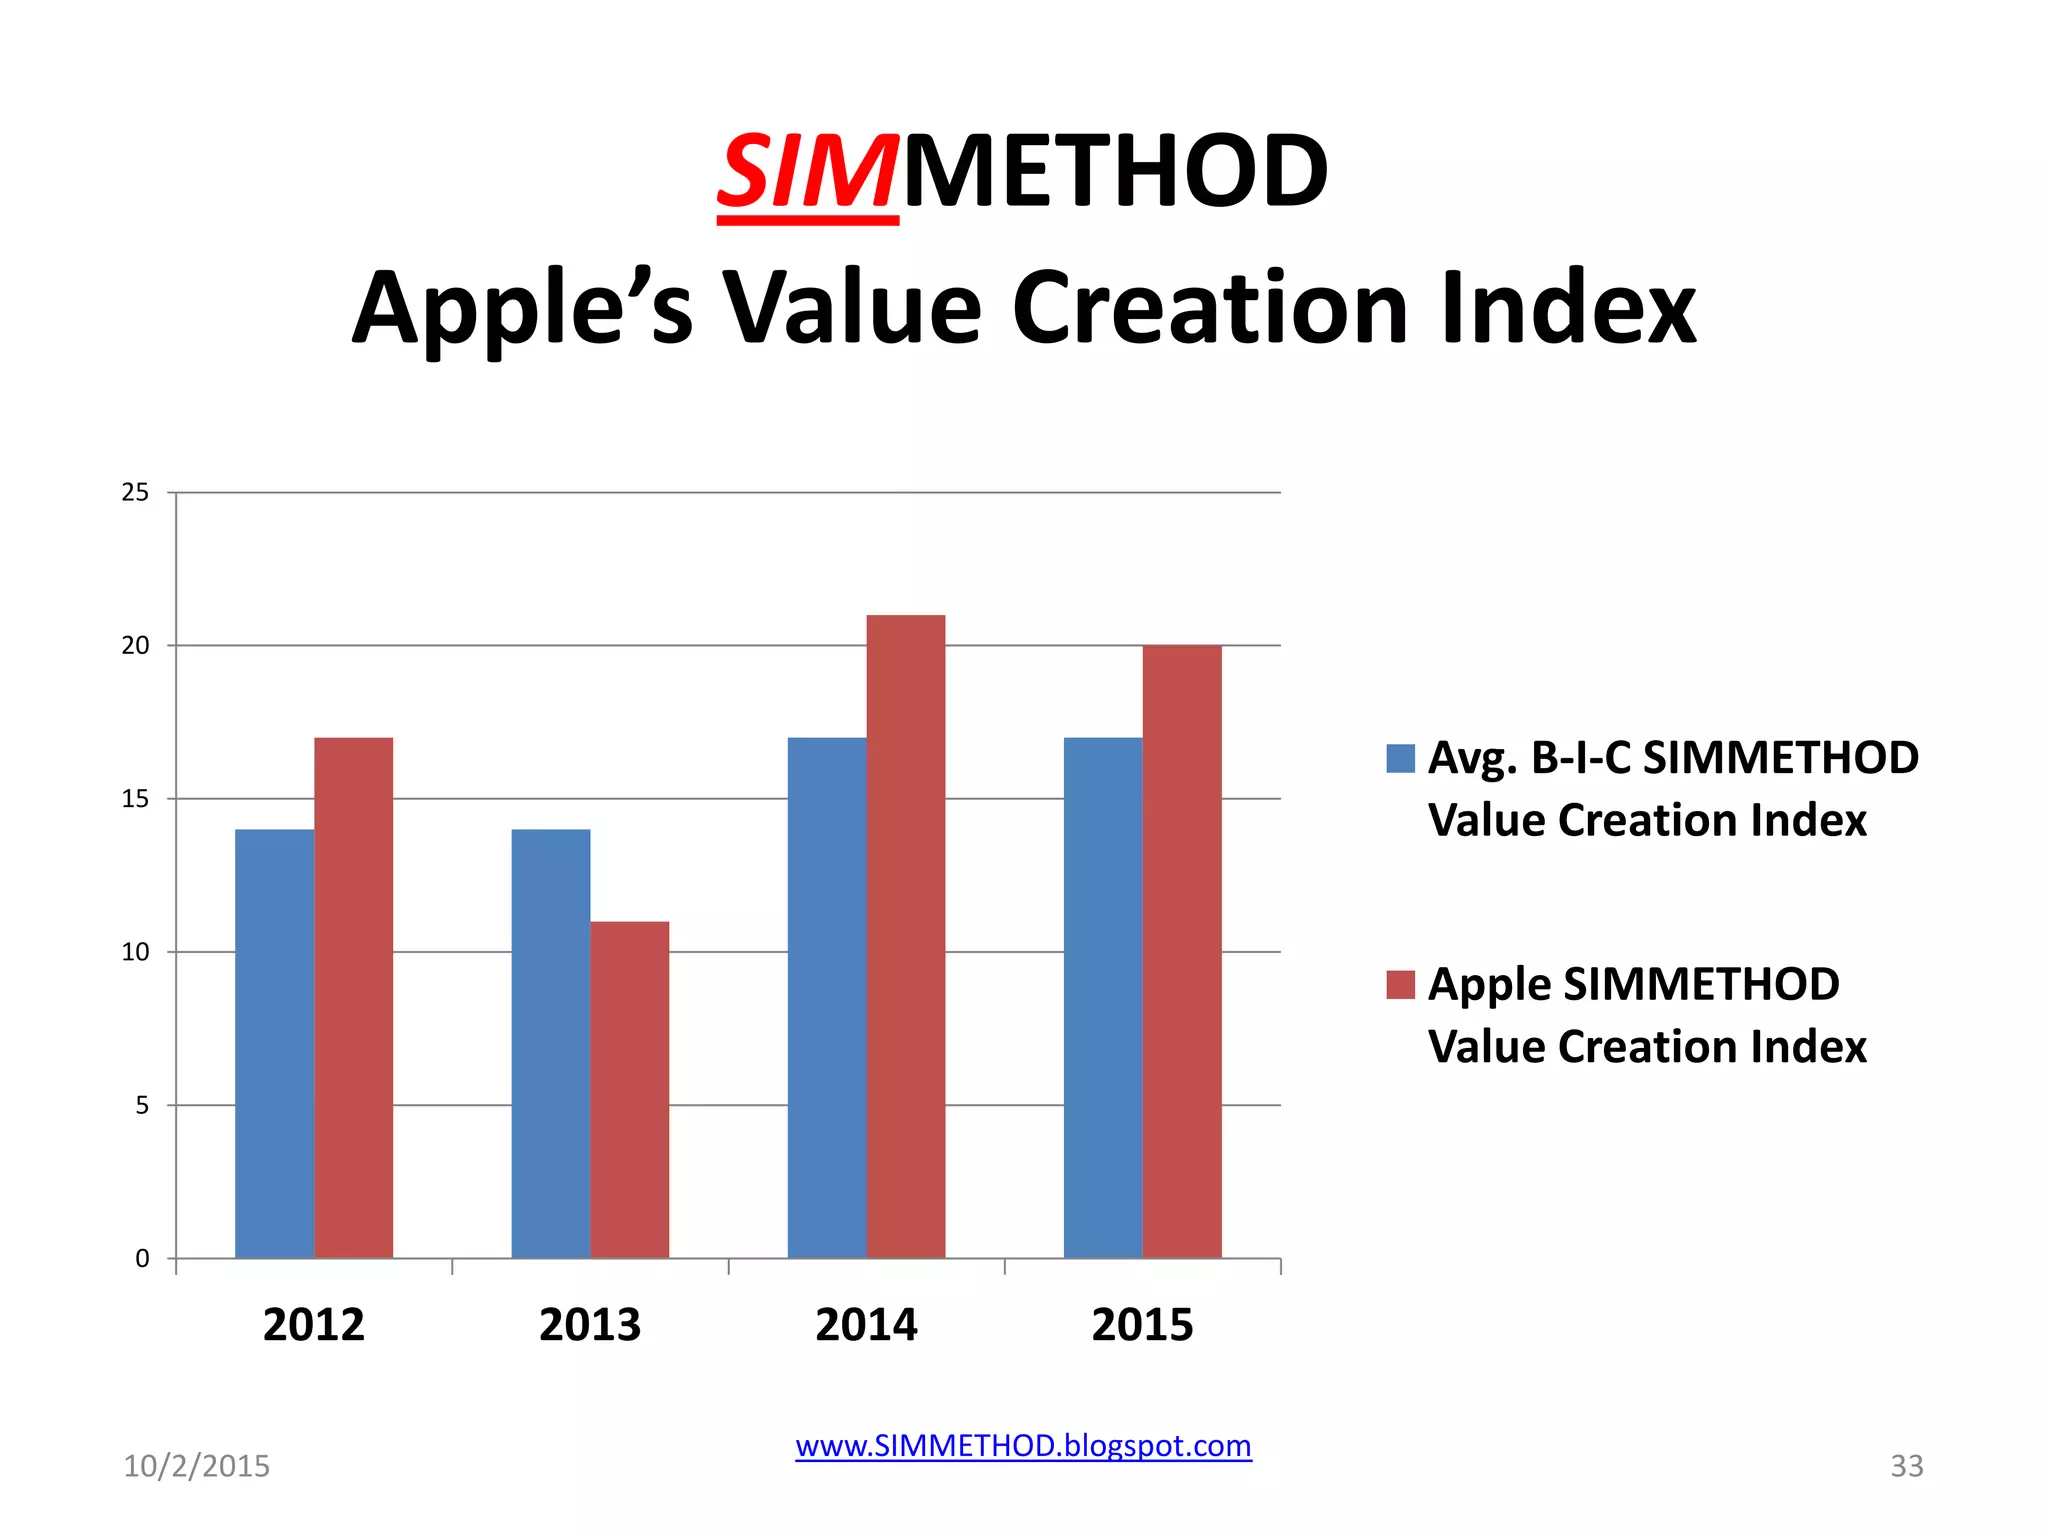
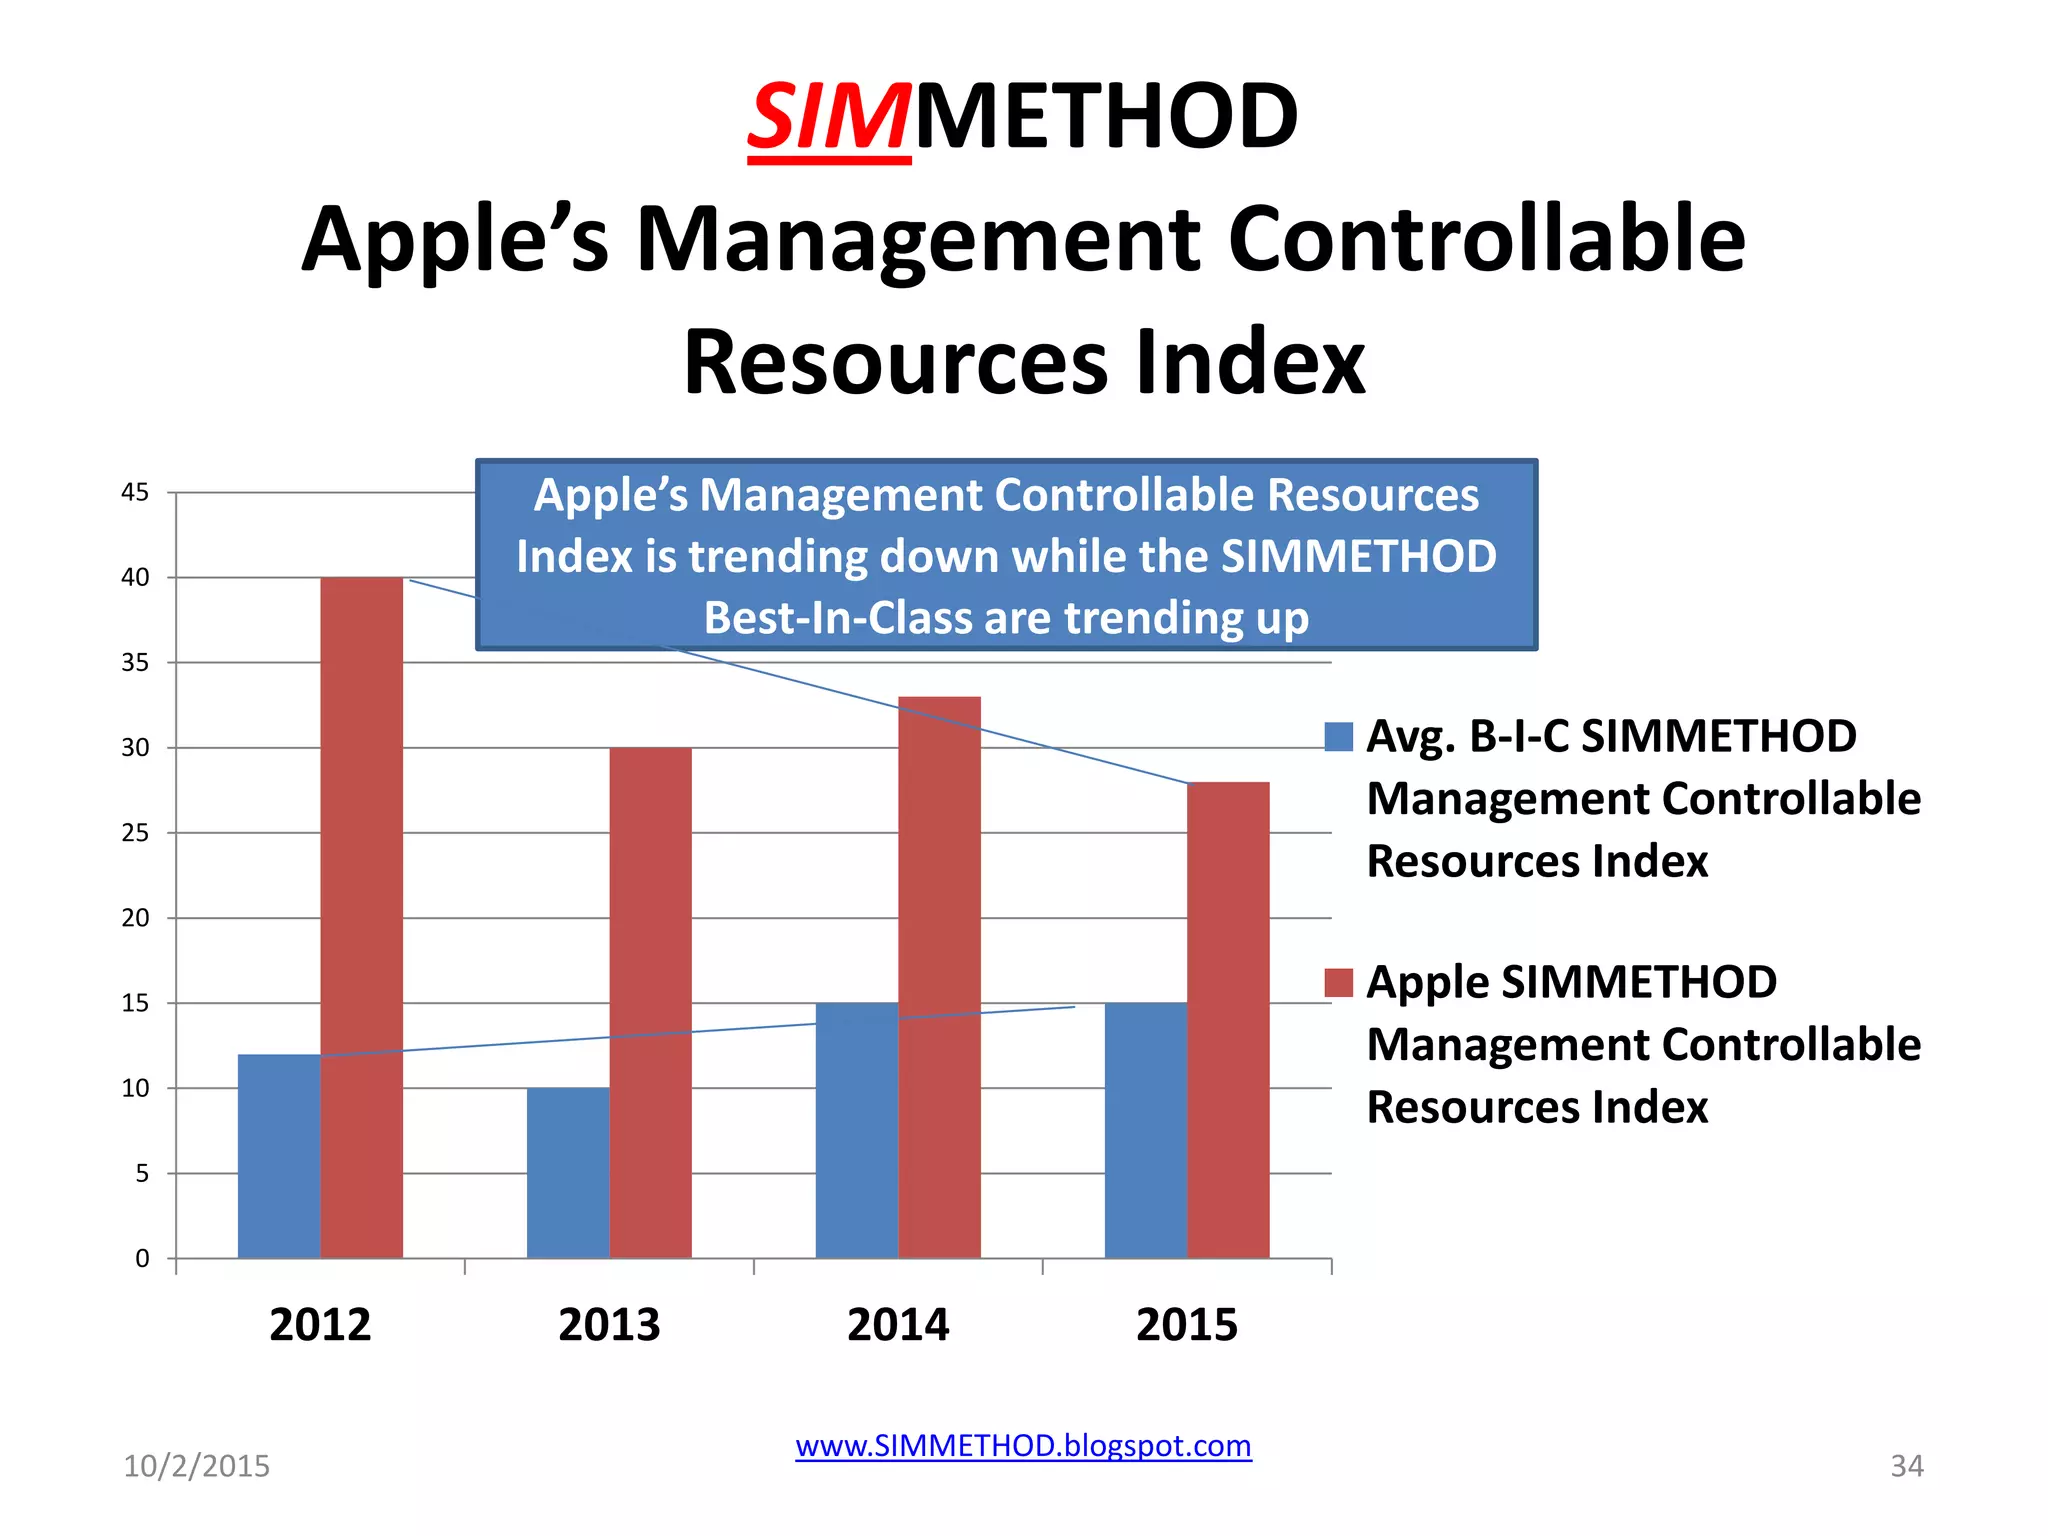
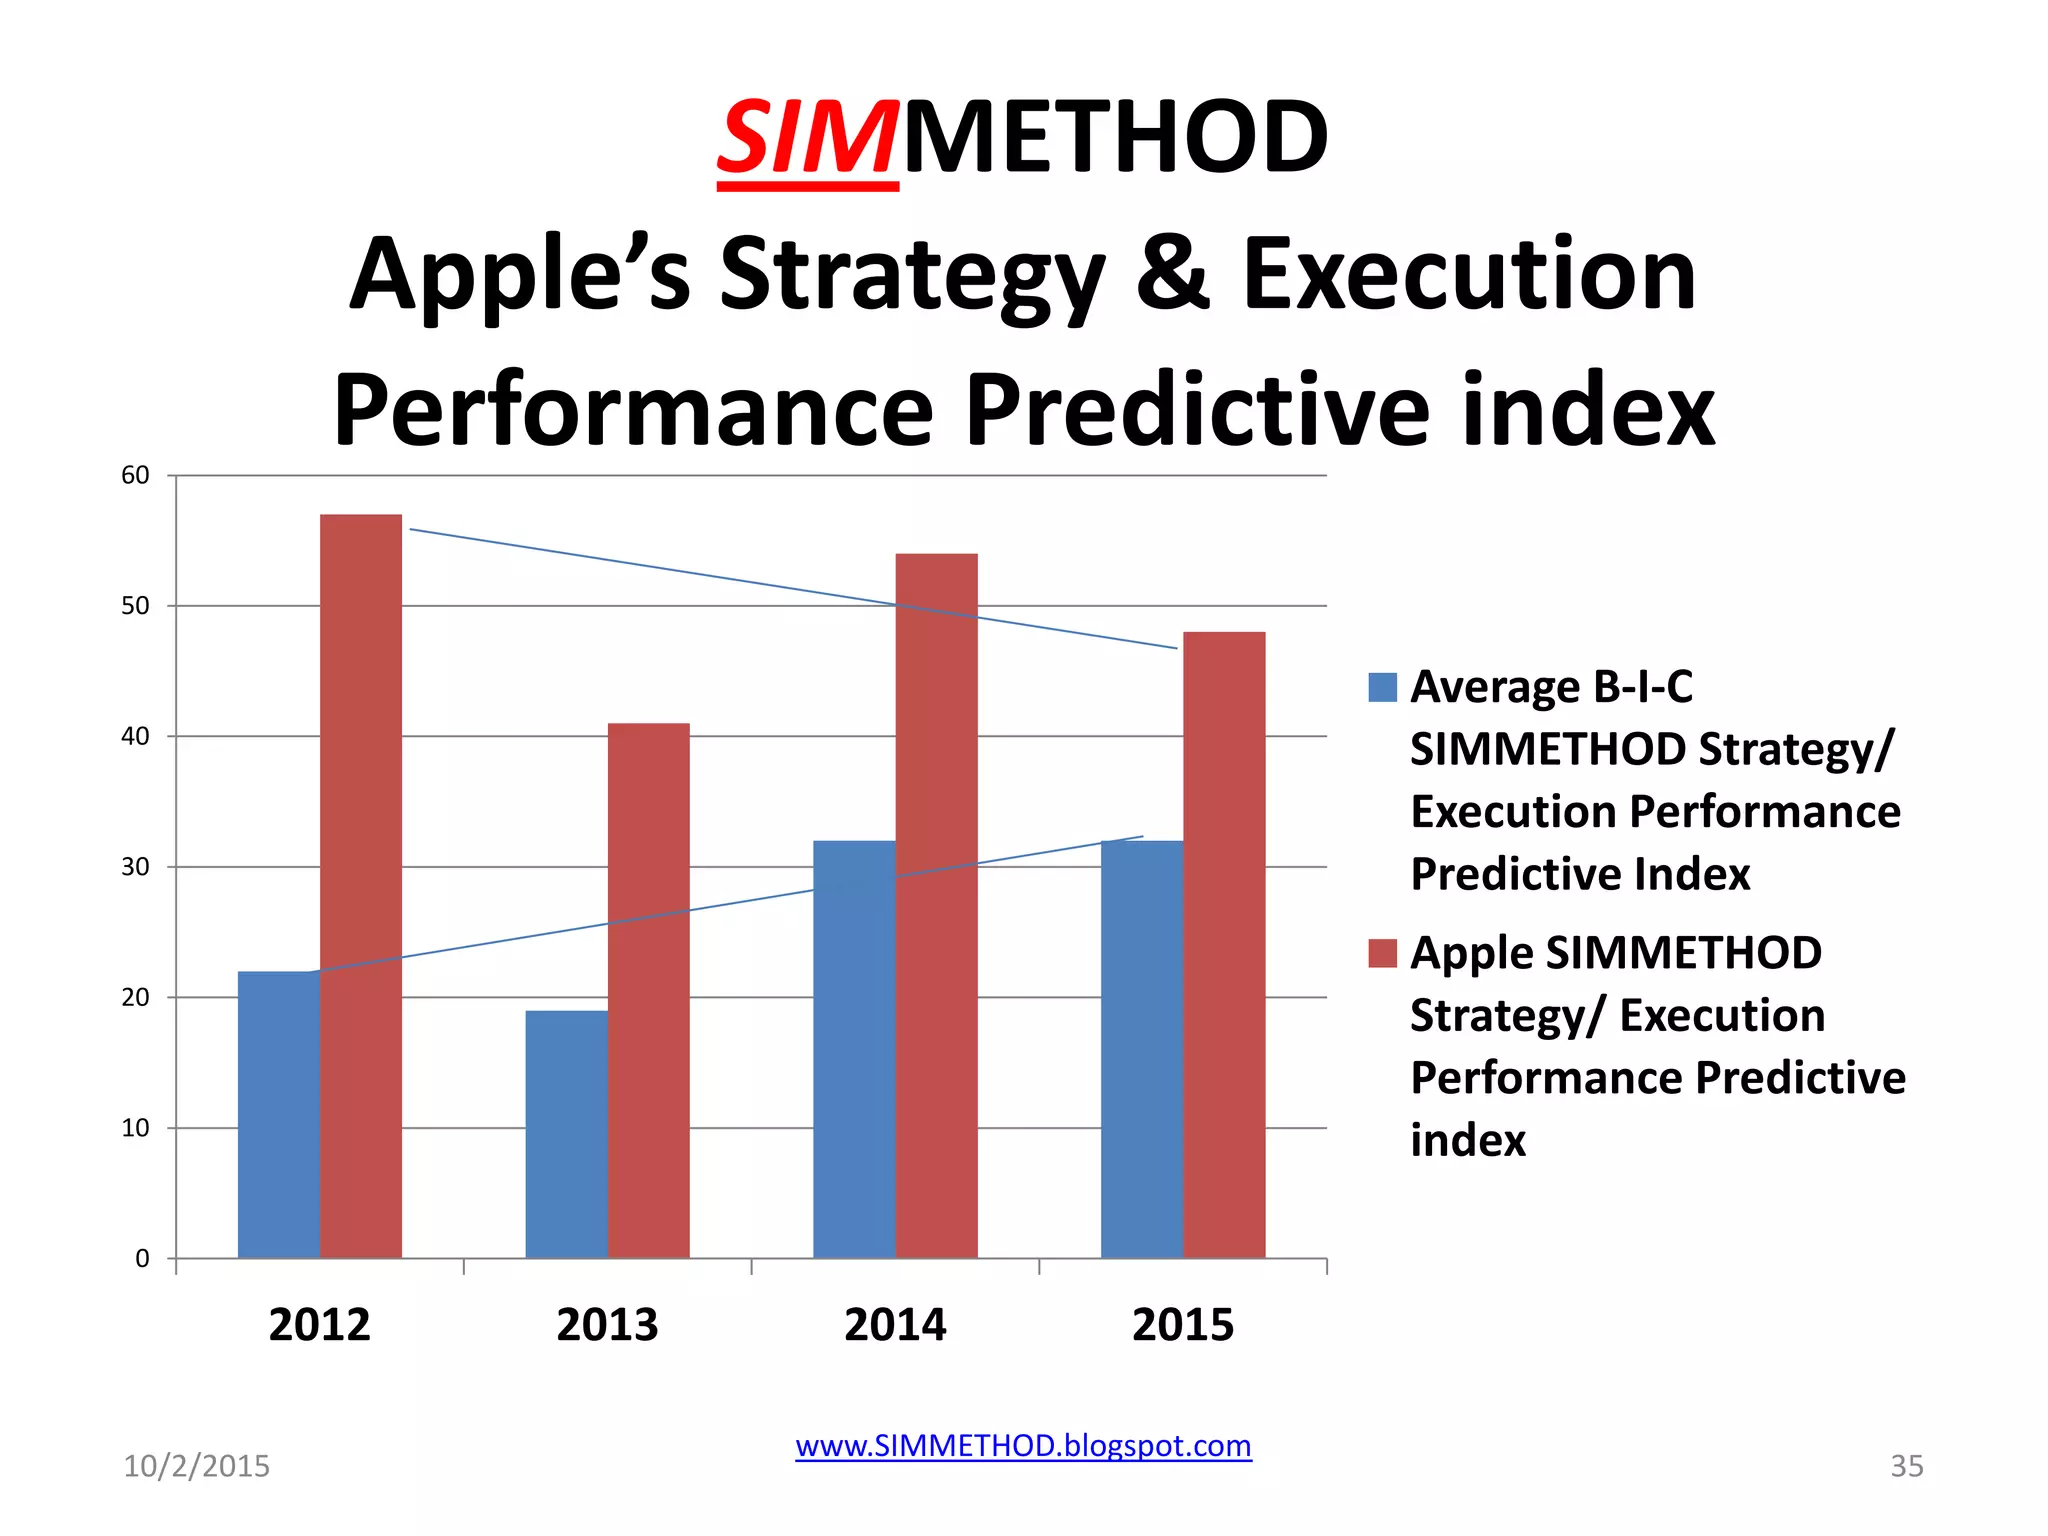
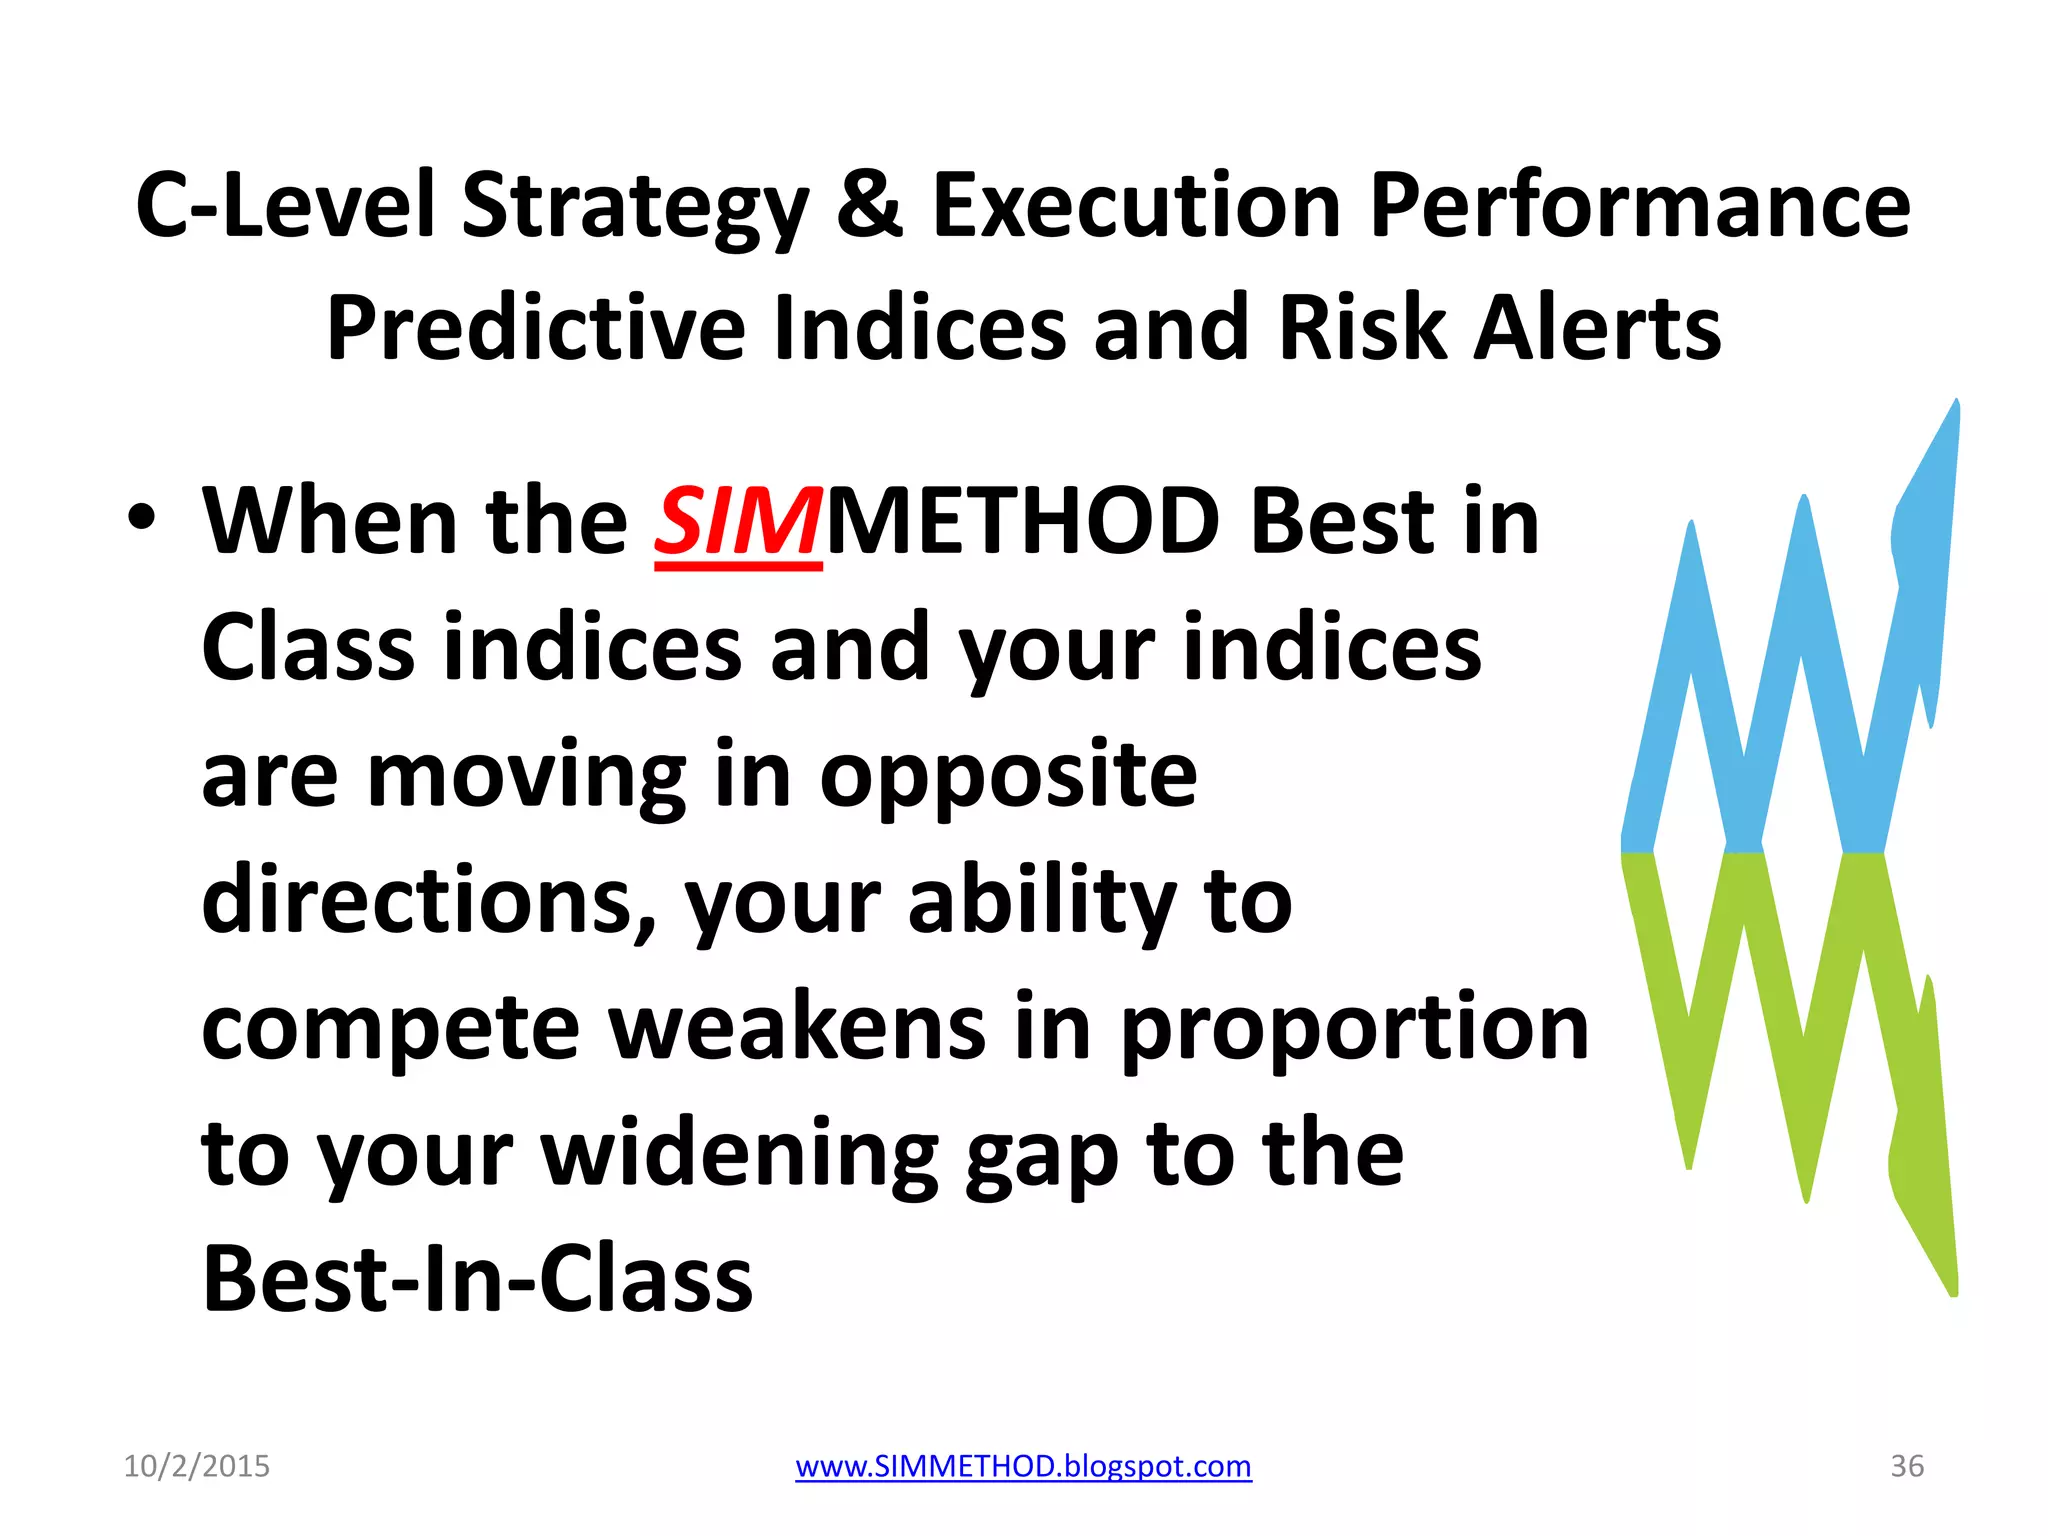
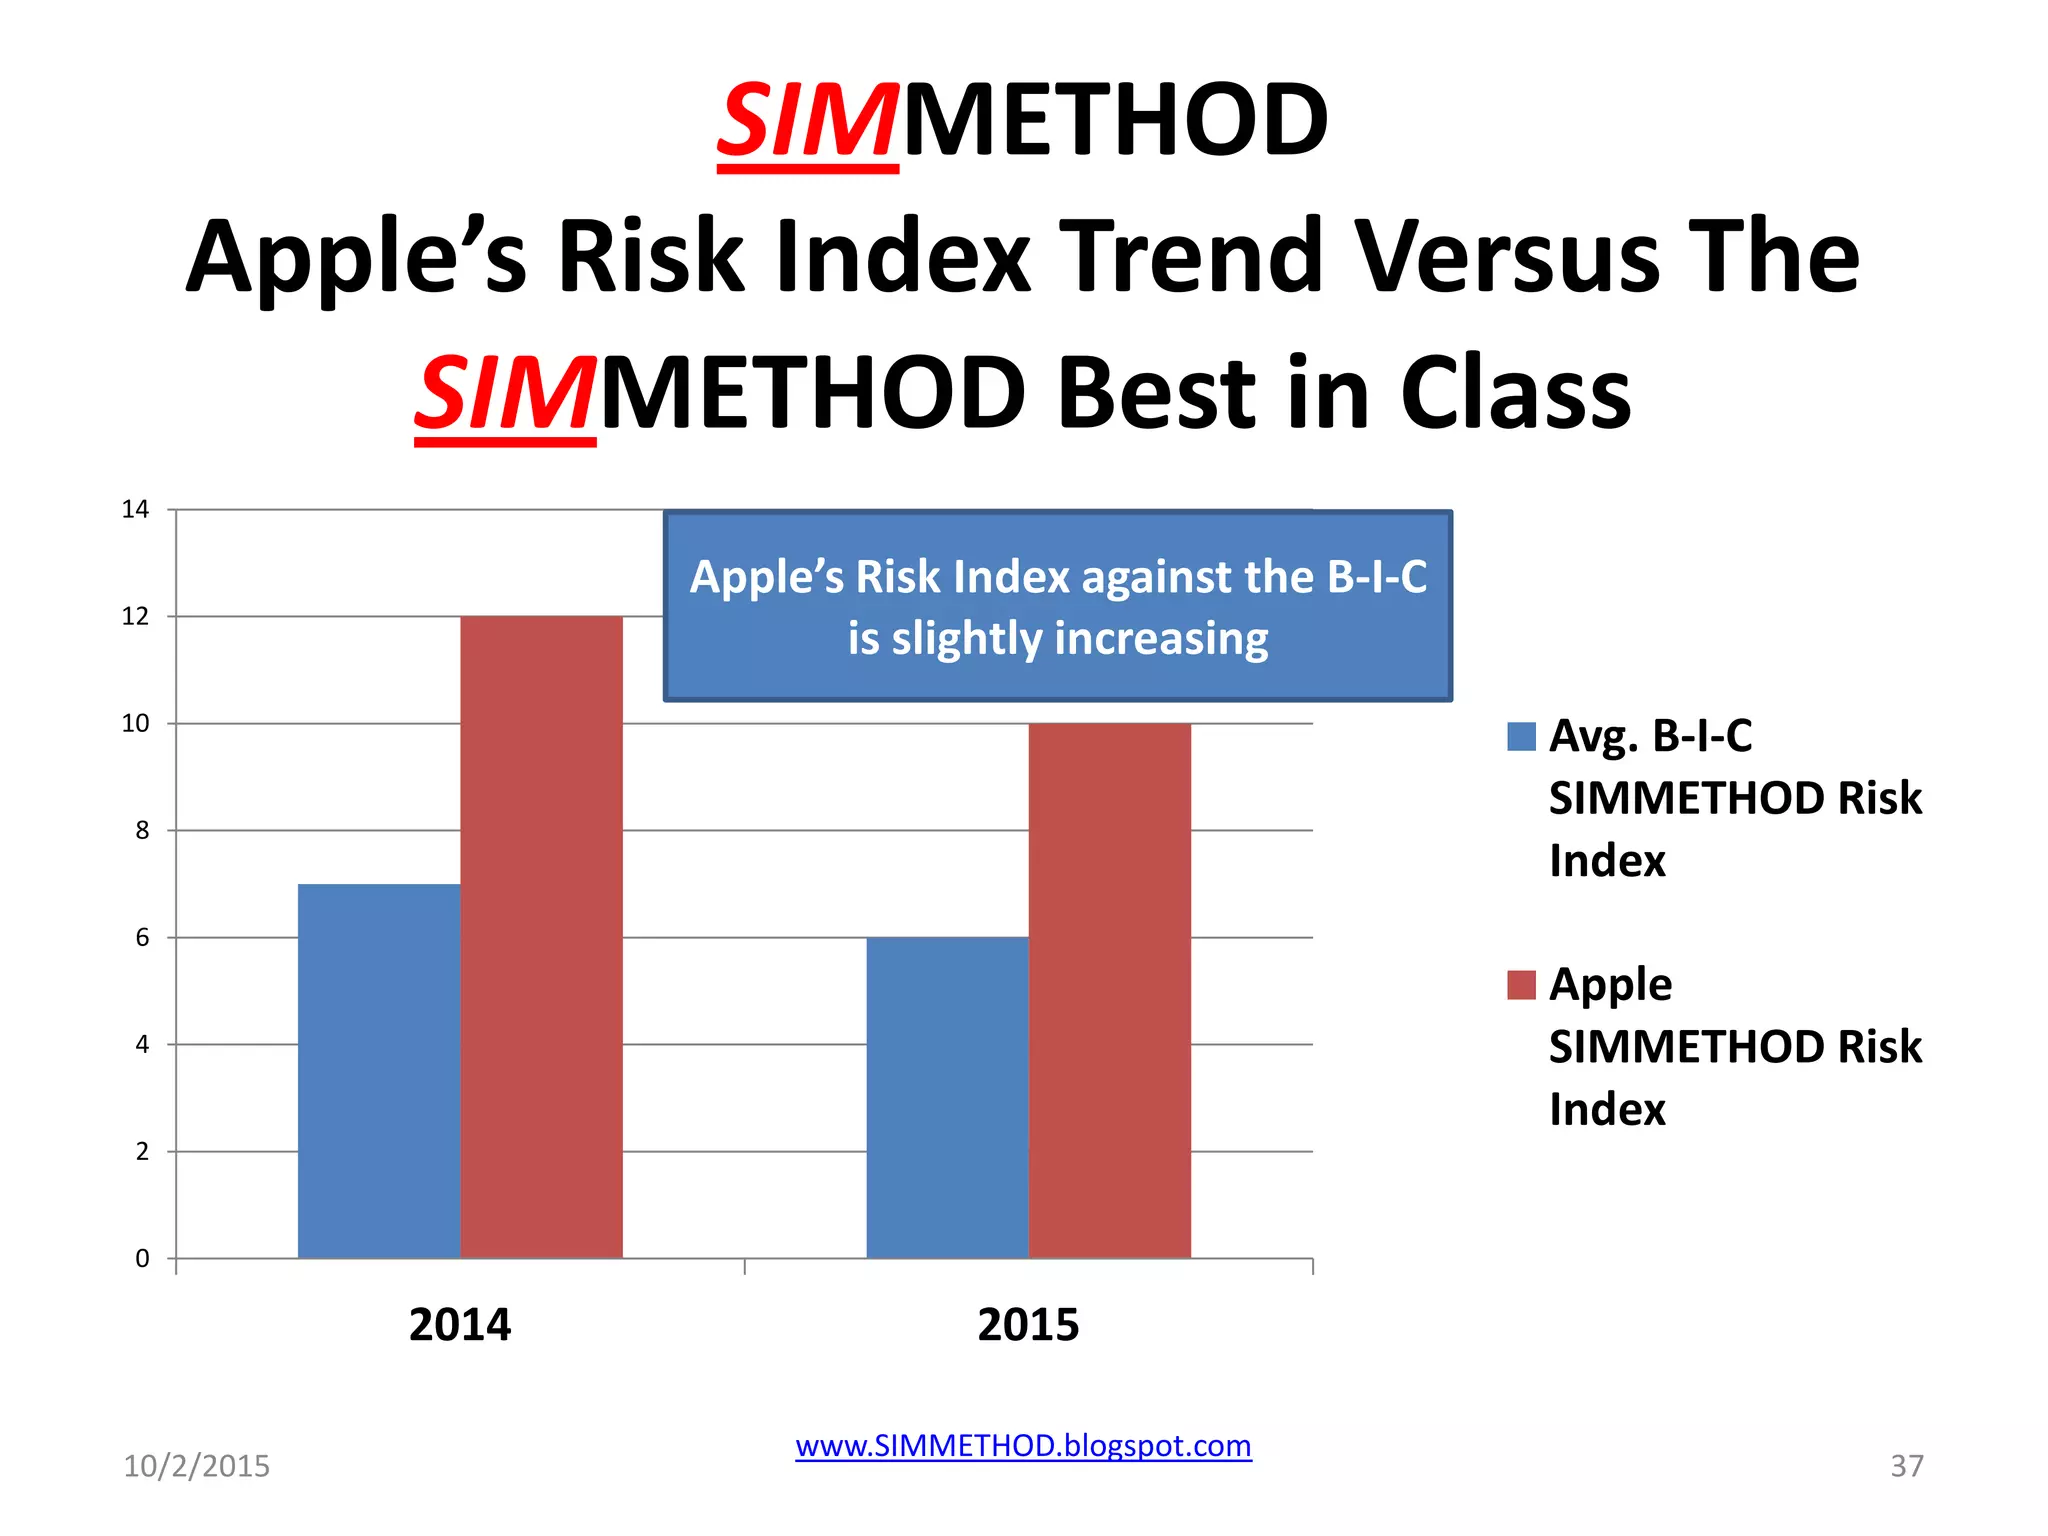
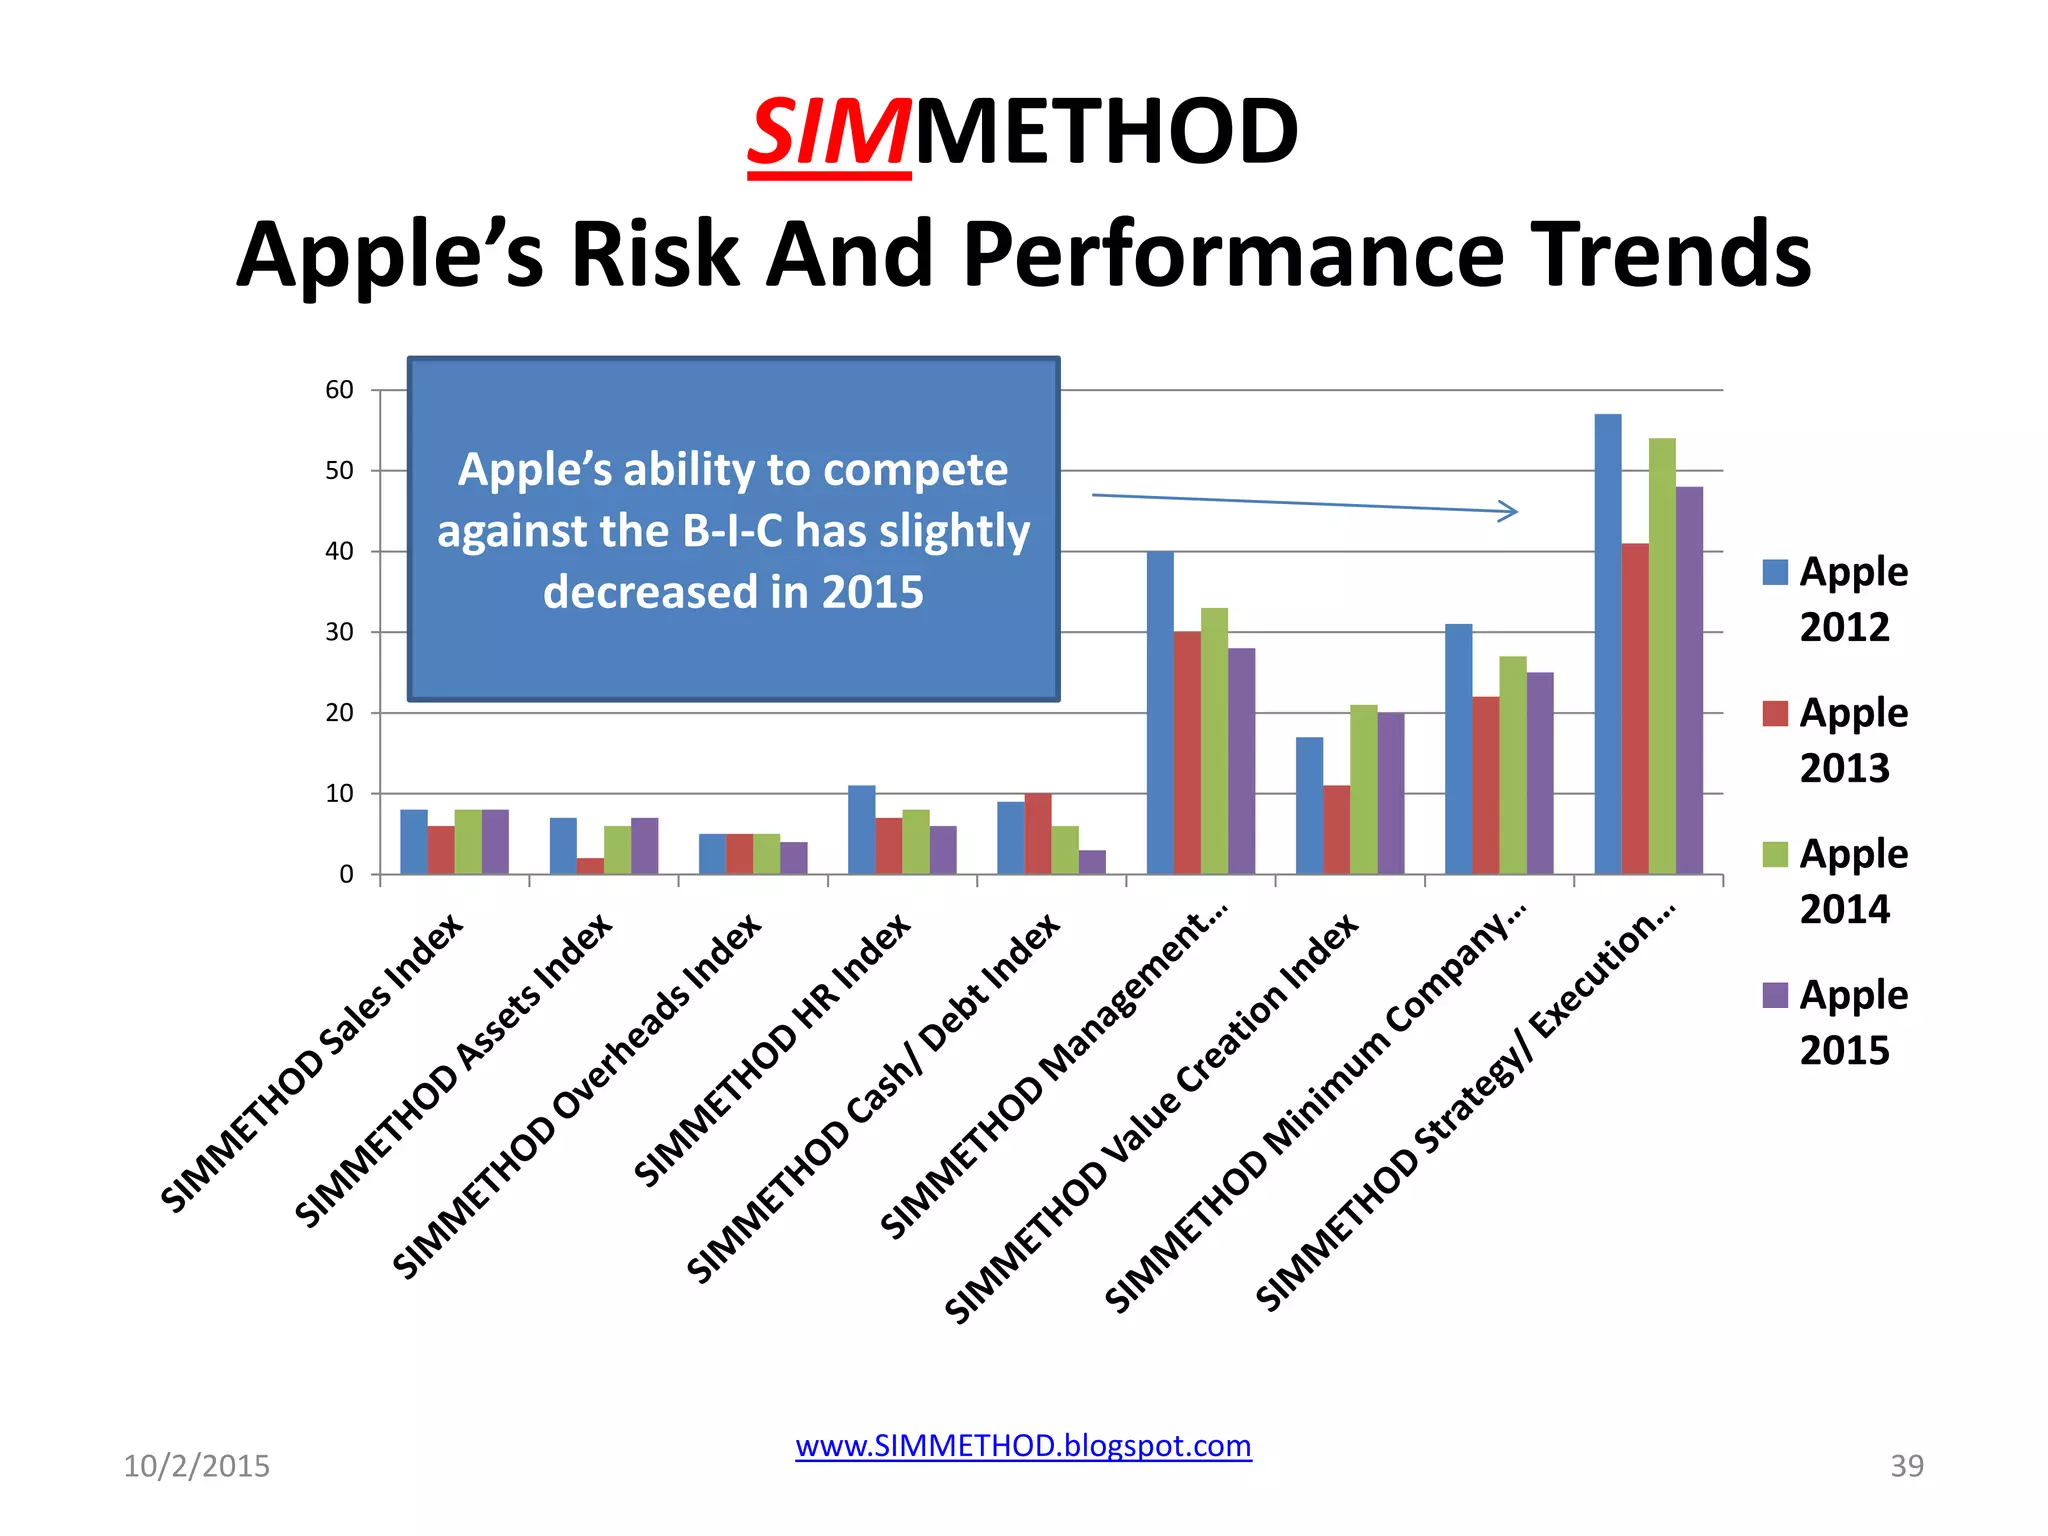
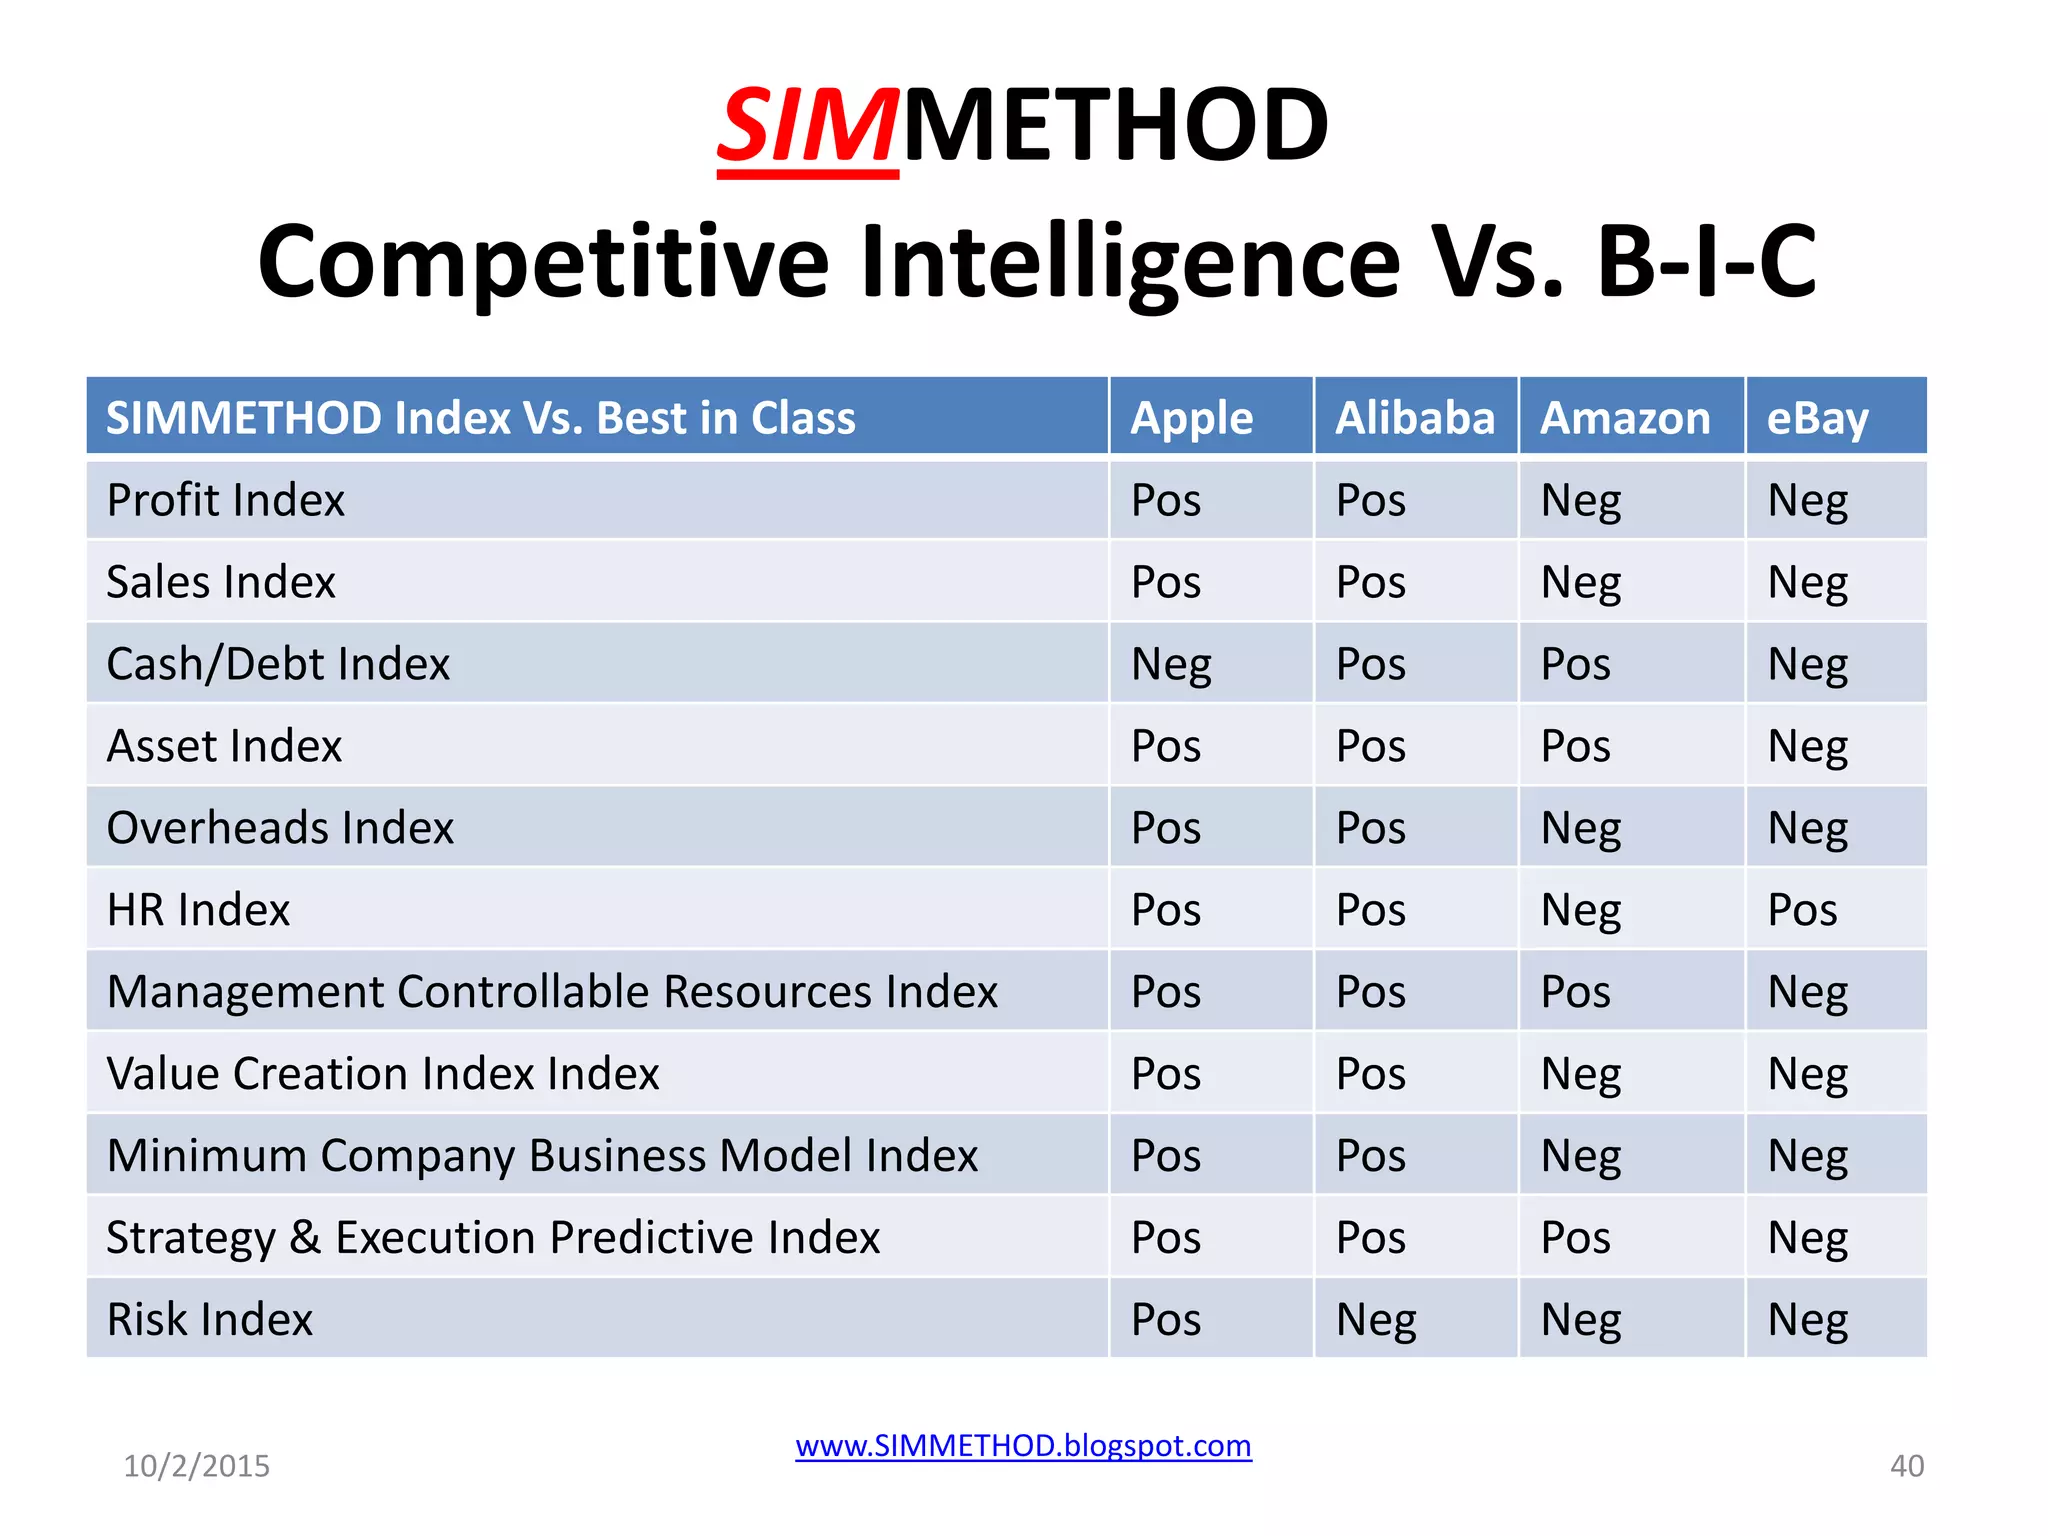
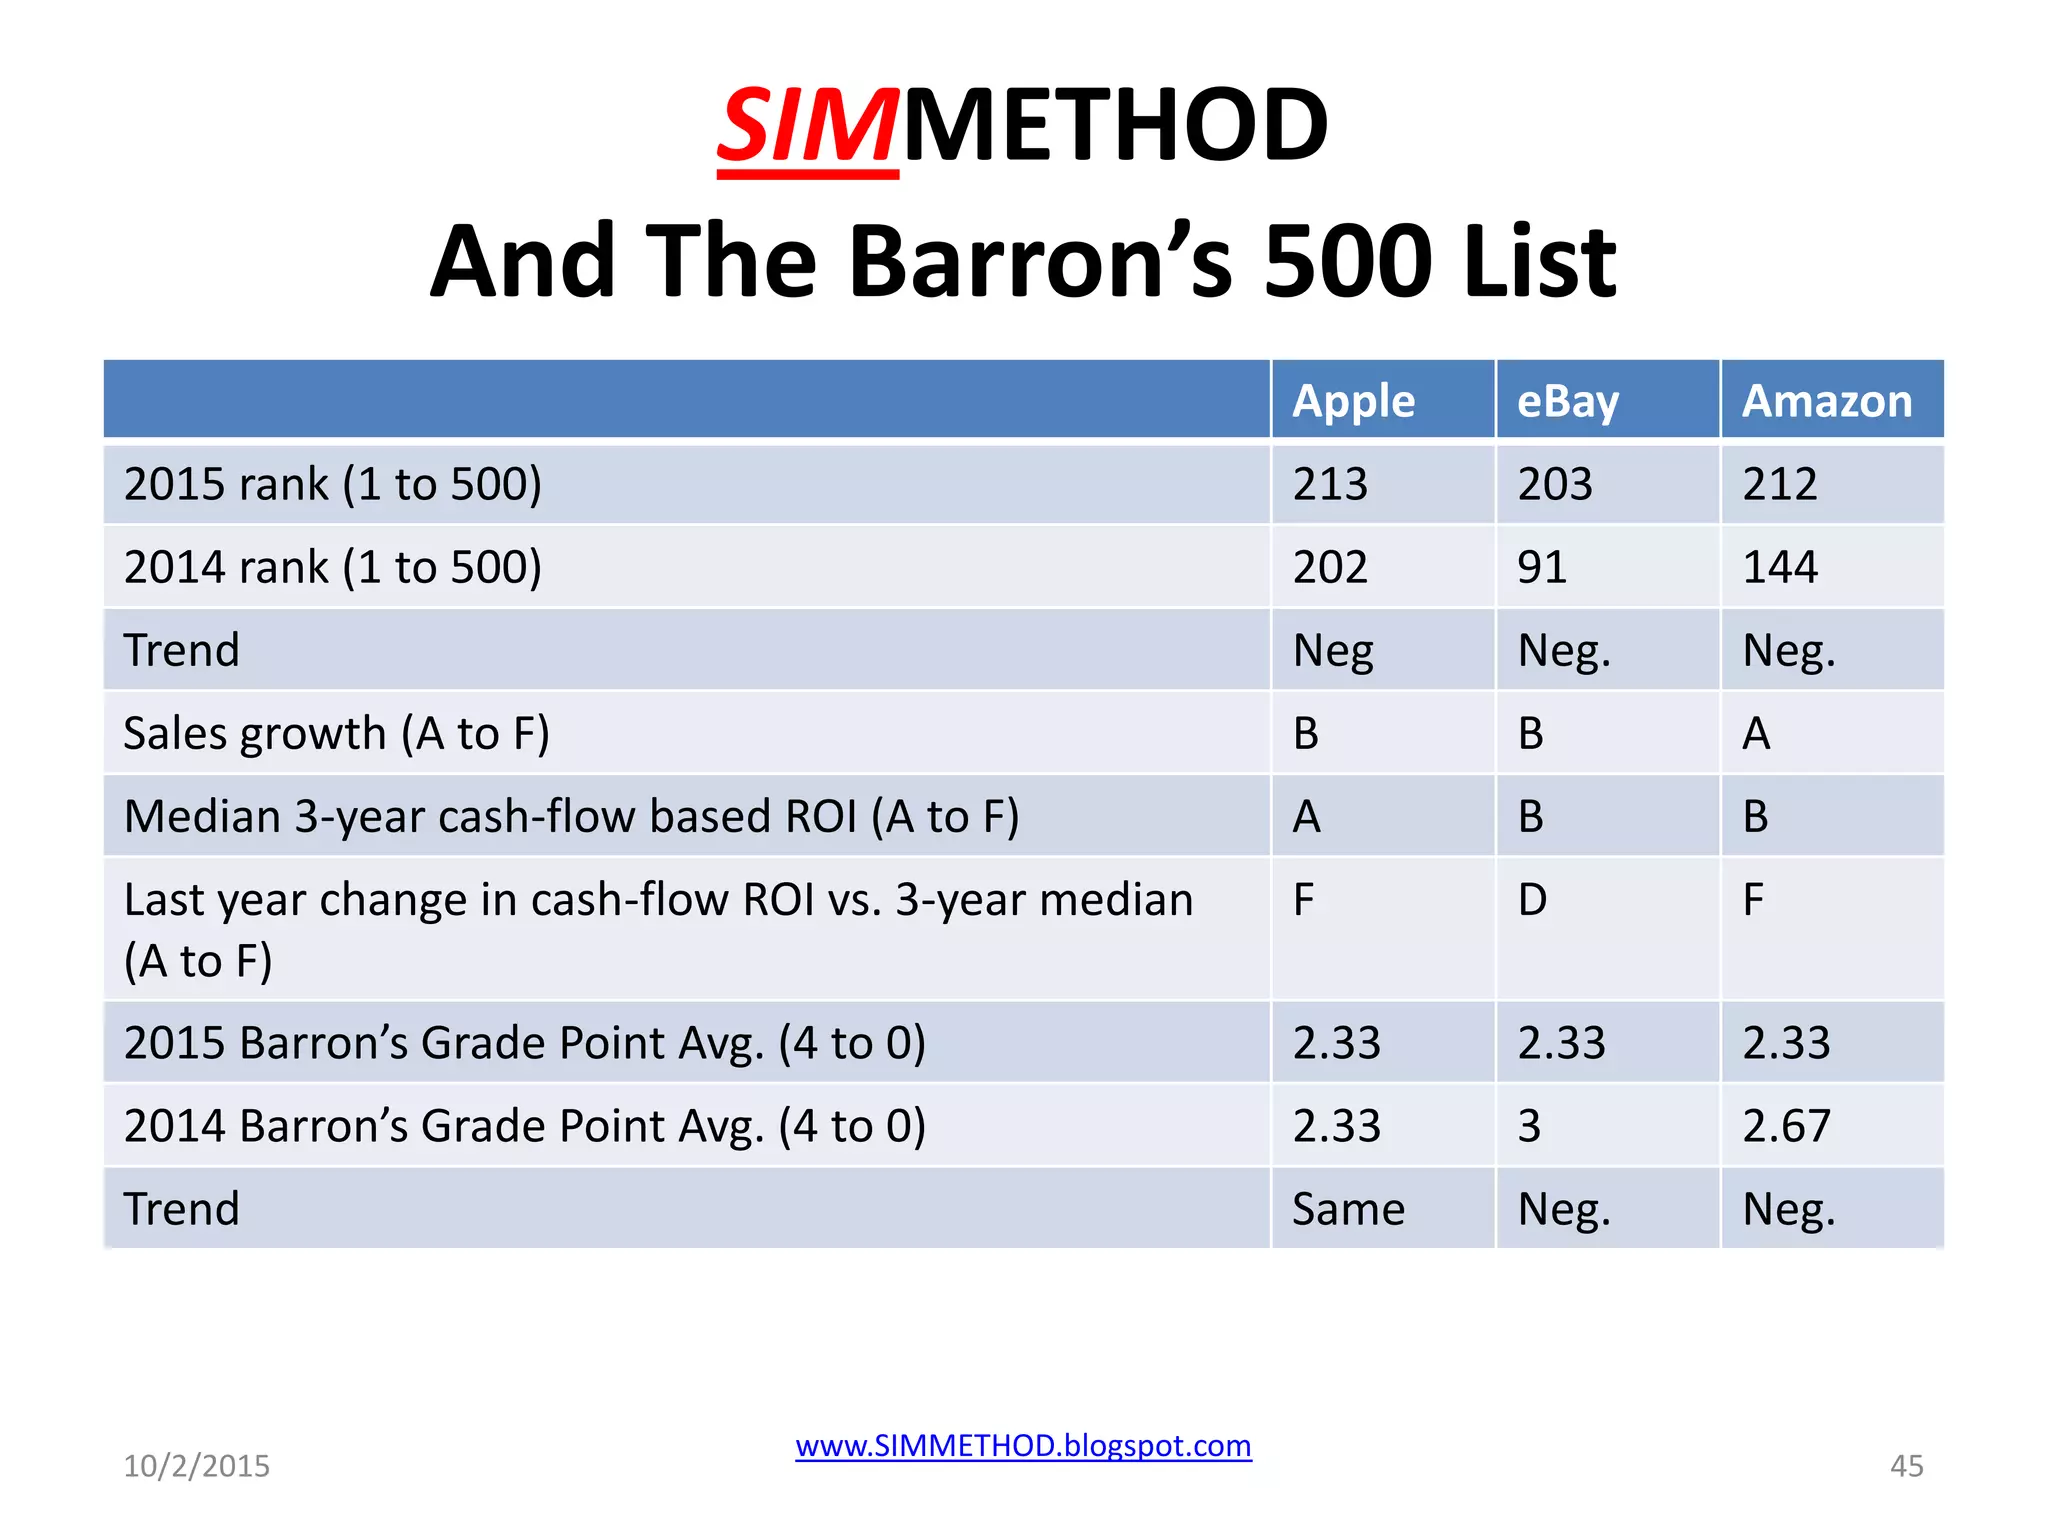
The document discusses SIMMETHOD, a new methodology for measuring and predicting corporate risk and performance in a holistic way. It outlines some of the limitations of traditional business intelligence and analytics in providing useful insights to C-level executives. SIMMETHOD aims to develop predictive indices based on a company's strategy and execution performance relative to best-in-class competitors across industries. Graphs are presented analyzing Apple's performance on several SIMMETHOD indices in recent years, showing declining trends versus the best-in-class averages.
In the outcomes economy, where you will need to deliver outcomes rather than products and services, linking your products and services to the success metrics of your customers’ CFO, will be a key asset and essential to your survival because the real measure of your products and services is the value they add to your customers.
In Spite Of Billions Of Dollars Spent On Business Intelligence And Analytics, The Industrial Era Metrics We Use To Measure Business Risk And Performance Are Broken And Failing The C-suite
In spite of billions of dollars spent on business intelligence and predictive analytics, there is mounting evidence that the industrial-era metrics we use to measure corporate risk and performance is failing the C-suite and slowing your decision making process down. IBM and Teradata case studies
Was Yahoo’s 2015 negative trend predictable in 2014 or driven by external circumstances beyond management control?
Non-compliance with SIMMETHOD’s 7 Laws Of Growth And Value Creation shows your areas of vulnerability and risk and when applied to your customers, it shows your opportunity to enhance their business value because:
“The real measure of your products and services is the value they add to your customers”, SIMMETHOD
Solving the Tower Of Babel syndrome in your business by aligning the metrics of your CIO and CMO to your CFO and your customers' CFOS. VMware and Cisco case study.
From company business intelligence to predictive value chain business intelligence and from internally-focused and historically based risk and performance forecasting to leveraging the forecasting and analytics wisdom of the market Best In Class:
:
SIMMETHOD provides predictive competitive intelligence linking the value chain via a common set of metrics enabling partners (suppliers, customers) to align their strategies and synchronize their business models, processes and execution.
SIMMETHOD risk and performance management global database is based on competitive intelligence measuring of external market forces that will have major risk and opportunities implications for you and your business.
CompTIA’s annual IT Industry Outlook provides a look at the trends to watch in the year ahead in the information technology (IT) space. CompTIA explores topics such as digital transformation, artificial intelligence, cybersecurity, the insights economy, new collar jobs, and more.
The complete IT Industry Outlook 2018 report can be viewed free of charge at:
https://www.comptia.org/resources/it-industry-trends-analysis
Which Departments Wield the Most Influence Over Purchase Decisions in Your B2...LinkedIn
To reach the B2B buying committee, marketers and salespeople must spread their message across the organization. This research shows which internal departments (HR, IT, finance) wield the most influence over purchase decisions in 22 vertical industries.
"To (Plan B) Or Not To (Plan) B, That Is The Question" - September 2016Paul Cuatrecasas
The Aquaa Partners research team and The Tech CEO Roundtable have prepared a report presenting:
A survey conducted in August 2016 of 150 CEOs of Tech companies in Europe asking them:
– ”Does market uncertainty matter to you?” and “Do you have a “Plan B” for your company?”
What is “Plan B” and why does it matter?
An analysis of what happened to technology companies pre- and post-Lehman’s collapse in 2008
A review of how fragile the global financial markets currently are and why this fragility matters to Technology companies
Accelerating Partner Management: How Manufacturers Can Navigate Covid-19Perficient, Inc.
The pandemic has ushered in a new normal for manufacturers, and the impact of digital communication is more important than ever.
View our on-demand webinar with Tony Kratovil, Regional Vice President of Manufacturing at Salesforce, and Eric Dukart, National Sales Executive at Perficient. They covered why the right digital strategies are critical for manufacturers in the wake of COVID-19.
Our webinar covered:
Current challenges with forecasting, collaboration, and disruptions to distribution networks.
Insights for stabilizing operations, accelerating partner management, and developing a digital strategy that differentiates your business.
Candid Q&A with real-world examples.
New Work.com resources to help manufacturers restart safely and rebuild.
Tools and resources to move forward – fast.
SIMMETHOD success metrics, leading indicators and risk alerts: Measuring and predicting SAP, Oracle and Salesforce risk and performance in the digital economy
According to Business Insider “Big-time investors Chris Sacca and Fred Wilson From Union Square Ventures are at odds over Twitter’s future”. What the SIMMETHOD metrics are telling us?
Twitter 2015 Case Study: Connecting you with the success metrics of your customers' CFO, thus enabling you to directly contribute to their success
How long would it take for you and your Csuite to realize that your strategy is not being followed or that you have been outsmarted by a new competitor?
“IBM on April missed Wall Street estimates for the first time since 2005 and started to laying off thousands of employees” Business Insider
“Where we have not transformed rapidly enough, we struggled. We have to step up at all levels” IBM’s CEO Virginia Rometty
Was IBM’s Performance Predictable?
In spite of billions of dollars spent on business intelligence and predictive analytics why companies continue to fail or fail to perform?
The way we measure corporate risk and performance is broken and disconnected to the new drivers of value creation
Google's Case Study on Best-in-Class performance: Google’s strength in the Management Controllable Resources Index shows effective resource management and a strong ability to convert resources into Best-In-Class performance
In a market where industry barriers have collapsed and new competitors can come from many different industries, how do you measure and predict your future risk and performance and fend off current and future competitors?
Unlike static industrial era ratios that do not capture the dynamic relationships between businesses and value chains, SIMMETHOD industry agnostic composite indices measure the interactive relationships (competitive advantage) between businesses and value chains across business sectors and provide early warning alerts of threats and opportunities.
In a market where industry-barriers have collapsed and new competitors can come from any industry, how do you measure and predict your future risk and performance and fend-off current and future competitors?
The missing link between, analytics, business intelligence and C-level trust: converting your analytics and business intelligence into your CFO most important business tool
In a market where industry-barriers have collapsed and new competitors can come from any industry, how do you measure and predict your future risk and performance and fend-off current and future competitors?
Apple's C-Suite Risk and Opportunity Alerts
In a market where industry-barriers have collapsed and new competitors can come from any industry:
How do you measure and predict your future risk and performance and
Fend-off current and future competitors?
Unlike static ratios that do not capture the dynamic relationships between Businesses, SIMMETHOD’s industry-agnostic composite indices:
Measure the interactive relationships (competitive advantage) between Businesses across multiple industries and
Provide early warning alerts of future threats and opportunities.
The SIMMETHOD algorithms review business data and stockholders valuation-decisions across business sectors and build industry-agnostic indices in order to identify, measure, correlate and predict your strengths, weaknesses, risks and opportunities against your current and potential future competitors from inside or outside your industry.
The SIMMETHOD Management Controllable Index is based on a basket of strategically-placed C-level sensors in the business processes and resources under management control plus the areas of the market where most value is being created.
The ongoing feedback from the management sensors acts as a GPS extending your line of vision to your value-chain and enables you to receive early warnings of threats, opportunities and the risk associated with your decisions.
Why do you need Industry Agnostic Leading indicators and Risk/Opportunities Alerts?
In an interdependent Market (like the Planets in the solar system) your current and future risk and performance are impacted by an ecosystem of constantly changing competitors coming from inside and outside your Industry.
Is LinkedIn performance predictable based on the SIMMETHOD Strategy and Execution Performance Predictive Indices, Risk Alerts and the 7 Laws of Growth and Value Creation?
The C-Level Lament in the Business Intelligence and Analytics Market
We did not see it coming. All my Divisions and Products’ Analytics pointed North while my Business as a whole (in comparison to new competitors and the Best-In-Class in multiple industries) went South.
Similar to Simmethod measuring and predicting apple risk and performance (20)
The crowd sourced analytics and competitive intelligence of the Best In Class.
Amazon: laggard or Best In Class?
It all depends on the color of your metrics!
In a market where industry barriers have collapsed and unlike static industrial era ratios that do not capture the dynamic relationships between businesses and value chains, SIMMETHOD industry agnostic composite indices measure the interactive relationships (competitive advantage) between businesses and value chains across business sectors and provide early warning alerts of threats and opportunities.
C-level risk and performance metrics and ratios based on industrial-era analytics were not designed to capture intangible values or the dynamic relationships between businesses and their value chains
Are your C-level risk and performance metrics and ratios based on industrial-era analytics that were not designed to capture intangible values or the dynamic industry-agnostic relationships between businesses and their value chains?
When the Best-In-Class and your SIMMETHOD C-Level indices are moving in opposite directions your ability to compete weakens in proportion to your widening gap to the Best-In-Class
In a constantly changing market, how do you link the resources under your control (such as your Human Capital) to your desired business outcomes in order to fend off current and future competitors from inside and outside your industry?
More from SIMMETHOD: Converting Information Into Assets (12)
Global Situational Awareness of A.I. and where its headedvikram sood
You can see the future first in San Francisco.
Over the past year, the talk of the town has shifted from $10 billion compute clusters to $100 billion clusters to trillion-dollar clusters. Every six months another zero is added to the boardroom plans. Behind the scenes, there’s a fierce scramble to secure every power contract still available for the rest of the decade, every voltage transformer that can possibly be procured. American big business is gearing up to pour trillions of dollars into a long-unseen mobilization of American industrial might. By the end of the decade, American electricity production will have grown tens of percent; from the shale fields of Pennsylvania to the solar farms of Nevada, hundreds of millions of GPUs will hum.
The AGI race has begun. We are building machines that can think and reason. By 2025/26, these machines will outpace college graduates. By the end of the decade, they will be smarter than you or I; we will have superintelligence, in the true sense of the word. Along the way, national security forces not seen in half a century will be un-leashed, and before long, The Project will be on. If we’re lucky, we’ll be in an all-out race with the CCP; if we’re unlucky, an all-out war.
Everyone is now talking about AI, but few have the faintest glimmer of what is about to hit them. Nvidia analysts still think 2024 might be close to the peak. Mainstream pundits are stuck on the wilful blindness of “it’s just predicting the next word”. They see only hype and business-as-usual; at most they entertain another internet-scale technological change.
Before long, the world will wake up. But right now, there are perhaps a few hundred people, most of them in San Francisco and the AI labs, that have situational awareness. Through whatever peculiar forces of fate, I have found myself amongst them. A few years ago, these people were derided as crazy—but they trusted the trendlines, which allowed them to correctly predict the AI advances of the past few years. Whether these people are also right about the next few years remains to be seen. But these are very smart people—the smartest people I have ever met—and they are the ones building this technology. Perhaps they will be an odd footnote in history, or perhaps they will go down in history like Szilard and Oppenheimer and Teller. If they are seeing the future even close to correctly, we are in for a wild ride.
Let me tell you what we see.
06-04-2024 - NYC Tech Week - Discussion on Vector Databases, Unstructured Data and AI
Discussion on Vector Databases, Unstructured Data and AI
https://www.meetup.com/unstructured-data-meetup-new-york/
This meetup is for people working in unstructured data. Speakers will come present about related topics such as vector databases, LLMs, and managing data at scale. The intended audience of this group includes roles like machine learning engineers, data scientists, data engineers, software engineers, and PMs.This meetup was formerly Milvus Meetup, and is sponsored by Zilliz maintainers of Milvus.
The Building Blocks of QuestDB, a Time Series Databasejavier ramirez
Talk Delivered at Valencia Codes Meetup 2024-06.
Traditionally, databases have treated timestamps just as another data type. However, when performing real-time analytics, timestamps should be first class citizens and we need rich time semantics to get the most out of our data. We also need to deal with ever growing datasets while keeping performant, which is as fun as it sounds.
It is no wonder time-series databases are now more popular than ever before. Join me in this session to learn about the internal architecture and building blocks of QuestDB, an open source time-series database designed for speed. We will also review a history of some of the changes we have gone over the past two years to deal with late and unordered data, non-blocking writes, read-replicas, or faster batch ingestion.
Unleashing the Power of Data_ Choosing a Trusted Analytics Platform.pdfEnterprise Wired
In this guide, we'll explore the key considerations and features to look for when choosing a Trusted analytics platform that meets your organization's needs and delivers actionable intelligence you can trust.
STATATHON: Unleashing the Power of Statistics in a 48-Hour Knowledge Extravag...sameer shah
"Join us for STATATHON, a dynamic 2-day event dedicated to exploring statistical knowledge and its real-world applications. From theory to practice, participants engage in intensive learning sessions, workshops, and challenges, fostering a deeper understanding of statistical methodologies and their significance in various fields."
Simmethod measuring and predicting apple risk and performance
1. SIMMETHOD
A New Way To Measure And Predict
Your Risk And Performance In The
Digital Economy
Apple
C-Level Success Metrics, Leading
Indicators And Risk Alerts
10/2/2015 1www.SIMMETHOD.blogspot.com
2. SIMMETHOD
Why The Experts Can Not Agree?
• “Morgan Stanley's stock market
guru explains why everything
you know is worthless”. Myles
Udland, Business insider on
September 28
10/2/2015
www.SIMMETHOD.blogspot.com
2
3. SIMMETHOD
Why The Experts Can Not Agree?
• “In a note to clients on Monday,
Morgan Stanley chief equity
strategist Adam Parker wrote that
the world had changed and
investors looking to old methods for
valuing stocks would come up with
bad answers”.
10/2/2015
www.SIMMETHOD.blogspot.com
3
4. SIMMETHOD
Why The Experts Can Not Agree?
• “In the US, corporate earnings growth
has been slowing down for months”.
• “It is amazing how forgiving the general
commentary has been on profits and
even the broad economy, Deutch Bank’s
David Bianco said in an email to
Business Insider”.
10/2/2015
www.SIMMETHOD.blogspot.com
4
5. SIMMETHOD
Why The Experts Can Not Agree?
• “Many seem to celebrate the absence of a
recession. The labor market continues to
tighten…but other than some bright spots
like auto and housing, growth is extremely
weak with underlying drivers like
productivity and investing disturbingly poor
and S&P profits are not growing”. Sam Ro on
Business Insider on September 22
10/2/2015
www.SIMMETHOD.blogspot.com
5
6. SIMMETHOD
Why The Experts Can Not Agree?
• “Not only are earnings in the US not growing,
but by many estimates, earnings are actually
contracting. Societe Generale's Andrew
Lapthorne has been sounding the alarm on
earnings for a while, and he reiterated this
call in a note to clients on Monday”. Sam Ro
on Business Insider on September 22
10/2/2015
www.SIMMETHOD.blogspot.com
6
7. SIMMETHOD
Why The Experts Can Not Agree?
• “Shares of the formerly can-do-no
wrong stock are down 19.6% from their
high – putting them just outside the
claws of a bear market. That is much
worse than the 10.7% decline of the
broad Standard & Poor’s 500”. Matt
Krantz on the watch can not save Apple,
USA TODAY, October 1, 2015
10/2/2015
www.SIMMETHOD.blogspot.com
7
8. SIMMETHOD
• Is APPLE’s future risk and
performance predictable based
on the SIMMETHOD crowd
sourced competitive
intelligence and Strategy and
Execution Performance
Predictive Index?
10/2/2015 8WWW.SIMMETHOD.BLOGSPOT.COM
9. SIMMETHOD B-I-C Profiles And Risk Alerts
Benchmark Your Business Vs. The B-I-C
To review a case study of Apple Inc., compare
your gap to the Best in Class and set up risk
alerts versus the following profiles:
• Profit profile
• Value profile
• Sales profile
• Human Capital profile
10/2/2015 www.SIMMETHOD.blogspot.com 9
10. SIMMETHOD Solution
The Way You Measure Determines Your Results
•SIMMETHOD
Methodology and
Algorithms
10/2/2015 www.SIMMETHOD.blogspot.com 10
11. SIMMETHOD
Why The Experts Can Not Agree?
• The Industrial-age way we
measure and predict
corporate risk and
performance is broken and
disconnected from market
context and the new levers
of value creation.
10/2/2015 www.SIMMETHOD.blogspot.com 11
12. SIMMETHOD
Problem Definition
The CEO Lament:
• My analytics and
business
intelligence point
North but my
business points
South
10/2/2015 www.SIMMETHOD.blogspot.com 12
13. SIMMETHOD
Problem Definition
SIMMETHOD
C-suite
success
metrics &
risk alerts
Missing link
between analytics
and the C-suite
Missing link
between analytics
and performance
Industrial era
metrics
disconnected from
the new levers of
value creation
Silo-Metrics
unable to
holistically
measure strategy
and execution
Lack of c-suite
early warning risk
alerts and leading
indicators
10/2/2015 www.SIMMETHOD.blogspot.com 13
14. SIMMETHOD
Is Business Intelligence And Analytics Failing The C-suite?
SIMMETHOD
C-suite
Success
Metrics And
Risk Alerts
PWC CEOs Survey:
56% of CEOs think
cross-sector
competition is on
the rise and 59%
see more threats
Boris Evelson, VP of BI,
Forrester Research: Only
40% of structured and 31%
of unstructured data
transformed into insights
IBM CFOs Insights: 53% of
CFOs think they are not
effective at measuring and
managing performance
Deloitte CFOs
Concerns & Insights:
Predicting your
competitors’ next
steps & execution
missteps
10/2/2015 14www.SIMMETHOD.blogspot.com
15. Why Do Businesses Succeed Or Fail?
SIMMETHOD Premise
SIMMETHOD
premise is simple:
Businesses succeed or fail
primarily due to internal
decision-making rather than
external circumstances
beyond management control.
10/2/2015 www.SIMMETHOD.blogspot.com 15
16. SIMMETHOD
C-Level Leading Indicators
In spite of billions of dollars
spent on predictive analytics
and business intelligence
Why do companies succeed,
fail to perform or miss their
targets?
3/20/2015
www.simmethod.blogspot.com
16
17. SIMMETHOD
Strategy & Execution Performance Predictive
Index And C-Level Risk Alerts
Unlike product or process analytics or
industry specific ratios, the SIMMETHOD
algorithms:
Review business data and stockholders
valuation-decisions across business
sectors and
Build industry-agnostic and context-based
holistic indices in order to:
10/2/2015 17www.simmethod.blogspot.com
18. SIMMETHOD
Strategy & Execution Performance Predictive
Index And C-Level Risk Alerts
Identify, measure, correlate and
Predict your strengths and weaknesses versus
your current and future competitors from
inside or outside your industry and
Receive C-level risk alerts linked to a
competitive intelligence database
10/2/2015 18
www.simmethod.blogspot.com
19. The SIMMETHOD Algorithms
SIMMETHOD
Strategy &
Execution
Performance
Predictive Index
Stockholders
valuation and
management’s
rating
C-level strategy
& execution
Business model
Management’s
ability to
strategize &
execute against
competitors
Competitors
strategy &
execution
10/2/2015 19www.simmethod.blogspot.com
20. 30/11/2014 Strategy & Execution Performance Predictive Index www.simmethod.blogspot.com
SIMMETHOD Strategy & Execution Performance Predictive
Index, Competitive Intelligence Database & Risk Alerts
SIMMETHOD: A new industry agnostic
way to measure and predict your risk and
performance in a “world without
industries”, the Internet of Things and
Connected Intelligent Products
BEST IN
CLASS
LOW PERFORMANCE &
MAXIMUM RISK
Global, predictive
strategy/execution
score & risk alerts
Risk &
Performance
aligned to
the B-I-C
Industry agnostic C-
level risk alerts and
leading indicators
Context
rather than
absolute
metrics &
targets
Crowd
sourced
competitive
intelligence
Unable to fend off
future competitors
from different
industries
Lack of holistic
strategy &
execution C-
level metrics
Lack of crowd
sourced self
correcting analytics
Industry specific
rather than market
metrics and C-level
risk alerts
Absolute or
relative metrics
rather than B-I-C
context metrics
Metrics & targets
are industry
agnostic (market
rather than
industry specific)
Risk & Performance
driven by external
circumstances beyond
management control
10/2/2015 20www.simmethod.blogspot.com
21. SIMMETHOD
Strategy & Execution Performance Predictive
Index And Risk Alerts
SIMMETHOD’s Strategy
& Execution
Performance Predictive
Indices and Risk Profiles
are not deterministic.
Businesses that act
on their
SIMMETHOD
leading indicators
and risk alerts will
improve their
future
performance.
10/2/2015 www.simmethod.blogspot.com 21
22. SIMMETHOD Strategy and Execution
Performance Predictive Index
The following C-Level indices
show your ability to:
• Strategize, execute and compete against
peers and the SIMMETHOD industry-
agnostic Best-In-Class and
• Are leading indicators of future business
opportunities, risk and performance.
10/2/2015 22www.simmethod.blogspot.com
23. SIMMETHOD
Best in Class league Table
•SIMMETHOD’s 2015
Strategy & Execution
Performance Predictive
Index Business
League Table
10/2/2015 www.SIMMETHOD.blogspot.com 23
24. SIMMETHOD 2015 Strategy & Execution
Performance Predictive Index
0
10
20
30
40
50
60
70
80
C-suite Success Metrics, Leading Indicators And Risk Alerts
10/2/2015 24www.SIMMETHOD.blogspot.com
Single holistic metric to measure and predict the strategy
and execution of the Best in Class
25. SIMMETHOD 2015 Strategy & Execution
Performance Predictive Index
0
5
10
15
20
25
30
35
C-suite Success Metrics, Leading Indicators And Risk Alerts
10/2/2015 25www.SIMMETHOD.blogspot.com
26. SIMMETHOD 2015 Strategy & Execution
Performance Predictive Index
-25
-20
-15
-10
-5
0
C-suite Success Metrics, Leading Indicators And Risk Alerts
10/2/2015 26www.SIMMETHOD.blogspot.com
27. SIMMETHOD 2015 Strategy & Execution
Performance Predictive Index
-70
-60
-50
-40
-30
-20
-10
0
C-suite Success Metrics, Leading Indicators And Risk Alerts
10/2/2015 27www.SIMMETHOD.blogspot.com
28. SIMMETHOD
The Way You Measure Determines
Your Results
• Measuring and predicting
Apple’s ability to strategize
and execute versus the
SIMMETHOD Best in Class
10/2/2015
www.SIMMETHOD.blogspot.com
28
33. SIMMETHOD
Apple’s Value Creation Index
10/2/2015
www.SIMMETHOD.blogspot.com
33
0
5
10
15
20
25
2012 2013 2014 2015
Avg. B-I-C SIMMETHOD
Value Creation Index
Apple SIMMETHOD
Value Creation Index
34. SIMMETHOD
Apple’s Management Controllable
Resources Index
10/2/2015
www.SIMMETHOD.blogspot.com
34
0
5
10
15
20
25
30
35
40
45
2012 2013 2014 2015
Avg. B-I-C SIMMETHOD
Management Controllable
Resources Index
Apple SIMMETHOD
Management Controllable
Resources Index
Apple’s Management Controllable Resources
Index is trending down while the SIMMETHOD
Best-In-Class are trending up
35. SIMMETHOD
Apple’s Strategy & Execution
Performance Predictive index
10/2/2015
www.SIMMETHOD.blogspot.com
35
0
10
20
30
40
50
60
2012 2013 2014 2015
Average B-I-C
SIMMETHOD Strategy/
Execution Performance
Predictive Index
Apple SIMMETHOD
Strategy/ Execution
Performance Predictive
index
36. C-Level Strategy & Execution Performance
Predictive Indices and Risk Alerts
• When the SIMMETHOD Best in
Class indices and your indices
are moving in opposite
directions, your ability to
compete weakens in proportion
to your widening gap to the
Best-In-Class
10/2/2015 www.SIMMETHOD.blogspot.com 36
37. SIMMETHOD
Apple’s Risk Index Trend Versus The
SIMMETHOD Best in Class
10/2/2015
www.SIMMETHOD.blogspot.com
37
0
2
4
6
8
10
12
14
2014 2015
Avg. B-I-C
SIMMETHOD Risk
Index
Apple
SIMMETHOD Risk
Index
Apple’s Risk Index against the B-I-C
is slightly increasing
39. SIMMETHOD
Apple’s Risk And Performance Trends
10/2/2015
www.SIMMETHOD.blogspot.com
39
0
10
20
30
40
50
60
Apple
2012
Apple
2013
Apple
2014
Apple
2015
Apple’s ability to compete
against the B-I-C has slightly
decreased in 2015
40. SIMMETHOD
Competitive Intelligence Vs. B-I-C
SIMMETHOD Index Vs. Best in Class Apple Alibaba Amazon eBay
Profit Index Pos Pos Neg Neg
Sales Index Pos Pos Neg Neg
Cash/Debt Index Neg Pos Pos Neg
Asset Index Pos Pos Pos Neg
Overheads Index Pos Pos Neg Neg
HR Index Pos Pos Neg Pos
Management Controllable Resources Index Pos Pos Pos Neg
Value Creation Index Index Pos Pos Neg Neg
Minimum Company Business Model Index Pos Pos Neg Neg
Strategy & Execution Predictive Index Pos Pos Pos Neg
Risk Index Pos Neg Neg Neg
10/2/2015
www.SIMMETHOD.blogspot.com
40
41. SIMMETHOD
And The Barron’s 500 List
• Is there a correlation between
Apple’s score in the 2015
SIMMETHOD Strategy &
Execution Best In Class and the
Barron’s 500 list?
10/2/2015 41
WWW.SIMMETHOD.BLOGSPOT.COM
42. The Barron’s 500
Based on:
• The 500 largest public companies in
the U.S. and Canada measured by
sales with a $5 Billion cut off and
covering every business sector.
10/2/2015
WWW.SIMMETHOD.BLOGSPOT.COM
42
43. Barron’s 500 Ranking Algorithm
“Barron’s seeks to identify companies
that have done the best job of
investing for growth and compares
them on the basis of three equally
weighted metrics”:
10/2/2015
WWW.SIMMETHOD.BLOGSPOT.COM
43
44. Barron’s 500 Ranking Algorithm
• “Median three-year cash-flow-based
ROI,
• Latest fiscal year change in that
measure relative to the three-year
median and
• Adjusted sales growth in the
last fiscal year”
10/2/2015
WWW.SIMMETHOD.BLOGSPOT.COM
44
45. SIMMETHOD
And The Barron’s 500 List
Apple eBay Amazon
2015 rank (1 to 500) 213 203 212
2014 rank (1 to 500) 202 91 144
Trend Neg Neg. Neg.
Sales growth (A to F) B B A
Median 3-year cash-flow based ROI (A to F) A B B
Last year change in cash-flow ROI vs. 3-year median
(A to F)
F D F
2015 Barron’s Grade Point Avg. (4 to 0) 2.33 2.33 2.33
2014 Barron’s Grade Point Avg. (4 to 0) 2.33 3 2.67
Trend Same Neg. Neg.
10/2/2015
www.SIMMETHOD.blogspot.com
45
46. SIMMETHOD B-I-C Profiles And Risk Alerts
Benchmark Your Business Vs. The B-I-C
To review a case study of Apple Inc., compare
your gap to the Best in Class and set up risk
alerts versus the following profiles:
• Profit profile
• Value profile
• Sales profile
• Human Capital profile
10/2/2015 www.SIMMETHOD.blogspot.com 46
47. SIMMETHOD’s Disclaimer
• The purpose of the SIMMETHOD Strategy &
Execution Performance Predictive Index, Best
In Class profiles and risk and opportunities
alerts is not to make a business right or
wrong but rather contribute towards the
understanding of management actions in
comparison to industry’s peers and
the SIMMETHOD Best In Class.
10/2/2015 www.SIMMETHOD.blogspot.com 47
48. SIMMETHOD’s Disclaimer
• SIMMETHOD’s Strategy & Execution
Performance Predictive Index, Best in Class
profiles and risk and opportunities alerts do
not seek to be exact (in the financial term)
but rather serve as a conduit to ask better
questions and seek better answers in the
performance improvement, risk minimization
and value creation journey.
10/2/2015 www.SIMMETHOD.blogspot.com 48
49. SIMMETHOD’s Disclaimer
• Sometimes, the value of a metric in itself
does not provide the greatest of insights, but
valuable actionable knowledge is gained
from its ability to provide a trend or a
common comparison yardstick with other
businesses across a range of
industries.
10/2/2015 www.SIMMETHOD.blogspot.com 49
50. SIMMETHOD’s Disclaimer
• This Presentation is for informational
purpose only and SIMMETHOD shall not be
liable for the contents of the Presentation or
for any damage incurred or alleged to be
incurred to any of the businesses included in
the Presentation as a result of its content.
10/2/2015 www.SIMMETHOD.blogspot.com 50
51. SIMMETHOD
Makes Your Risk And Performance More Predictable
SIMMETHOD makes your risk and performance
more predictable by aligning your strategy
and execution to the:
• Market forces where the most value is being
created and
• Success metrics of your customers in order to
directly contribute to their results
10/2/2015 WWW.SIMMETHOD.BLOGSPOT.COM 51
52. Jorge Oscar Tabacman
jtabacman@gmail.com
Twitter ID: SIMMETHOD
SIMMETHOD
A new way to measure and predict
the risk and performance of your
business and alert you of new threats
and opportunities
10/2/2015 52www.simmethod.blogspot.com