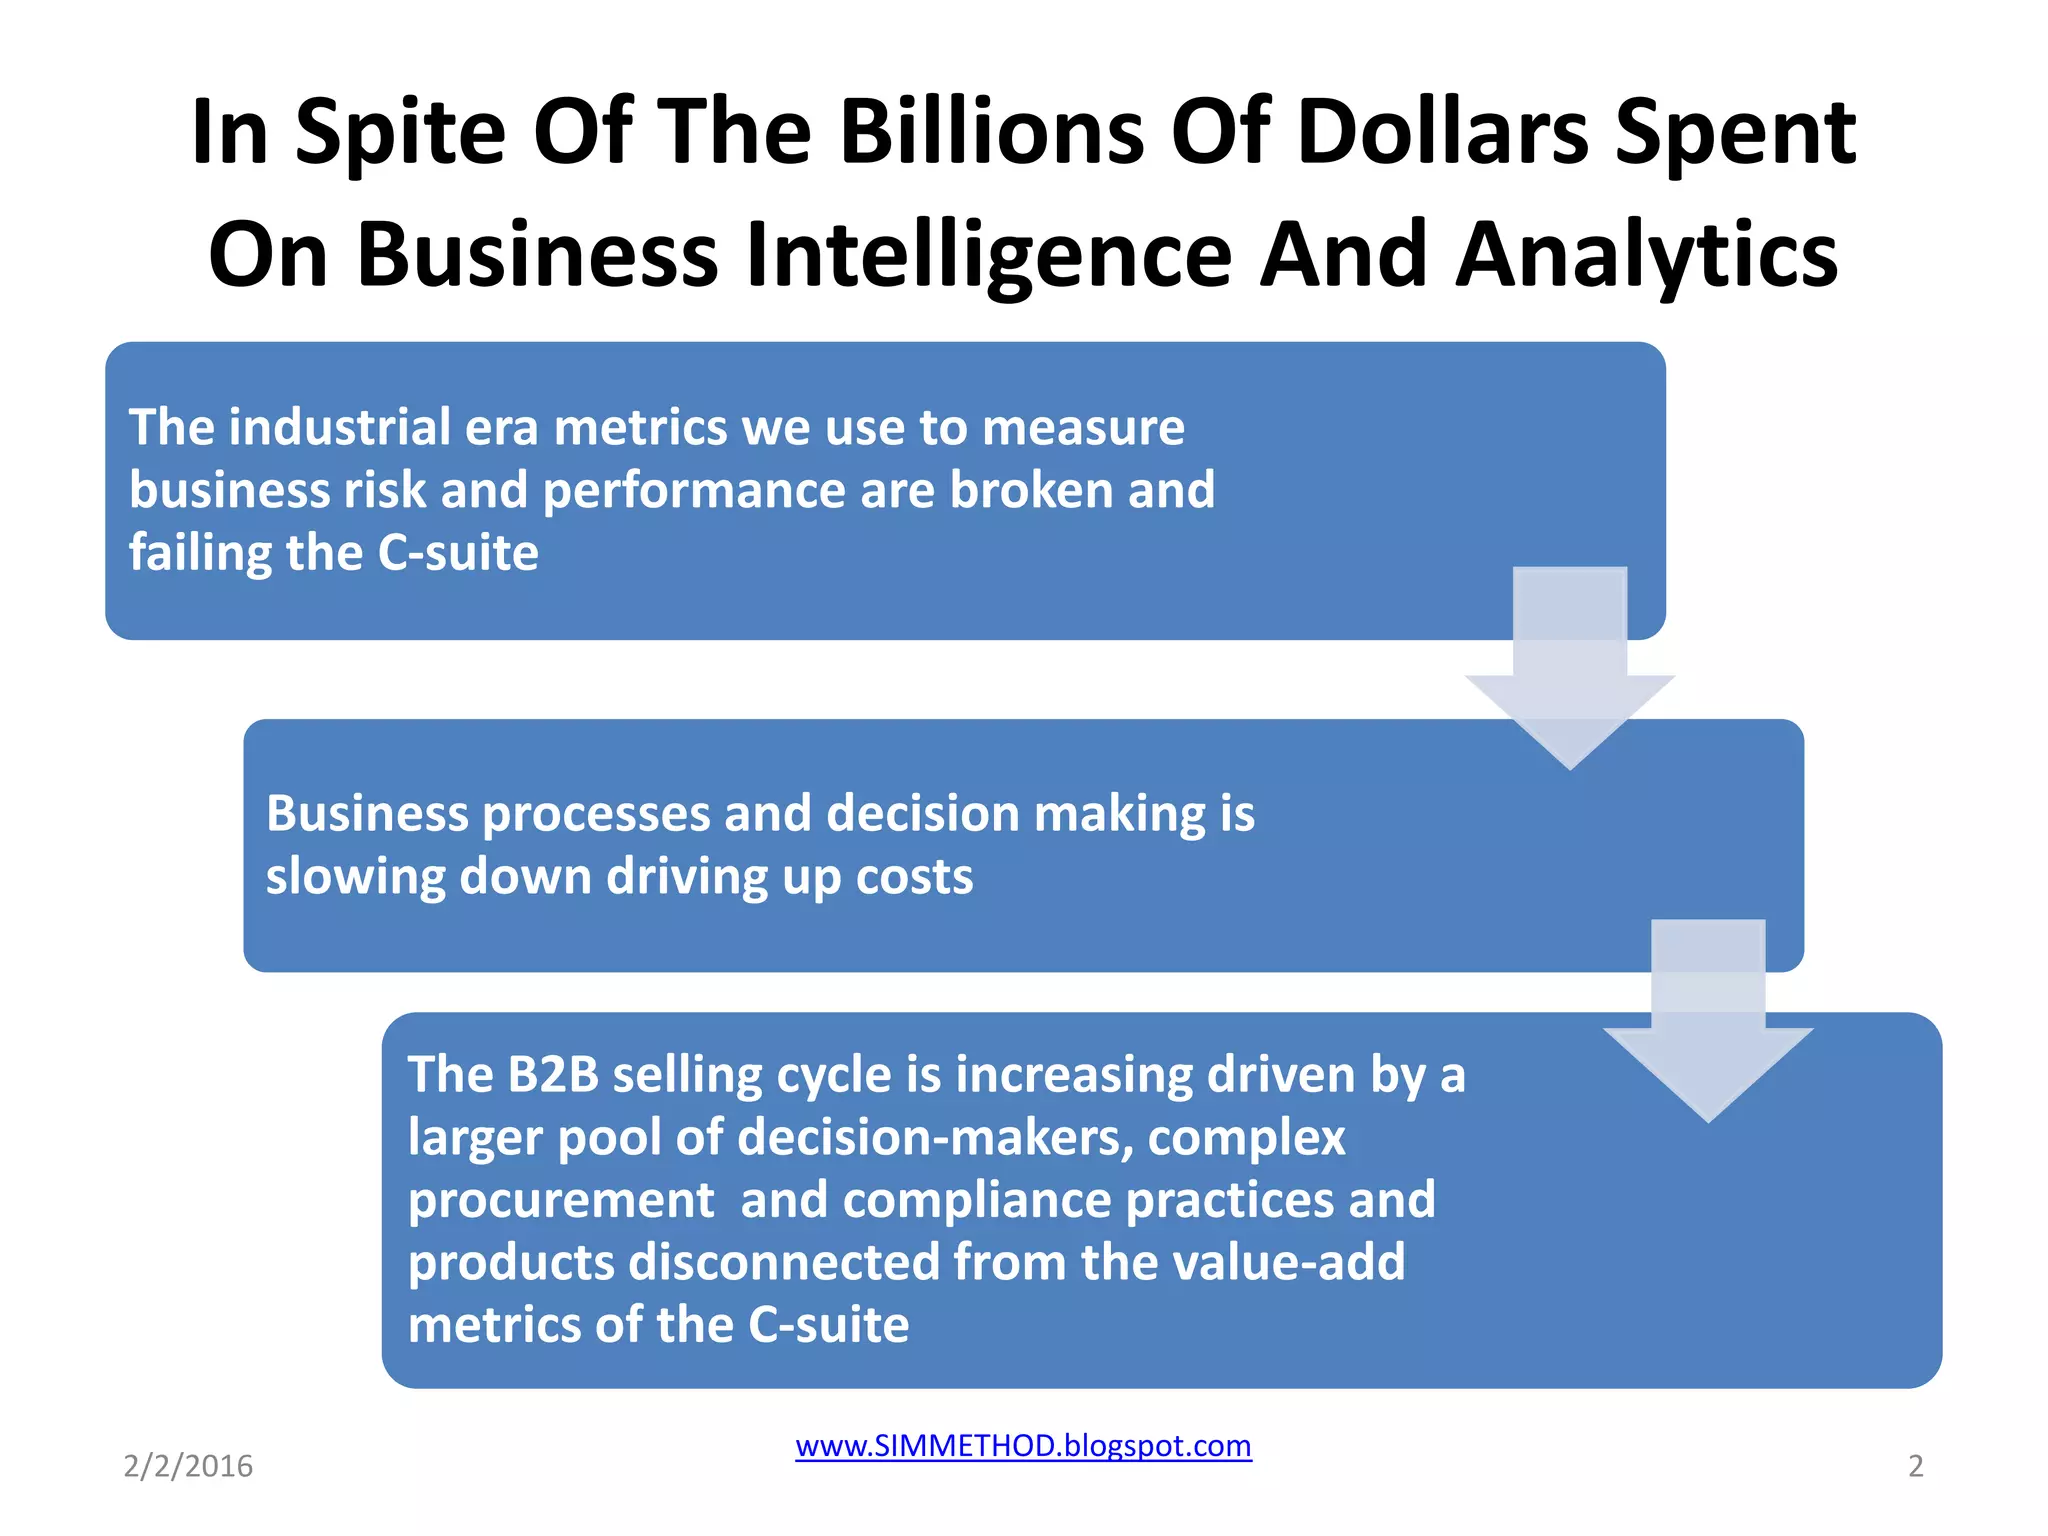
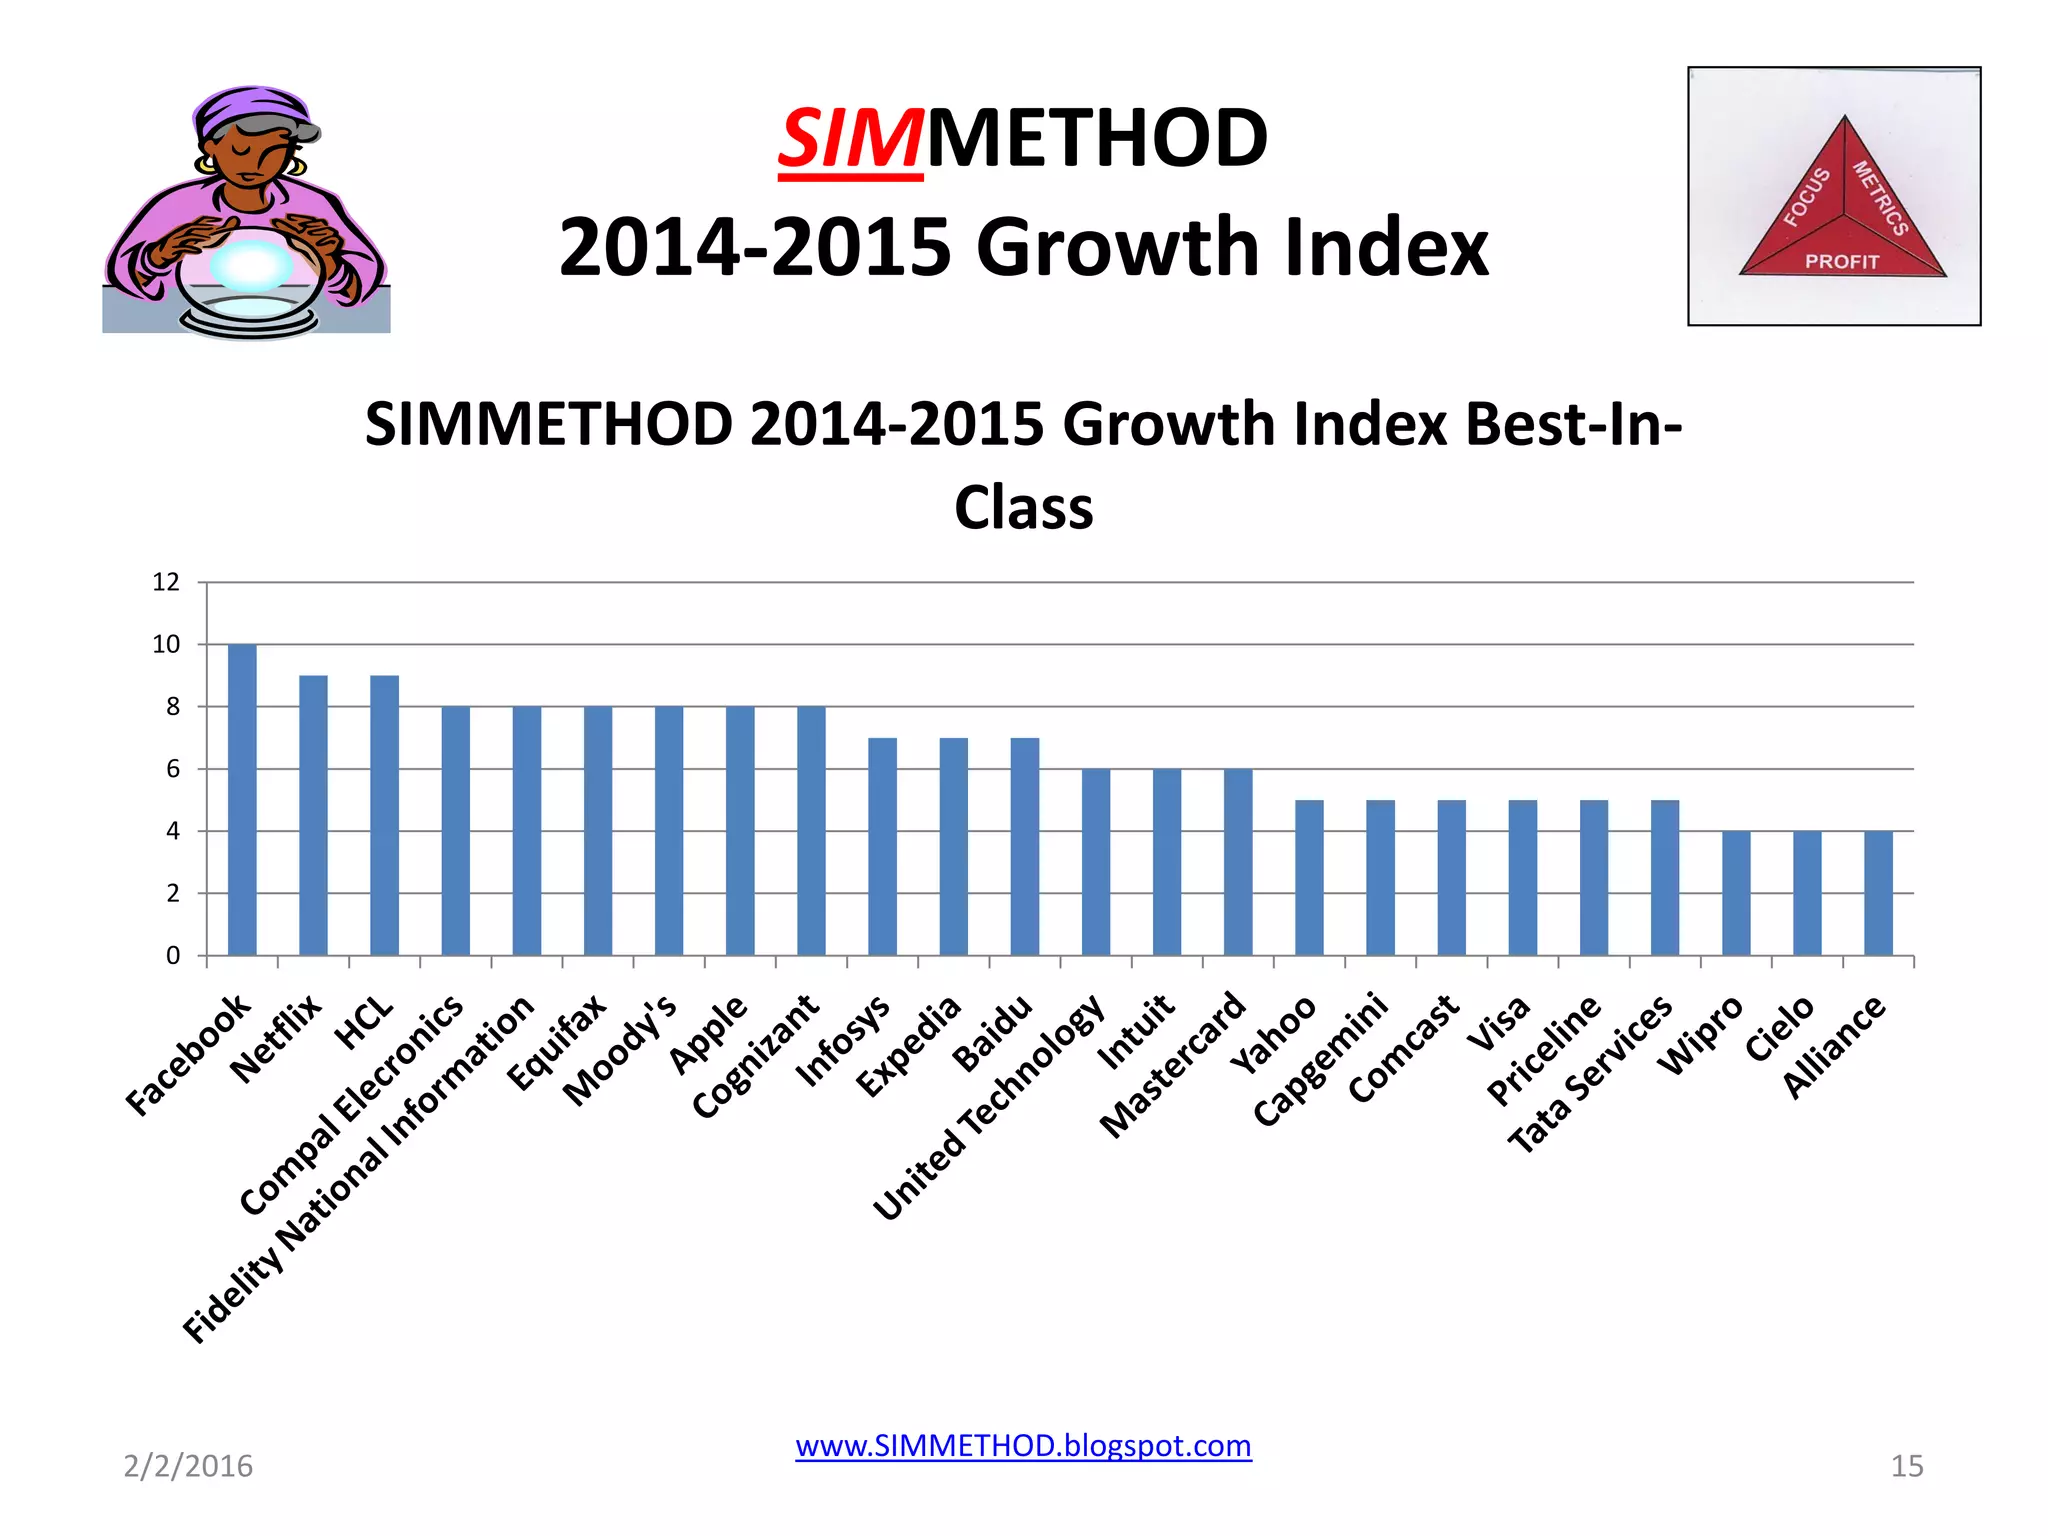
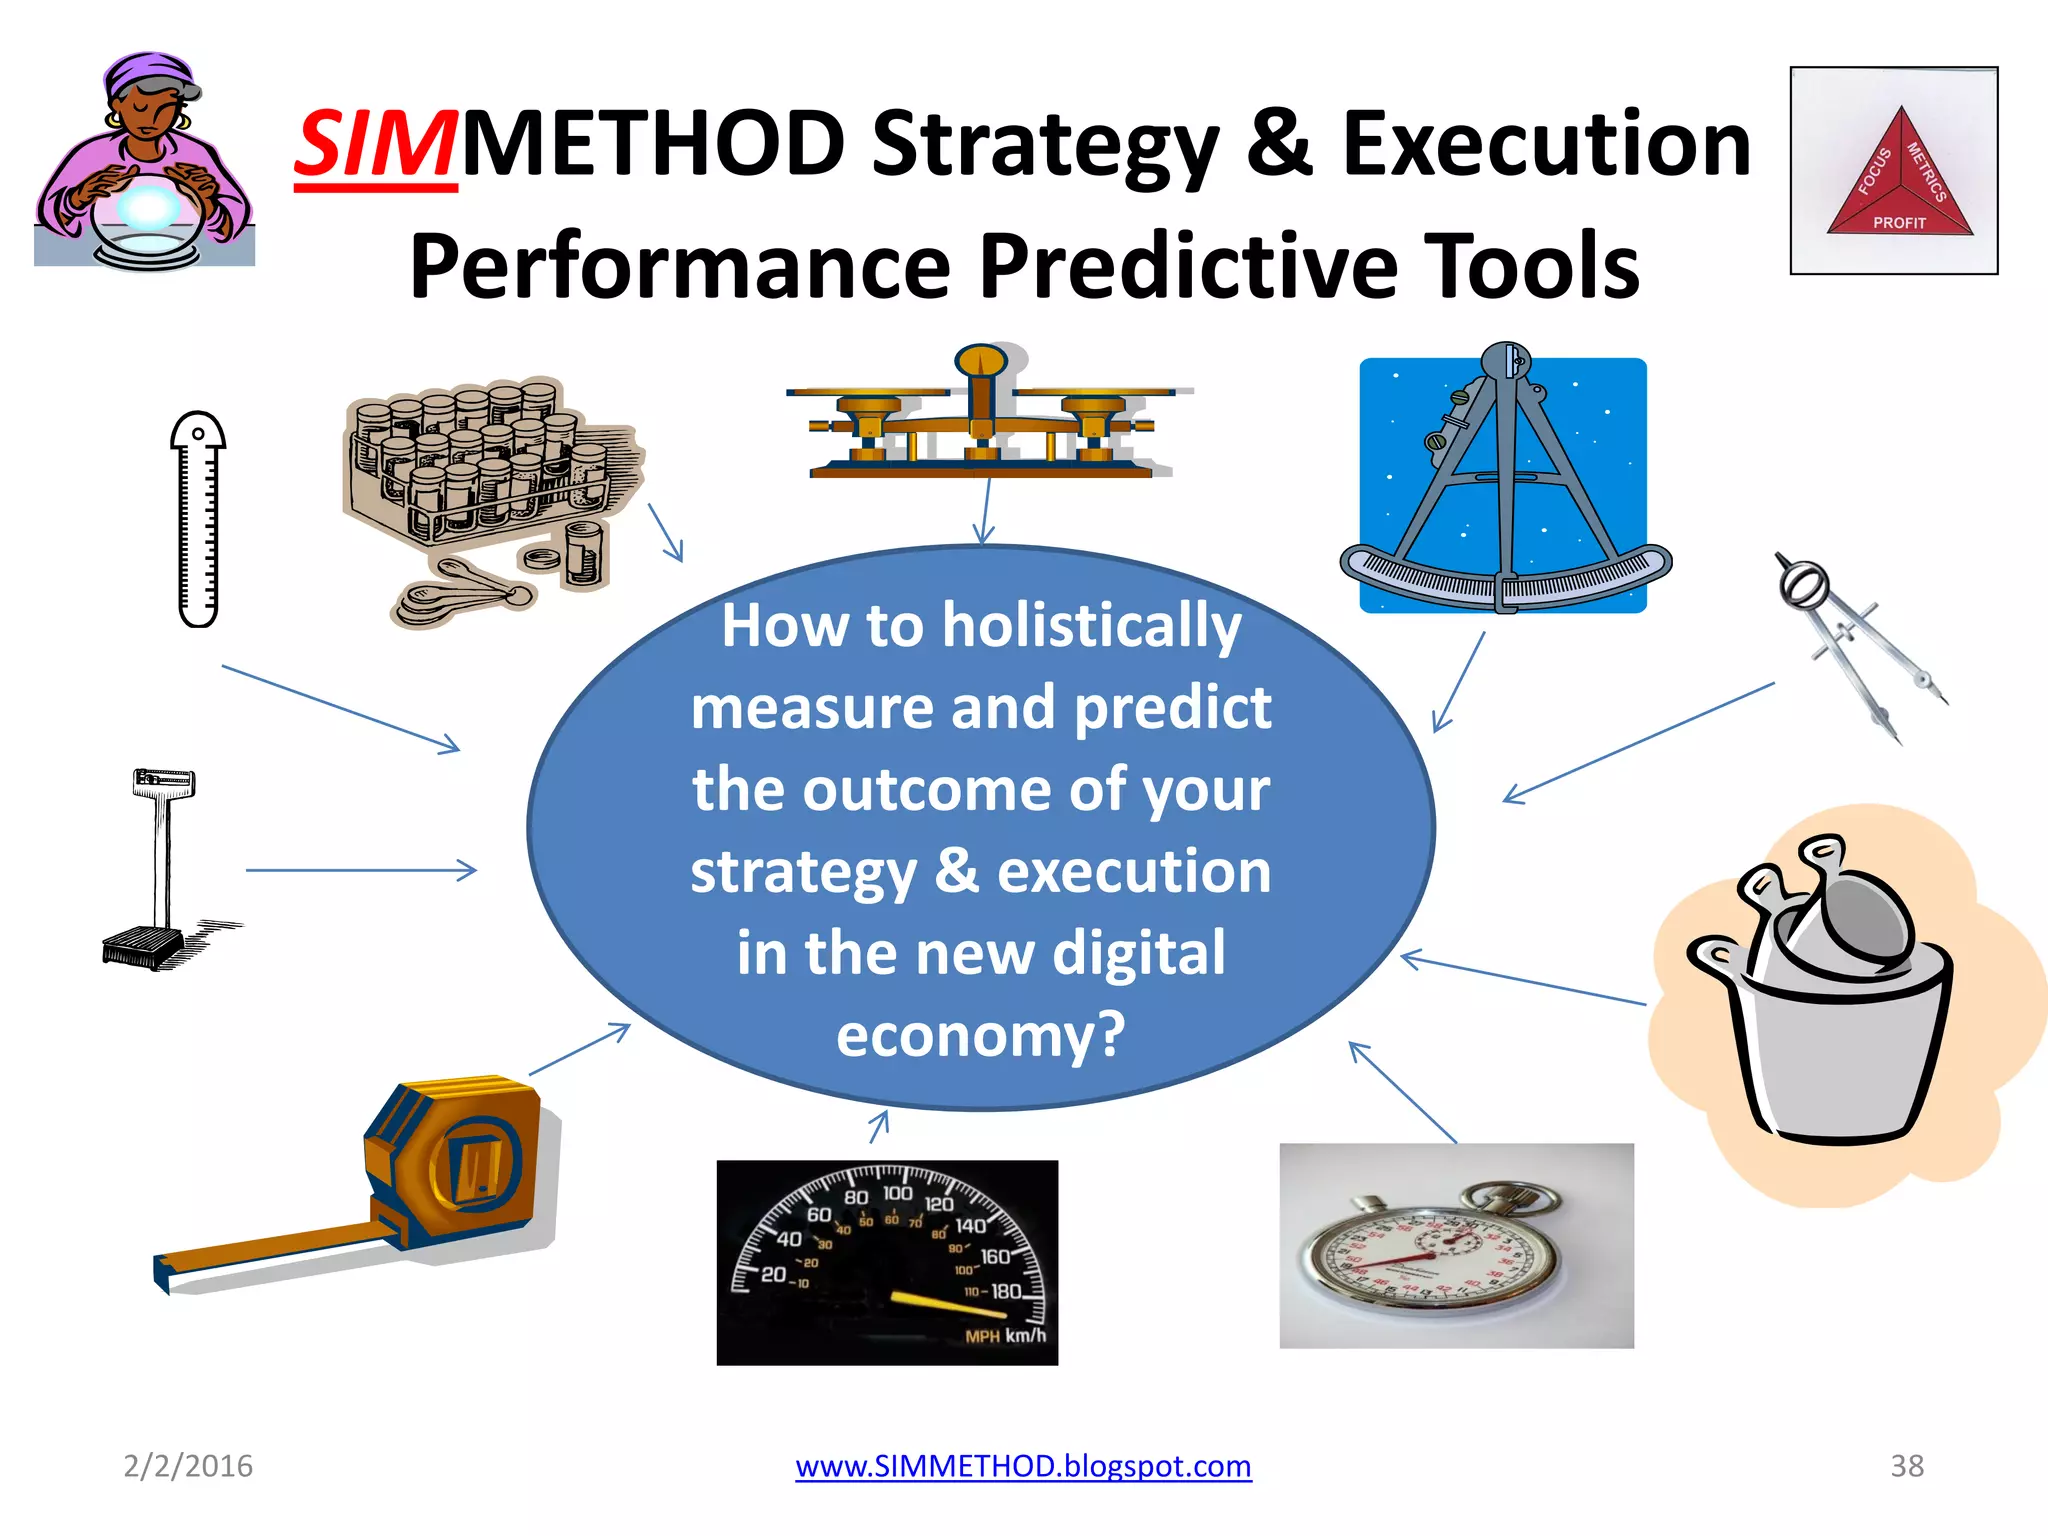
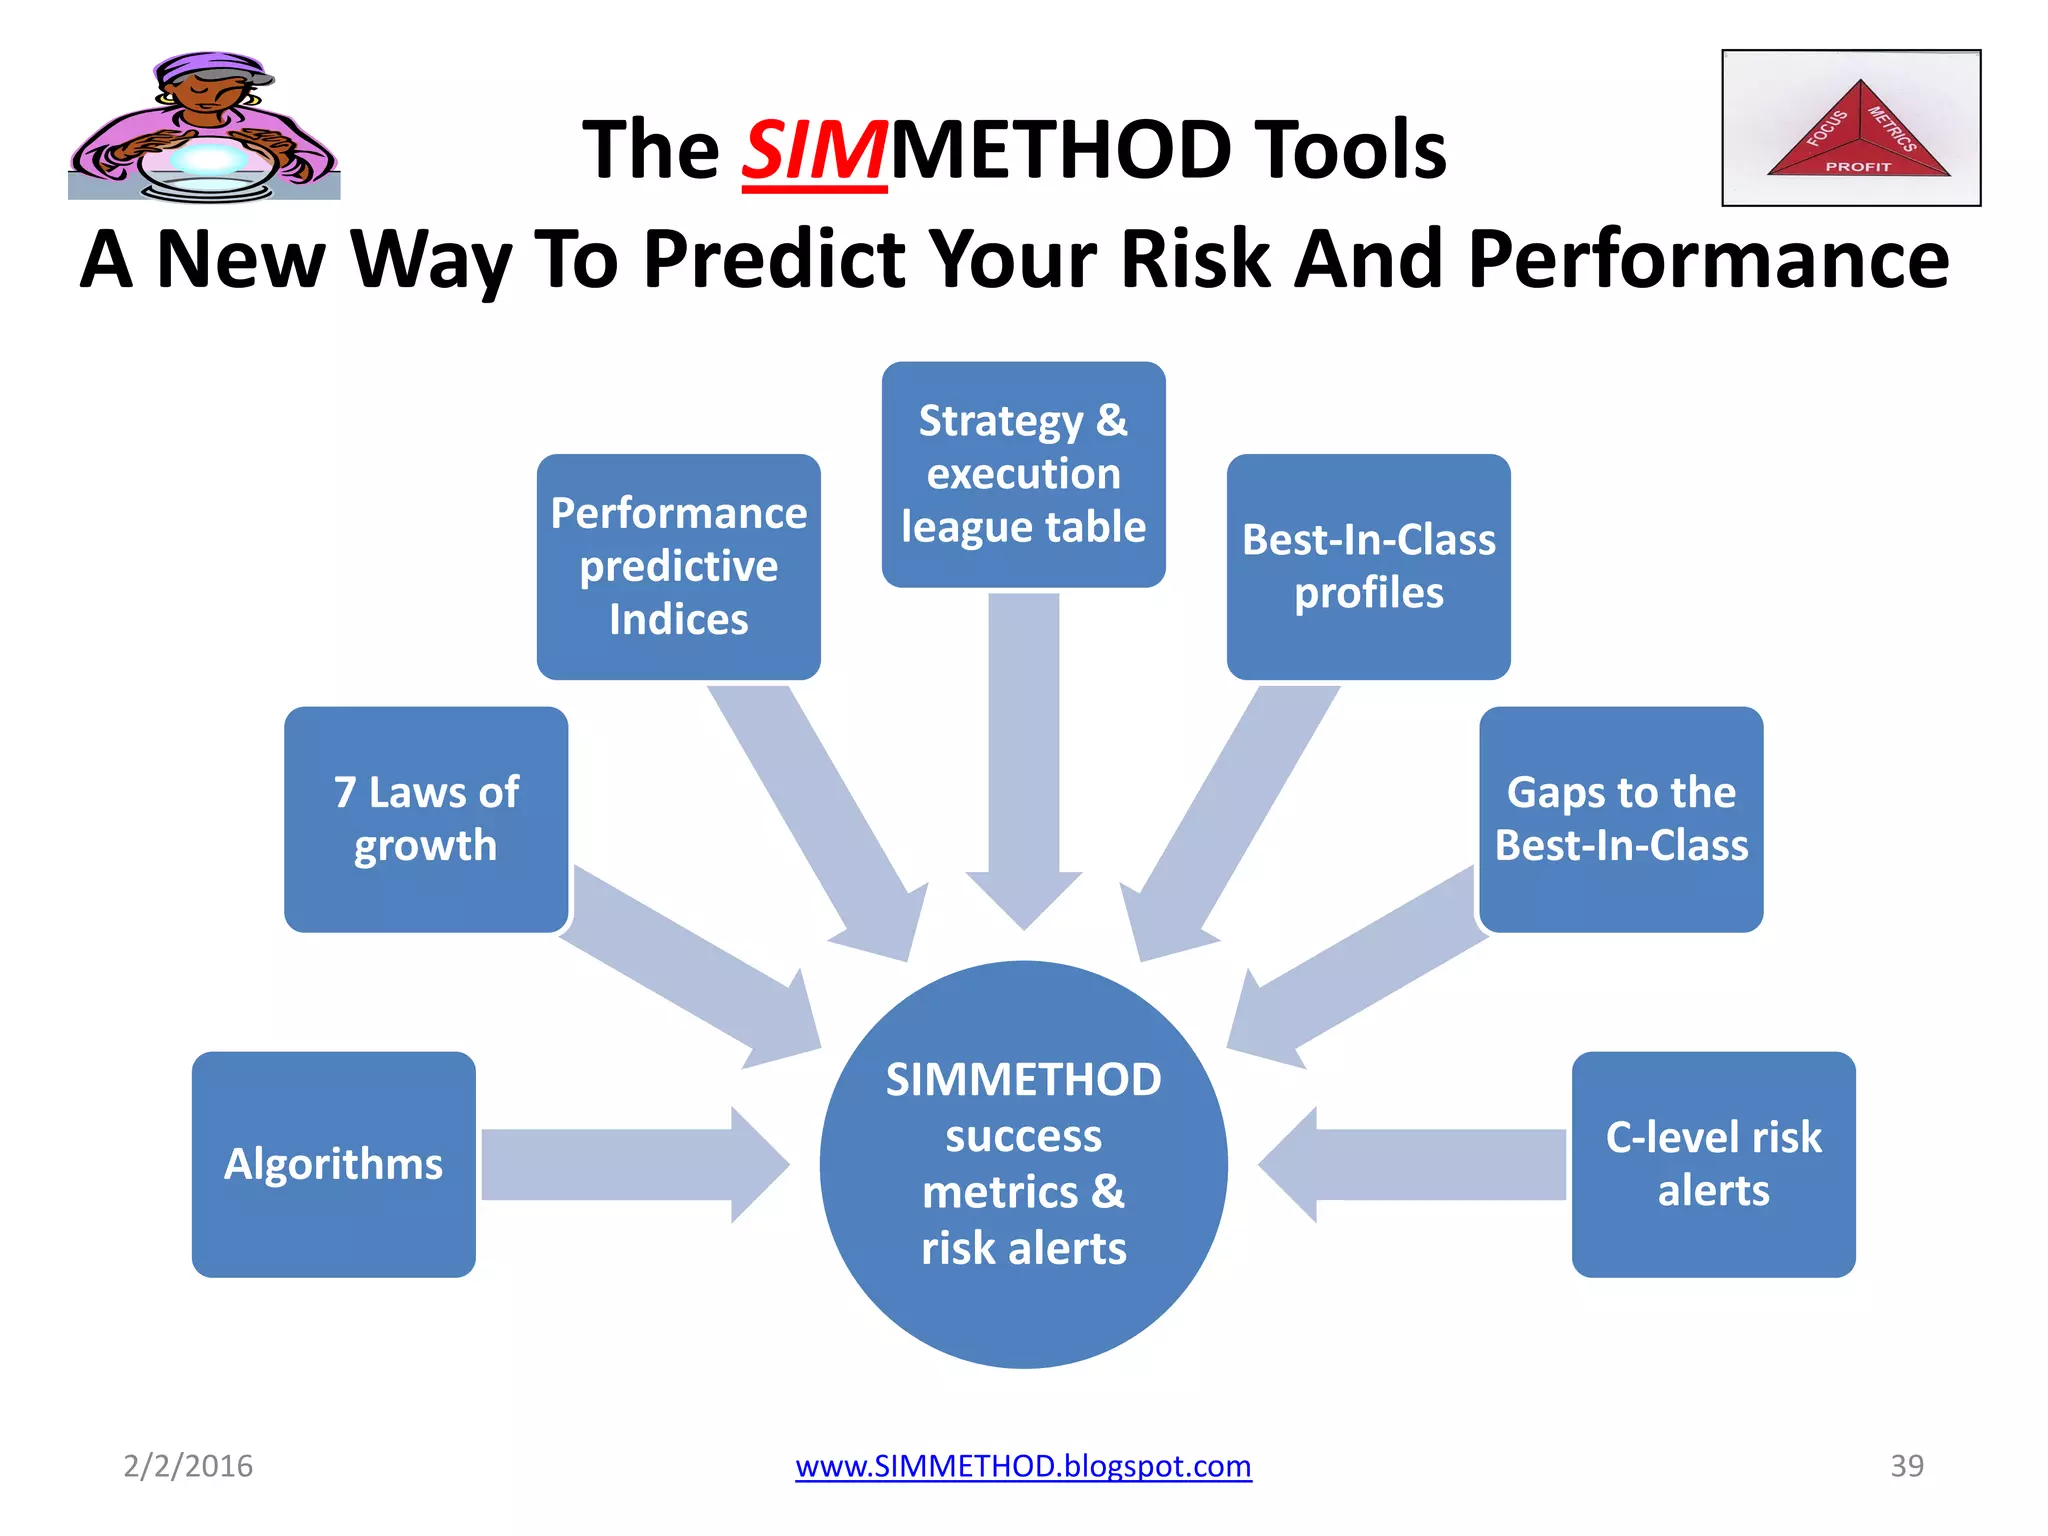
SIMMETHOD
A New Way To Measure And Predict
Your Risk And Performance In The
Industry-Agnostic Digital Economy
In Spite Of Billions Of Dollars Spent On Business
Intelligence And Analytics, The Industrial Era
Metrics We Use To Measure Business Risk And
Performance Are Broken And Failing The C-suite
2/2/2016 1www.SIMMETHOD.blogspot.com
In Spite Of The Billions Of Dollars Spent
On Business Intelligence And Analytics
The industrial era metrics we use to measure
business risk and performance are broken and
failing the C-suite
Business processes and decision making is
slowing down driving up costs
The B2B selling cycle is increasing driven by a
larger pool of decision-makers, complex
procurement and compliance practices and
products disconnected from the value-add
metrics of the C-suite
2/2/2016 2
www.SIMMETHOD.blogspot.com
SIMMETHOD
The Way We Measure Business Risk And
Performance Is Broken And Failing The C-suite
•The
evidence
2/2/2016 3
www.SIMMETHOD.blogspot.com
SIMMETHOD
Is Business Decision-Making Slowing Down?
“The idea that time is speeding up is clearly
popular. It is also plausible. There is just one
problem. It is very hard to prove that it is actually
happening”. The Economist, December 2015
“Yet hard evidence of a great acceleration is hard
to come by. The Economist has considered a
variety of measures by which the speed of
business in America can be quantified. A few do
show some acceleration. But a lot do not”. The
Economist, December 2015
2/2/2016
www.SIMMETHOD.blogspot.com
4
SIMMETHOD
Is Business Decision-Making Slowing Down?
“A better explanation of the puzzle comes from looking
more closely at the effect of information flows on
businesses. Even though the processes about which you
know more are not inherently moving faster, seeing them
in far greater detail makes it feel as if time is speeding up”.
“This unsettling sensation is common to most chief
executives—a straw poll suggests that they receive 200-400
e-mails a day”. The Economist, December 2015.
2/2/2016
www.SIMMETHOD.blogspot.com
5
SIMMETHOD
Is Business Intelligence And Analytics Failing The C-Suite?
According to Protivity Risk & Business Consulting:
• Although Board members and senior executives
receive hundreds of pages of risk and
performance related information,
• They struggle to make sense of all these deluge
of data in a way that can be converted into
actionable information.
2/2/2016 www.SIMMETHOD.blogspot.com 6
SIMMETHOD
Is Business Intelligence And Analytics Failing The C-suite?
Why The
SIMMETHOD
Success Metrics
And Risk Alerts
PWC CEOs Survey:
56% of CEOs think
cross-sector
competition is on
the rise and 59%
see more threats
Boris Evelson, VP of BI,
Forrester Research: Only
40% of structured and 31%
of unstructured data
transformed into insights
IBM CFOs Insights: 53% of
CFOs think they are not
effective at measuring and
managing performance
Deloitte CFOs
Concerns &
Insights: Predicting
your competitors’
next steps &
execution missteps
2/2/2016 7www.SIMMETHOD.blogspot.com
SIMMETHOD
Is Business Decision-Making Slowing Down?
Most business activity is slowing down, not
accelerating:
• In benchmarking the speed of key processes
across the corporate sector,
• We find again and again that decision-making
at even the most basic level has slowed
materially over the past five to ten years”.
Tom Monahan, CEB Chairman on
Fortune Jan 28, 2016.
2/2/2016 8
www.SIMMETHOD.blogspot.com
SIMMETHOD
Is Business Intelligence And Analytics Failing The C-Suite?
As stated by Tom Monahan, “things got even slower
when companies meshed processes” resulting on:
• Poorly coordinated growth of risk management,
compliance, privacy and data protection
• “Nine-fold increase in the number of different
ERM functions over the last ten years”
• “Technology misuse where 60% of employees
must consult with at least 10 colleagues each day
just to get their jobs done”
(based on 23,000 responses)
2/2/2016 9
www.SIMMETHOD.blogspot.com
SIMMETHOD
Is Business Decision-Making Slowing Down?
Why The
SIMMETHOD
Success
Metrics And
Risk Alerts
CEB Study of 400
corporate recruiters:
Hiring of new
employees now take 63
days up from 42 days in
2010
CEB Study of 2000 Project
Managers at 60 global
organizations: Avg. time to
deliver an IT project increased
from 2010 to 2015 by over a
month to 10 months
CEB B2B Surveys: Time for B2B
sales have risen by 22% and
gaining consensus has risen from 1
to 2 to 5 buyers or more
CEB Study of 2000
Project Managers:
Every month of
delay in an IT
project costs
$43,000 and up
2/2/2016 10www.SIMMETHOD.blogspot.com
SIMMETHOD
Predictive Risk And Performance
• As shown by Gartner
Research, although BI and
analytics will continue at
the top of the CIO agenda
in 2016,
• Aligning it to the C-suite
and the way you measure
(your metrics) will
determine your results.
2/2/2016 11
www.SIMMETHOD.blogspot.com
SIMMETHOD
Predictive Risk And Performance
To address the above-mentioned
concerns SIMMETHOD has developed
new predictive C-level risk and
performance metrics and alerts
specially designed for the new
industry-agnostic digital economy such
as the:
• HR Index
• Assets Index
• Overheads Index
• Cash/debt Index
2/2/2016 12
www.SIMMETHOD.blogspot.com
SIMMETHOD
Predictive Risk And Performance
• Sales Index
• Profitable Sales Index
• Value Creation Sales Index
• Growth Index
• Business Model Index
• Management Controllable Resources
Index
• Risk Index
• Strategy & Execution Performance
Predictive index
2/2/2016 13
www.SIMMETHOD.blogspot.com
SIMMETHOD
Predictive Risk And Performance
The following examples show
the relationship between
your Growth, Value
Creation, Profitable Sales,
Risk and Strategy &
Execution Performance
Predictive Indices and the
SIMMETHOD Best in Class
2/2/2016 14
www.SIMMETHOD.blogspot.com
SIMMETHOD
2014-2015 Growth Index
0
2
4
6
8
10
12
SIMMETHOD 2014-2015 Growth Index Best-In-
Class
2/2/2016 15
www.SIMMETHOD.blogspot.com
SIMMETHOD
2014-2015 Growth Index
0
0.5
1
1.5
2
2.5
SIMMETHOD 2014-2015 2nd Quartile Growth Index
2/2/2016 16
www.SIMMETHOD.blogspot.com
SIMMETHOD
2014-2015 Growth Index
-4.5
-4
-3.5
-3
-2.5
-2
-1.5
-1
-0.5
0
SIMMETHOD 2014-2015 Growth Index 3rd Quartile
2/2/2016 17
www.SIMMETHOD.blogspot.com
SIMMETHOD
2014-2015 Growth Index
-12
-10
-8
-6
-4
-2
0
SIMMETHOD 2014-2015 Growth Index 4th Quartile
2/2/2016 18
www.SIMMETHOD.blogspot.com
SIMMETHOD
Competitive Intelligence
The following two slides show 3 types of
companies:
• Positive business Growth Index with negative
Value Creation Sales Index,
• Negative Growth Index with positive Value
Creation Sales Index and
• Negative Growth Index with negative Value
Creation Sales Index versus the Best In Class
2/2/2016 19
www.SIMMETHOD.blogspot.com
SIMMETHOD
Competitive Intelligence
-12
-10
-8
-6
-4
-2
0
2
4
6
8
SIMMETHOD
B-I-C
Salesforce Oracle SAP Microsoft IBM
2014-2015 Growth Index Versus The SIMMETHOD
Best In Class
2/2/2016 20
www.SIMMETHOD.blogspot.com
SIMMETHOD
Competitive Intelligence
-12
-10
-8
-6
-4
-2
0
2
4
6
8
2014-2015 Growth
Index Versus The
SIMMETHOD Best
In Class
Value Creation
Sales Index vs.
SIMMETHOD's
B-I-C
2/2/2016 21
www.SIMMETHOD.blogspot.com
Relationship between business
growth and value created by your
sales
Best In Class companies are able to grow
and create value at the same time
SIMMETHOD Risk Index
Competitive Intelligence
2/2/2016
www.SIMMETHOD.blogspot.com
22
-12
-10
-8
-6
-4
-2
0
2
4
6
8
10
Avg. B-I-C
SIMMETHOD
Risk Index
Oracle
SIMMETHOD
Risk Index
SAP
SIMMETHOD
Risk Index
Microsoft
SIMMETHOD
Risk Index
IBM
SIMMETHOD
Risk Index
Salesforce
SIMMETHOD
Risk Index
2014
2015
As a cloud vendor, what is the risk that you
are transferring to your value chain?
Oracle & Microsoft Risk
Index are at B-I-C levels
and SAP’s Risk Index has
improved to positive
territory
SIMMETHOD
Competitive Intelligence
0
2
4
6
8
10
12
2014-2015 Growth Index Versus The SIMMETHOD Best In Class
Only Facebook, Apple and Baidu
grew at B-I-C levels
2/2/2016 23
www.SIMMETHOD.blogspot.com
SIMMETHOD
Competitive Intelligence
-3
-2
-1
0
1
2
3
4
5
6
7
Value Creation Sales Index vs. SIMMETHOD's B-I-C
Apple, Tencent, Baidu, Alibaba and
Google’s sales created value at Best In
Class levels
2/2/2016 24
www.SIMMETHOD.blogspot.com
SIMMETHOD
Competitive Intelligence
-4
-2
0
2
4
6
8
10
12
2014-2015 Growth
Index Versus The
SIMMETHOD Best
In Class
Value Creation
Sales Index vs.
SIMMETHOD's
B-I-C
2/2/2016 25
www.SIMMETHOD.blogspot.com
B-I-C companies are able to grow
and create business value at the
same time
SIMMETHOD
Competitive Intelligence
-3
-2
-1
0
1
2
3
4
5
6
7
8
SIMMETHOD
B-I-C
American
Express
Mastercard Visa Cielo
2014-2015 Growth Index Versus The SIMMETHOD Best In Class
2/2/2016 26
www.SIMMETHOD.blogspot.com
SIMMETHOD
Competitive Intelligence
-3
-2
-1
0
1
2
3
4
5
6
7
8
2014-2015 Growth
Index Versus The
SIMMETHOD Best
In Class
Value Creation
Sales Index vs.
SIMMETHOD's
B-I-C
2/2/2016 27
www.SIMMETHOD.blogspot.com
SIMMETHOD
Competitive Intelligence
-10
-8
-6
-4
-2
0
2
4
6
8
2014-2015 Growth Index Versus The SIMMETHOD Best In Class
2/2/2016 28
www.SIMMETHOD.blogspot.com
SIMMETHOD
Competitive Intelligence
-10
-8
-6
-4
-2
0
2
4
6
8
2014-2015
Growth Index
Versus The
SIMMETHOD
Best In Class
Value Creation
Sales Index vs.
SIMMETHOD's
B-I-C
B-I-C companies are
able to grow their sales
and create business
value concurrently
2/2/2016 29
www.SIMMETHOD.blogspot.com
SIMMETHOD
Competitive Intelligence
-5
-4
-3
-2
-1
0
1
2
3
4
5
6
Value Creation Sales Index vs. SIMMETHOD's B-I-C
Saudi Telecom, China Mobile
and Vivendi sales created
business value at B-I-C level
2/2/2016 30
www.SIMMETHOD.blogspot.com
Correlation Between Your SIMMETHOD Risk And
Strategy & Execution Performance Predictive Index
2/2/2016
www.SIMMETHOD.blogspot.com
31
-80
-60
-40
-20
0
20
40
60
SIMMETHOD
Risk Index (The
higher the score
the less risk)
SIMMETHOD
Strategy &
Execution
Performance
Predictive Index
Risk and predictive performance
comparison versus your peers and the
SIMMETHOD Best In Class
SIMMETHOD
Competitive Intelligence
0.00
5.00
10.00
15.00
20.00
25.00
30.00
Cigna Anthem Aetna Aetna Humana WellCare
Health
Plans
B-I-C
Profitable
Sales
Index
SIMMETHOD Profitable Sales Index
2/2/2016 32
www.SIMMETHOD.blogspot.com
Although Cigna has the highest Profitable Sales
Index, it has a negative Value Creation Sales Index
pointing to a considerable degree of inefficiency in
its business processes and metrics
SIMMETHOD
Competitive Intelligence
-5
-4
-3
-2
-1
0
1
2
3
4
Value Creation Sales Index vs. SIMMETHOD's B-I-C
Aetna with a positive Profitable
Sales Index and Value Creation
Sales Index points to a more
efficient company with a lower
cost structure
2/2/2016 33
www.SIMMETHOD.blogspot.com
Correlation Between Your SIMMETHOD Risk And
Strategy & Execution Performance Predictive Index
2/2/2016
www.SIMMETHOD.blogspot.com
34
-40
-30
-20
-10
0
10
20
30
SIMMETHOD Risk
Index (The higher
the score the less
risk)
SIMMETHOD
Strategy &
Execution
Performance
Predictive Index
Risk and predictive performance
comparison versus your peers and
the SIMMETHOD Best in Class
SIMMETHOD
•SIMMETHOD
Crowd-Sourced
Competitive Intelligence
Analytics
2/2/2016 www.SIMMETHOD.blogspot.com 35
What Are The SIMMETHOD Best In Class
And Risk Alert Tools?
• SIMMETHOD Best In Class
analytical profiles and risk alerts
tools provide you and your C-level
with a large number of levers to
reduce your risk and improve your
performance
2/2/2016 www.SIMMETHOD.blogspot.com 36
SIMMETHOD’s Trends, Gaps To The Best In
Class And Risk Alerts
• When the Best-In-Class and your
SIMMETHOD C-Level risk and
performance metrics are moving in
opposite directions, your ability to
compete weakens in proportion to
your widening gap to the
Best-In-Class.
2/2/2016 www.SIMMETHOD.blogspot.com 37
SIMMETHOD Strategy & Execution
Performance Predictive Tools
2/2/2016 www.SIMMETHOD.blogspot.com 38
How to holistically
measure and predict
the outcome of your
strategy & execution
in the new digital
economy?
The SIMMETHOD Tools
A New Way To Predict Your Risk And Performance
SIMMETHOD
success
metrics &
risk alerts
Algorithms
7 Laws of
growth
Performance
predictive
Indices
Strategy &
execution
league table Best-In-Class
profiles
Gaps to the
Best-In-Class
C-level risk
alerts
2/2/2016 www.SIMMETHOD.blogspot.com 39
SIMMETHOD Strategy and Execution
Performance Predictive Tools And Risk Alerts
Unlike data, metrics and analytics that:
• Lack market context and are silo-based,
• Are non-predictive and industry specific,
• Provide a partial view of your enterprise
• Are disconnected from the KPIS of your
customers and your C-suite
• Lack risk alerts to fend off competitors
from inside and outside your industries
2/2/2016 www.SIMMETHOD.blogspot.com 40
SIMMETHOD Strategy And Execution Performance Predictive
Tools And Risk Alerts
SIMMETHOD strategy & execution performance
predictive tools are a holistic industry-agnostic
representation of your strategy & execution to:
Measure and predict your strategy and execution versus
peers and the Best In Class,
Synchronize your products and services to the KPIS of
your customers and your C-suite
Receive C-level risk alerts linked to a competitive
intelligence database in order to fend off current and
potential future competitors.
2/2/2016 www.SIMMETHOD.blogspot.com 41
The SIMMETHOD Algorithms And The 7
Laws Of Growth And Value Creation
SIMMETHOD
7 Laws
Integration
/alignment Crowd analytics
inside/outside
your industry
Growth &
value
creation
Resource
contribution
to objectives
C-level
Predictive
performance &
risk
Averages &
positive
trends
Minimum
company
/business
model
2/2/2016 www.SIMMETHOD.blogspot.com 42
The SIMMETHOD Algorithms And The
7 Laws Of Growth And Value Creation
• Non-compliance with SIMMETHOD’s 7
Laws Of Growth And Value Creation
shows your areas of vulnerability and
risk and when applied to your
customers, it shows your opportunity to
enhance their business
value because:
2/2/2016 www.SIMMETHOD.blogspot.com 43
The SIMMETHOD Algorithms And The
7 Laws Of Growth And Value Creation
• “The real measure of your
products and services is the
value they add to your
customers”. SIMMETHOD
2/2/2016 www.SIMMETHOD.blogspot.com 44
SIMMETHOD
Crowd-Sourced Competitive Intelligence
SIMMETHOD’s Strategy
& Execution
Performance Predictive
Indices and Risk Profiles
are not deterministic.
Businesses that act
on their
SIMMETHOD
leading indicators
and risk alerts will
improve their 2016
performance.
2/2/2016 www.SIMMETHOD.blogspot.com 45
SIMMETHOD’s Disclaimer
• The purpose of the SIMMETHOD Strategy &
Execution Performance Predictive Index and
risk and opportunities alerts is not to make a
business right or wrong but rather contribute
towards the understanding of management
actions in comparison to industry’s peers and
the SIMMETHOD Best In Class.
2/2/2016 www.SIMMETHOD.blogspot.com 46
SIMMETHOD’s Disclaimer
• SIMMETHOD’s Strategy & Execution
Performance Predictive Index and risk and
opportunities alerts do not seek to be exact
but rather serve as a conduit to ask better
questions and seek better answers in the
performance improvement, risk minimization
and value creation journey.
2/2/2016 www.SIMMETHOD.blogspot.com 47
SIMMETHOD’s Disclaimer
• Sometimes, the value of a metric in itself
does not provide the greatest of insights, but
valuable actionable knowledge is gained
from its ability to provide a trend or a
common comparison yardstick with other
businesses across a range of
industries.
2/2/2016 www.SIMMETHOD.blogspot.com 48
SIMMETHOD’s Disclaimer
• This Presentation is for informational
purpose only and SIMMETHOD shall not be
liable for the contents of the Presentation or
for any damage incurred or alleged to be
incurred to any of the businesses included in
the Presentation as a result of its content.
2/2/2016 www.SIMMETHOD.blogspot.com 49
Jorge Oscar Tabacman
jtabacman@gmail.com
Twitter ID: SIMMETHOD
SIMMETHOD
A new way to measure and predict
the risk and performance of your
business and alert you of new threats
and opportunities.
2/2/2016 50www.SIMMETHOD.blogspot.com

Simmethod growth and value creation sales index

  • 1.
    SIMMETHOD A New WayTo Measure And Predict Your Risk And Performance In The Industry-Agnostic Digital Economy In Spite Of Billions Of Dollars Spent On Business Intelligence And Analytics, The Industrial Era Metrics We Use To Measure Business Risk And Performance Are Broken And Failing The C-suite 2/2/2016 1www.SIMMETHOD.blogspot.com
  • 2.
    In Spite OfThe Billions Of Dollars Spent On Business Intelligence And Analytics The industrial era metrics we use to measure business risk and performance are broken and failing the C-suite Business processes and decision making is slowing down driving up costs The B2B selling cycle is increasing driven by a larger pool of decision-makers, complex procurement and compliance practices and products disconnected from the value-add metrics of the C-suite 2/2/2016 2 www.SIMMETHOD.blogspot.com
  • 3.
    SIMMETHOD The Way WeMeasure Business Risk And Performance Is Broken And Failing The C-suite •The evidence 2/2/2016 3 www.SIMMETHOD.blogspot.com
  • 4.
    SIMMETHOD Is Business Decision-MakingSlowing Down? “The idea that time is speeding up is clearly popular. It is also plausible. There is just one problem. It is very hard to prove that it is actually happening”. The Economist, December 2015 “Yet hard evidence of a great acceleration is hard to come by. The Economist has considered a variety of measures by which the speed of business in America can be quantified. A few do show some acceleration. But a lot do not”. The Economist, December 2015 2/2/2016 www.SIMMETHOD.blogspot.com 4
  • 5.
    SIMMETHOD Is Business Decision-MakingSlowing Down? “A better explanation of the puzzle comes from looking more closely at the effect of information flows on businesses. Even though the processes about which you know more are not inherently moving faster, seeing them in far greater detail makes it feel as if time is speeding up”. “This unsettling sensation is common to most chief executives—a straw poll suggests that they receive 200-400 e-mails a day”. The Economist, December 2015. 2/2/2016 www.SIMMETHOD.blogspot.com 5
  • 6.
    SIMMETHOD Is Business IntelligenceAnd Analytics Failing The C-Suite? According to Protivity Risk & Business Consulting: • Although Board members and senior executives receive hundreds of pages of risk and performance related information, • They struggle to make sense of all these deluge of data in a way that can be converted into actionable information. 2/2/2016 www.SIMMETHOD.blogspot.com 6
  • 7.
    SIMMETHOD Is Business IntelligenceAnd Analytics Failing The C-suite? Why The SIMMETHOD Success Metrics And Risk Alerts PWC CEOs Survey: 56% of CEOs think cross-sector competition is on the rise and 59% see more threats Boris Evelson, VP of BI, Forrester Research: Only 40% of structured and 31% of unstructured data transformed into insights IBM CFOs Insights: 53% of CFOs think they are not effective at measuring and managing performance Deloitte CFOs Concerns & Insights: Predicting your competitors’ next steps & execution missteps 2/2/2016 7www.SIMMETHOD.blogspot.com
  • 8.
    SIMMETHOD Is Business Decision-MakingSlowing Down? Most business activity is slowing down, not accelerating: • In benchmarking the speed of key processes across the corporate sector, • We find again and again that decision-making at even the most basic level has slowed materially over the past five to ten years”. Tom Monahan, CEB Chairman on Fortune Jan 28, 2016. 2/2/2016 8 www.SIMMETHOD.blogspot.com
  • 9.
    SIMMETHOD Is Business IntelligenceAnd Analytics Failing The C-Suite? As stated by Tom Monahan, “things got even slower when companies meshed processes” resulting on: • Poorly coordinated growth of risk management, compliance, privacy and data protection • “Nine-fold increase in the number of different ERM functions over the last ten years” • “Technology misuse where 60% of employees must consult with at least 10 colleagues each day just to get their jobs done” (based on 23,000 responses) 2/2/2016 9 www.SIMMETHOD.blogspot.com
  • 10.
    SIMMETHOD Is Business Decision-MakingSlowing Down? Why The SIMMETHOD Success Metrics And Risk Alerts CEB Study of 400 corporate recruiters: Hiring of new employees now take 63 days up from 42 days in 2010 CEB Study of 2000 Project Managers at 60 global organizations: Avg. time to deliver an IT project increased from 2010 to 2015 by over a month to 10 months CEB B2B Surveys: Time for B2B sales have risen by 22% and gaining consensus has risen from 1 to 2 to 5 buyers or more CEB Study of 2000 Project Managers: Every month of delay in an IT project costs $43,000 and up 2/2/2016 10www.SIMMETHOD.blogspot.com
  • 11.
    SIMMETHOD Predictive Risk AndPerformance • As shown by Gartner Research, although BI and analytics will continue at the top of the CIO agenda in 2016, • Aligning it to the C-suite and the way you measure (your metrics) will determine your results. 2/2/2016 11 www.SIMMETHOD.blogspot.com
  • 12.
    SIMMETHOD Predictive Risk AndPerformance To address the above-mentioned concerns SIMMETHOD has developed new predictive C-level risk and performance metrics and alerts specially designed for the new industry-agnostic digital economy such as the: • HR Index • Assets Index • Overheads Index • Cash/debt Index 2/2/2016 12 www.SIMMETHOD.blogspot.com
  • 13.
    SIMMETHOD Predictive Risk AndPerformance • Sales Index • Profitable Sales Index • Value Creation Sales Index • Growth Index • Business Model Index • Management Controllable Resources Index • Risk Index • Strategy & Execution Performance Predictive index 2/2/2016 13 www.SIMMETHOD.blogspot.com
  • 14.
    SIMMETHOD Predictive Risk AndPerformance The following examples show the relationship between your Growth, Value Creation, Profitable Sales, Risk and Strategy & Execution Performance Predictive Indices and the SIMMETHOD Best in Class 2/2/2016 14 www.SIMMETHOD.blogspot.com
  • 15.
    SIMMETHOD 2014-2015 Growth Index 0 2 4 6 8 10 12 SIMMETHOD2014-2015 Growth Index Best-In- Class 2/2/2016 15 www.SIMMETHOD.blogspot.com
  • 16.
    SIMMETHOD 2014-2015 Growth Index 0 0.5 1 1.5 2 2.5 SIMMETHOD2014-2015 2nd Quartile Growth Index 2/2/2016 16 www.SIMMETHOD.blogspot.com
  • 17.
    SIMMETHOD 2014-2015 Growth Index -4.5 -4 -3.5 -3 -2.5 -2 -1.5 -1 -0.5 0 SIMMETHOD2014-2015 Growth Index 3rd Quartile 2/2/2016 17 www.SIMMETHOD.blogspot.com
  • 18.
    SIMMETHOD 2014-2015 Growth Index -12 -10 -8 -6 -4 -2 0 SIMMETHOD2014-2015 Growth Index 4th Quartile 2/2/2016 18 www.SIMMETHOD.blogspot.com
  • 19.
    SIMMETHOD Competitive Intelligence The followingtwo slides show 3 types of companies: • Positive business Growth Index with negative Value Creation Sales Index, • Negative Growth Index with positive Value Creation Sales Index and • Negative Growth Index with negative Value Creation Sales Index versus the Best In Class 2/2/2016 19 www.SIMMETHOD.blogspot.com
  • 20.
    SIMMETHOD Competitive Intelligence -12 -10 -8 -6 -4 -2 0 2 4 6 8 SIMMETHOD B-I-C Salesforce OracleSAP Microsoft IBM 2014-2015 Growth Index Versus The SIMMETHOD Best In Class 2/2/2016 20 www.SIMMETHOD.blogspot.com
  • 21.
    SIMMETHOD Competitive Intelligence -12 -10 -8 -6 -4 -2 0 2 4 6 8 2014-2015 Growth IndexVersus The SIMMETHOD Best In Class Value Creation Sales Index vs. SIMMETHOD's B-I-C 2/2/2016 21 www.SIMMETHOD.blogspot.com Relationship between business growth and value created by your sales Best In Class companies are able to grow and create value at the same time
  • 22.
    SIMMETHOD Risk Index CompetitiveIntelligence 2/2/2016 www.SIMMETHOD.blogspot.com 22 -12 -10 -8 -6 -4 -2 0 2 4 6 8 10 Avg. B-I-C SIMMETHOD Risk Index Oracle SIMMETHOD Risk Index SAP SIMMETHOD Risk Index Microsoft SIMMETHOD Risk Index IBM SIMMETHOD Risk Index Salesforce SIMMETHOD Risk Index 2014 2015 As a cloud vendor, what is the risk that you are transferring to your value chain? Oracle & Microsoft Risk Index are at B-I-C levels and SAP’s Risk Index has improved to positive territory
  • 23.
    SIMMETHOD Competitive Intelligence 0 2 4 6 8 10 12 2014-2015 GrowthIndex Versus The SIMMETHOD Best In Class Only Facebook, Apple and Baidu grew at B-I-C levels 2/2/2016 23 www.SIMMETHOD.blogspot.com
  • 24.
    SIMMETHOD Competitive Intelligence -3 -2 -1 0 1 2 3 4 5 6 7 Value CreationSales Index vs. SIMMETHOD's B-I-C Apple, Tencent, Baidu, Alibaba and Google’s sales created value at Best In Class levels 2/2/2016 24 www.SIMMETHOD.blogspot.com
  • 25.
    SIMMETHOD Competitive Intelligence -4 -2 0 2 4 6 8 10 12 2014-2015 Growth IndexVersus The SIMMETHOD Best In Class Value Creation Sales Index vs. SIMMETHOD's B-I-C 2/2/2016 25 www.SIMMETHOD.blogspot.com B-I-C companies are able to grow and create business value at the same time
  • 26.
    SIMMETHOD Competitive Intelligence -3 -2 -1 0 1 2 3 4 5 6 7 8 SIMMETHOD B-I-C American Express Mastercard VisaCielo 2014-2015 Growth Index Versus The SIMMETHOD Best In Class 2/2/2016 26 www.SIMMETHOD.blogspot.com
  • 27.
    SIMMETHOD Competitive Intelligence -3 -2 -1 0 1 2 3 4 5 6 7 8 2014-2015 Growth IndexVersus The SIMMETHOD Best In Class Value Creation Sales Index vs. SIMMETHOD's B-I-C 2/2/2016 27 www.SIMMETHOD.blogspot.com
  • 28.
    SIMMETHOD Competitive Intelligence -10 -8 -6 -4 -2 0 2 4 6 8 2014-2015 GrowthIndex Versus The SIMMETHOD Best In Class 2/2/2016 28 www.SIMMETHOD.blogspot.com
  • 29.
    SIMMETHOD Competitive Intelligence -10 -8 -6 -4 -2 0 2 4 6 8 2014-2015 Growth Index VersusThe SIMMETHOD Best In Class Value Creation Sales Index vs. SIMMETHOD's B-I-C B-I-C companies are able to grow their sales and create business value concurrently 2/2/2016 29 www.SIMMETHOD.blogspot.com
  • 30.
    SIMMETHOD Competitive Intelligence -5 -4 -3 -2 -1 0 1 2 3 4 5 6 Value CreationSales Index vs. SIMMETHOD's B-I-C Saudi Telecom, China Mobile and Vivendi sales created business value at B-I-C level 2/2/2016 30 www.SIMMETHOD.blogspot.com
  • 31.
    Correlation Between YourSIMMETHOD Risk And Strategy & Execution Performance Predictive Index 2/2/2016 www.SIMMETHOD.blogspot.com 31 -80 -60 -40 -20 0 20 40 60 SIMMETHOD Risk Index (The higher the score the less risk) SIMMETHOD Strategy & Execution Performance Predictive Index Risk and predictive performance comparison versus your peers and the SIMMETHOD Best In Class
  • 32.
    SIMMETHOD Competitive Intelligence 0.00 5.00 10.00 15.00 20.00 25.00 30.00 Cigna AnthemAetna Aetna Humana WellCare Health Plans B-I-C Profitable Sales Index SIMMETHOD Profitable Sales Index 2/2/2016 32 www.SIMMETHOD.blogspot.com Although Cigna has the highest Profitable Sales Index, it has a negative Value Creation Sales Index pointing to a considerable degree of inefficiency in its business processes and metrics
  • 33.
    SIMMETHOD Competitive Intelligence -5 -4 -3 -2 -1 0 1 2 3 4 Value CreationSales Index vs. SIMMETHOD's B-I-C Aetna with a positive Profitable Sales Index and Value Creation Sales Index points to a more efficient company with a lower cost structure 2/2/2016 33 www.SIMMETHOD.blogspot.com
  • 34.
    Correlation Between YourSIMMETHOD Risk And Strategy & Execution Performance Predictive Index 2/2/2016 www.SIMMETHOD.blogspot.com 34 -40 -30 -20 -10 0 10 20 30 SIMMETHOD Risk Index (The higher the score the less risk) SIMMETHOD Strategy & Execution Performance Predictive Index Risk and predictive performance comparison versus your peers and the SIMMETHOD Best in Class
  • 35.
  • 36.
    What Are TheSIMMETHOD Best In Class And Risk Alert Tools? • SIMMETHOD Best In Class analytical profiles and risk alerts tools provide you and your C-level with a large number of levers to reduce your risk and improve your performance 2/2/2016 www.SIMMETHOD.blogspot.com 36
  • 37.
    SIMMETHOD’s Trends, GapsTo The Best In Class And Risk Alerts • When the Best-In-Class and your SIMMETHOD C-Level risk and performance metrics are moving in opposite directions, your ability to compete weakens in proportion to your widening gap to the Best-In-Class. 2/2/2016 www.SIMMETHOD.blogspot.com 37
  • 38.
    SIMMETHOD Strategy &Execution Performance Predictive Tools 2/2/2016 www.SIMMETHOD.blogspot.com 38 How to holistically measure and predict the outcome of your strategy & execution in the new digital economy?
  • 39.
    The SIMMETHOD Tools ANew Way To Predict Your Risk And Performance SIMMETHOD success metrics & risk alerts Algorithms 7 Laws of growth Performance predictive Indices Strategy & execution league table Best-In-Class profiles Gaps to the Best-In-Class C-level risk alerts 2/2/2016 www.SIMMETHOD.blogspot.com 39
  • 40.
    SIMMETHOD Strategy andExecution Performance Predictive Tools And Risk Alerts Unlike data, metrics and analytics that: • Lack market context and are silo-based, • Are non-predictive and industry specific, • Provide a partial view of your enterprise • Are disconnected from the KPIS of your customers and your C-suite • Lack risk alerts to fend off competitors from inside and outside your industries 2/2/2016 www.SIMMETHOD.blogspot.com 40
  • 41.
    SIMMETHOD Strategy AndExecution Performance Predictive Tools And Risk Alerts SIMMETHOD strategy & execution performance predictive tools are a holistic industry-agnostic representation of your strategy & execution to: Measure and predict your strategy and execution versus peers and the Best In Class, Synchronize your products and services to the KPIS of your customers and your C-suite Receive C-level risk alerts linked to a competitive intelligence database in order to fend off current and potential future competitors. 2/2/2016 www.SIMMETHOD.blogspot.com 41
  • 42.
    The SIMMETHOD AlgorithmsAnd The 7 Laws Of Growth And Value Creation SIMMETHOD 7 Laws Integration /alignment Crowd analytics inside/outside your industry Growth & value creation Resource contribution to objectives C-level Predictive performance & risk Averages & positive trends Minimum company /business model 2/2/2016 www.SIMMETHOD.blogspot.com 42
  • 43.
    The SIMMETHOD AlgorithmsAnd The 7 Laws Of Growth And Value Creation • Non-compliance with SIMMETHOD’s 7 Laws Of Growth And Value Creation shows your areas of vulnerability and risk and when applied to your customers, it shows your opportunity to enhance their business value because: 2/2/2016 www.SIMMETHOD.blogspot.com 43
  • 44.
    The SIMMETHOD AlgorithmsAnd The 7 Laws Of Growth And Value Creation • “The real measure of your products and services is the value they add to your customers”. SIMMETHOD 2/2/2016 www.SIMMETHOD.blogspot.com 44
  • 45.
    SIMMETHOD Crowd-Sourced Competitive Intelligence SIMMETHOD’sStrategy & Execution Performance Predictive Indices and Risk Profiles are not deterministic. Businesses that act on their SIMMETHOD leading indicators and risk alerts will improve their 2016 performance. 2/2/2016 www.SIMMETHOD.blogspot.com 45
  • 46.
    SIMMETHOD’s Disclaimer • Thepurpose of the SIMMETHOD Strategy & Execution Performance Predictive Index and risk and opportunities alerts is not to make a business right or wrong but rather contribute towards the understanding of management actions in comparison to industry’s peers and the SIMMETHOD Best In Class. 2/2/2016 www.SIMMETHOD.blogspot.com 46
  • 47.
    SIMMETHOD’s Disclaimer • SIMMETHOD’sStrategy & Execution Performance Predictive Index and risk and opportunities alerts do not seek to be exact but rather serve as a conduit to ask better questions and seek better answers in the performance improvement, risk minimization and value creation journey. 2/2/2016 www.SIMMETHOD.blogspot.com 47
  • 48.
    SIMMETHOD’s Disclaimer • Sometimes,the value of a metric in itself does not provide the greatest of insights, but valuable actionable knowledge is gained from its ability to provide a trend or a common comparison yardstick with other businesses across a range of industries. 2/2/2016 www.SIMMETHOD.blogspot.com 48
  • 49.
    SIMMETHOD’s Disclaimer • ThisPresentation is for informational purpose only and SIMMETHOD shall not be liable for the contents of the Presentation or for any damage incurred or alleged to be incurred to any of the businesses included in the Presentation as a result of its content. 2/2/2016 www.SIMMETHOD.blogspot.com 49
  • 50.
    Jorge Oscar Tabacman jtabacman@gmail.com TwitterID: SIMMETHOD SIMMETHOD A new way to measure and predict the risk and performance of your business and alert you of new threats and opportunities. 2/2/2016 50www.SIMMETHOD.blogspot.com