Downloaded 29 times

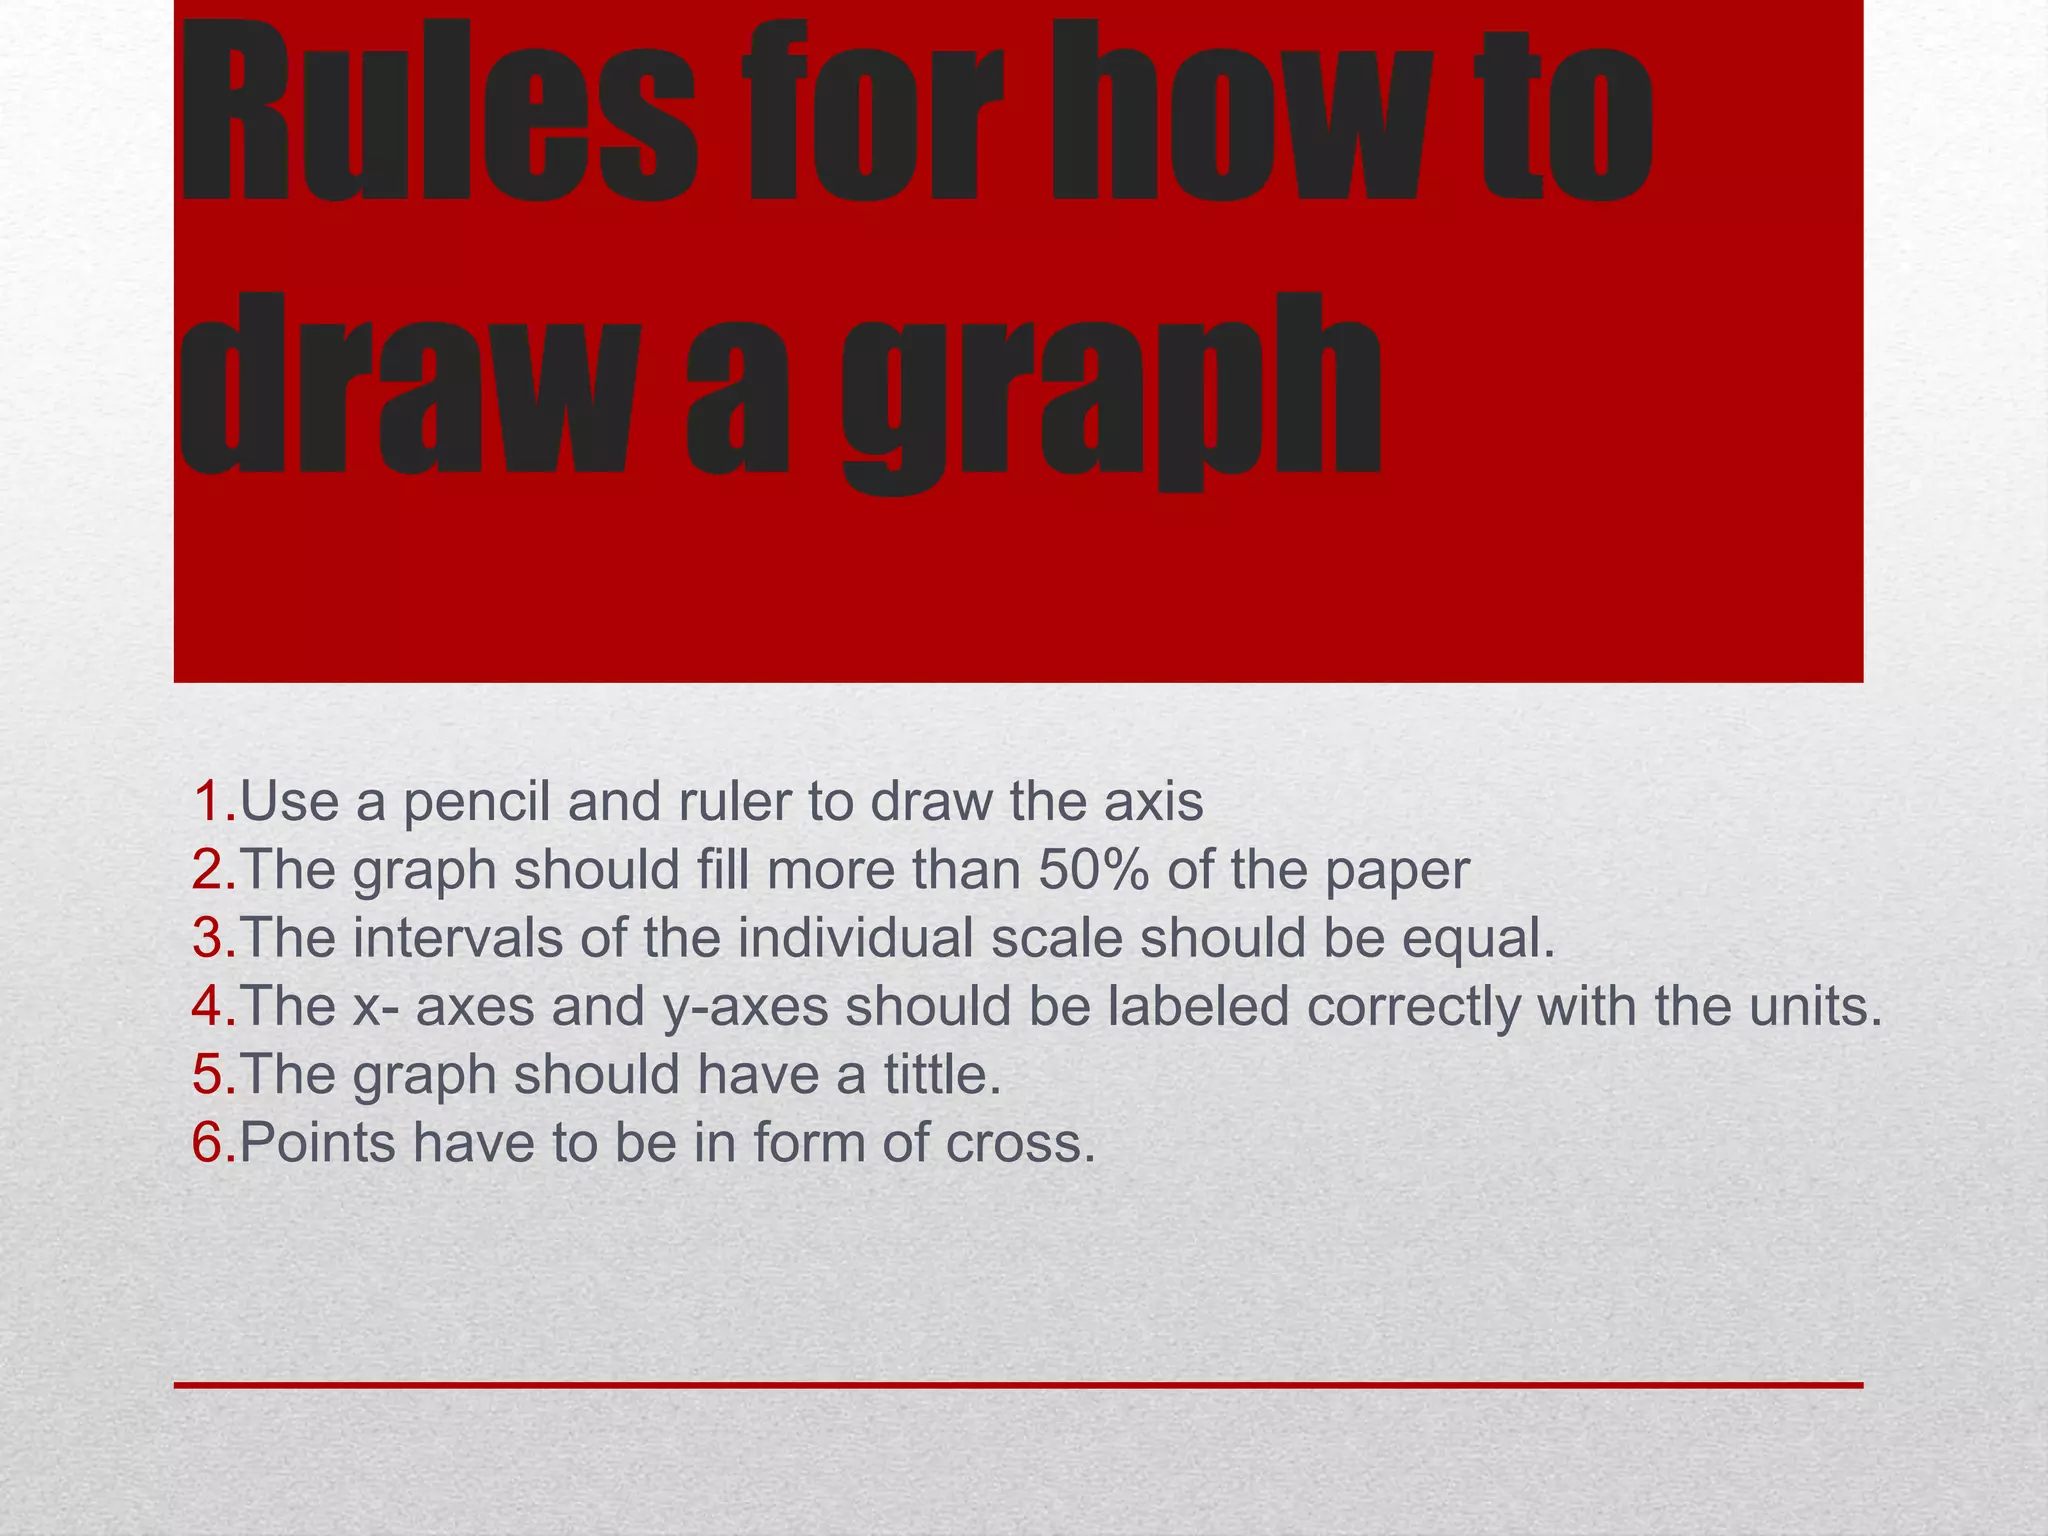
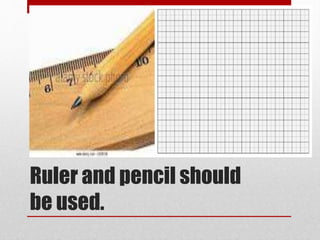
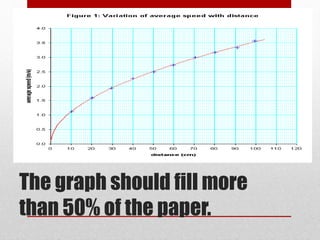
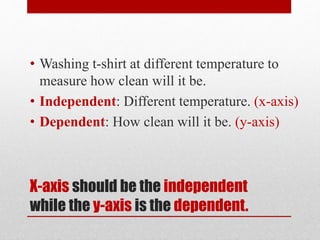
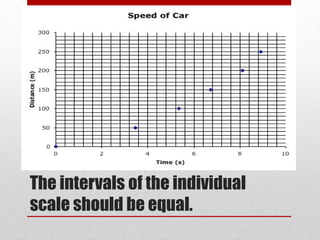
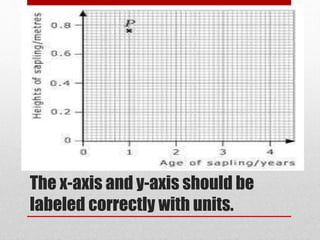
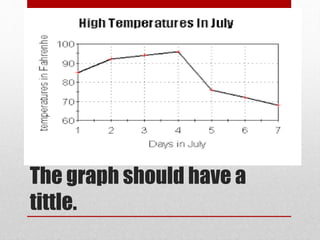
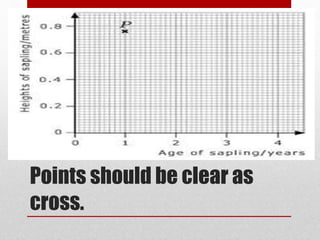
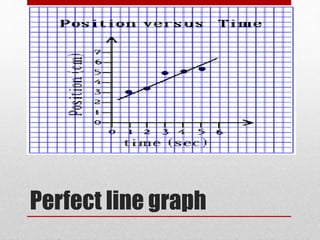
The document provides rules for drawing a graph, including using a pencil and ruler to draw the axes, ensuring the graph fills over 50% of the paper, and using equal intervals on each scale. The axes should be labeled correctly with units and the graph should have a title, with points marked as crosses. An example experiment is provided to measure t-shirt cleanliness at different temperatures.