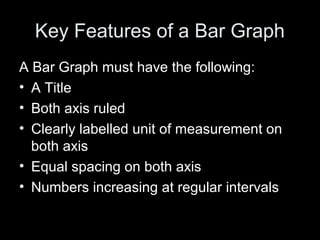
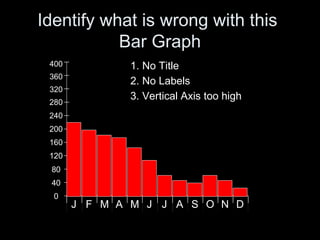
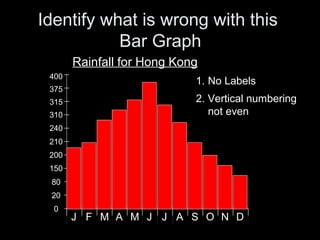
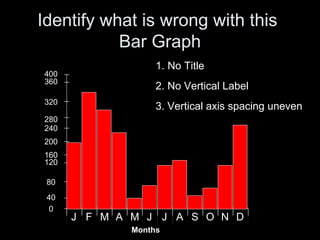
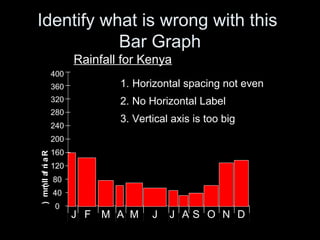
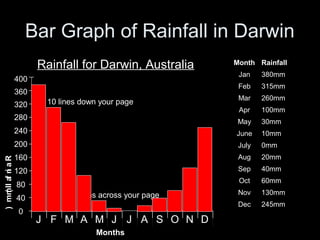
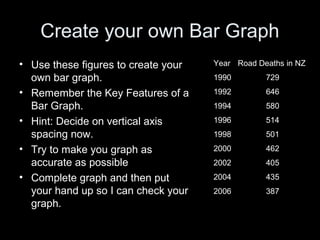
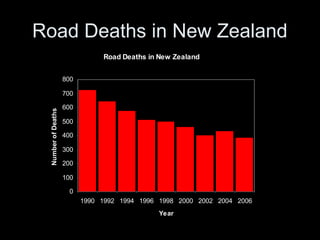
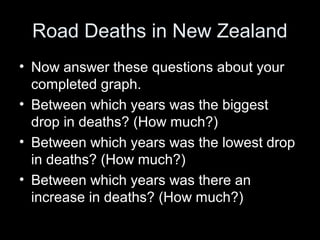
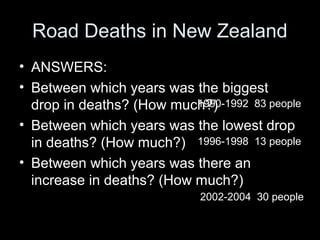
This document provides information about key features of bar graphs and examples of bar graphs that are incorrectly labeled or formatted. It discusses elements all bar graphs should contain like a title, labeled axes with regular intervals, and consistent spacing. Samples shown have issues like missing titles, unlabeled or uneven axes, and scale disproportionate to the data. The document demonstrates how to correctly format a bar graph of monthly rainfall in Darwin, Australia. Learners are then asked to create their own bar graph of road deaths in New Zealand from 1990 to 2006 and analyze changes in the numbers.